

Introduction
Human activities are rapidly transforming our planet, driving major changes in environmental conditions that disrupt habitats, reshape entire ecosystems, and threaten their essential ecosystem functions (Rillig et al. Reference Rillig, Ryo and Lehmann2021). Escalating carbon dioxide emissions are intensifying global warming, causing shifts in the distribution of plants, animals and other organisms, and threatening species with displacement or extinction (Pecl et al. Reference Pecl, Araújo, Bell, Blanchard, Bonebrake, Chen, Clark, Colwell, Danielsen and Evengård2017; Rubio-Salcedo et al. Reference Rubio-Salcedo, Psomas, Prieto, Zimmermann and Martínez2017; Newbold Reference Newbold2018; Stapper & Windisch Reference Stapper and Windisch2020). Additionally, the intensification of agriculture and the expansion of urban areas are drastically altering landscapes, further impacting habitats and creating a complex dynamic of ecological winners and losers (Newbold et al. Reference Newbold, Hudson, Hill, Contu, Lysenko, Senior, Börger, Bennett, Choimes and Collen2015; Ellis & Coppins Reference Ellis and Coppins2019; Semenchuk et al. Reference Semenchuk, Plutzar, Kastner, Matej, Bidoglio, Erb, Essl, Haberl, Wessely and Krausmann2022). In the face of these widespread environmental changes, certain organisms, such as lichenized fungi, serve as valuable indicators, offering insights into the condition and stability of ecosystems (Khastini et al. Reference Khastini, Sari, Herysca and Sulasanah2019; Nascimbene et al. Reference Nascimbene, Benesperi, Giordani, Grube, Marini, Vallese and Mayrhofer2019; Łubek et al. Reference Łubek, Kukwa, Jaroszewicz and Czortek2021).
Climate plays a pivotal role in determining species distribution patterns across the globe (IPCC Reference Pachauri and Meyer2014). Over recent decades, the accelerated speed of changes in global climate patterns has significantly impacted biodiversity, via alterations in temperature, precipitation, and the frequency of extreme weather events (IPCC Reference Lee and Romero2023). These climate shifts directly impact ecosystems, altering species distributions, transforming habitat conditions and disrupting ecosystem functions on a global scale (Gottfried et al. Reference Gottfried, Pauli, Futschik, Akhalkatsi, Barančok, Benito Alonso, Coldea, Dick, Erschbamer and Fernández Calzado2012; Lenoir & Svenning Reference Lenoir and Svenning2015; Ellis Reference Ellis2019). Species at the margins of their distribution, particularly in isolated habitats, are especially vulnerable to environmental change (de Medeiros et al. Reference de Medeiros, Hernández-Lambraño, Ribeiro and Sánchez Agudo2018). Microrefugia, localized areas with favourable microclimates, are crucial for their survival, allowing cold-adapted species to persist outside their main range despite broader regional warming (Dobrowski Reference Dobrowski2011). Such species, typically found at high altitudes or in circumpolar zones, can survive at lower elevations when stable, cool microrefugia are present (Wilmanns Reference Wilmanns2005; Morelli et al. Reference Morelli, Daly, Dobrowski, Dulen, Ebersole, Jackson, Lundquist, Millar, Maher and Monahan2016).
Human-driven land use changes and pollution are major drivers of habitat loss and degradation, having major impacts on the environment and species communities (Lovett et al. Reference Lovett, Tear, Evers, Findlay, Cosby, Dunscomb, Driscoll and Weathers2009; Gerstner et al. Reference Gerstner, Dormann, Stein, Manceur and Seppelt2014). Among these pollutants, nitrogen compounds play a critical role. Driven by intensified agriculture and urban expansion, airborne nitrogen emissions and their deposition have increased significantly, contributing to widespread ecological change (Monteny Reference Monteny2007; Erisman et al. Reference Erisman, Sutton, Galloway, Klimont and Winiwarter2008). Ammonia (NH3), a key nitrogen compound released from manure, fertilizers and livestock farming, significantly affects ecosystems and is a driver of change and homogenization in epiphytic lichen vegetation (Hauck Reference Hauck2011; Pinho et al. Reference Pinho, Dias, Cruz, Sim Tang, Sutton, Martins‐Loução, Máguas and Branquinho2011; Velthof et al. Reference Velthof, van Bruggen, Groenestein, de Haan, Hoogeveen and Huijsmans2012; Greaver et al. Reference Greaver, McDow, Phelan, Kaylor, Herrick and Jovan2023). The impacts of nitrogen compounds cause shifts in species composition and reduce biodiversity (Wolseley et al. Reference Wolseley, James, Theobald and Sutton2006; Marzluff et al. Reference Marzluff, Shulenberger, Endlicher, Alberti, Bradley, Ryan, Simon and ZumBrunnen2008; Vitousek et al. Reference Vitousek, Mooney, Lubchenco, Melillo, Marzluff, Shulenberger, Endlicher, Alberti, Bradley, Ryan, Simon and ZumBrunnen2008; Pinho et al. Reference Pinho, Llop, Ribeiro, Cruz, Soares, Pereira and Branquinho2014). Nitrogen oxides (NOx) from industrial activities and vehicle emissions further exacerbate these effects, favouring nitrogen-tolerant species and altering ecosystem dynamics (Fenn et al. Reference Fenn, Baron, Allen, Rueth, Nydick, Geiser, Bowman, Sickman, Meixner and Johnson2003; Davies et al. Reference Davies, Bates, Bell, James and Purvis2007; Watmough et al. Reference Watmough, McDonough and Raney2014, Reference Watmough, Rabinowitz and Baker2017; Greaver et al. Reference Greaver, McDow, Phelan, Kaylor, Herrick and Jovan2023). Given the considerable spatial and temporal variability of nitrogen emissions, it is crucial to monitor these changes to understand their impact on ecosystems (Battye et al. Reference Battye, Battye, Overcash and Fudge1994). Ammonia concentrations are highly variable in space and time due to their short atmospheric residence time, since NH3 is effectively removed by dry and wet deposition (Fangmeier et al. Reference Fangmeier, Hadwiger-Fangmeier, van der Eerden and Jäger1994). Lichens are particularly valuable for detecting and assessing these changes due to their sensitivity to airborne nitrogen compounds (Sutton et al. Reference Sutton, Burt, Howard, Erisman, Billen, Bleeker, Grennfelt, van Grinsven and Grizzetti2012; Bosanquet Reference Bosanquet2019). This makes them valuable tools for understanding the broader effects of human activities on epiphyte communities and their ecological dynamics (Wolsely et al. Reference Wolsely, Sutton, Leith and van Dijk2010).
Different types of nitrogen compounds are critical indicators of land use intensity, urbanization and human-induced environmental changes. As mentioned, livestock farming significantly contributes to atmospheric NH3 emissions (Sutton et al. Reference Sutton, Burt, Howard, Erisman, Billen, Bleeker, Grennfelt, van Grinsven and Grizzetti2012), while NOx from combustion processes are prevalent in urban areas with heavy traffic (Galloway et al. Reference Galloway, Townsend, Erisman, Bekunda, Cai, Freney, Martinelli, Seitzinger and Sutton2008). These emissions not only reflect patterns of land use and urbanization, but also have direct implications for biodiversity and ecosystem functioning. Isotopic analysis of nitrogen using the 15N/14N ratio (δ15N) serves as a reliable indicator for assessing the effects of nitrogen deposition on different biota (Robinson Reference Robinson2001). It allows the tracing and quantification of nitrogen sources by analyzing δ15N values in organisms such as lichens, which accumulate atmospheric nitrogen over time (Boltersdorf et al. Reference Boltersdorf, Pesch and Werner2014; Munzi et al. Reference Munzi, Branquinho, Cruz, Máguas, Leith, Sheppard and Sutton2019).
Lichens are widely recognized as reliable indicators of air quality, but also of ecological continuity and the effects of climatic changes (Nimis et al. Reference Nimis, Scheidegger and Wolseley2002; Bartholmess et al. Reference Bartholmess, Erhardt and Frahm2004; Aptroot et al. Reference Aptroot, Stapper, Košuthová, van Herk and Letcher2021; Thakur et al. Reference Thakur, Bhardwaj, Kumar and Rodrigo-Comino2024). Their ability to provide cumulative responses to ecological shifts, whether over short or long time frames, makes them particularly valuable for monitoring changes in ecosystems (Thakur et al. Reference Thakur, Bhardwaj, Kumar and Rodrigo-Comino2024). Their community composition is influenced by differences in forest stand composition, climate, and exposure to nitrogen- and sulphur-containing compounds in the atmosphere, highlighting their role in reflecting the integrity of ecosystems (Jovan & McCune Reference Jovan and McCune2005; Fenn et al. Reference Fenn, Geiser, Bachman, Blubaugh and Bytnerowicz2007; Frati et al. Reference Frati, Santoni, Nicolardi, Gaggi, Brunialti, Guttova, Gaudino, Pati, Pirintsos and Loppi2007; Geiser & Neitlich Reference Geiser and Neitlich2007; Rogers et al. Reference Rogers, Moore and Ryel2009; McMurray et al. Reference McMurray, Roberts and Geiser2015; Trifonova & Salmin Reference Trifonova and Salmin2019). Among these stressors, reduced and oxidized nitrogen compounds play a dual role. On the one hand they are a source of an essential nutrient, enhancing growth to some lichens in low to moderate doses; on the other hand they can become detrimental at high concentrations (Geiser et al. Reference Geiser, Jovan, Glavich and Porter2010; Johansson et al. Reference Johansson, Palmqvist and Olofsson2012).
We aimed to investigate the impacts of climate change and land use intensification on the cold-adapted epiphytic lichen species Cetraria sepincola (Ehrh.) Ach. Since land use intensification increases the deposition of nitrogen compounds, we use this species as a sentinel to assess both nitrogen levels and climate conditions. Our study is focused on south-west Germany (Baden-Württemberg), a region known for its refugia of cold-adapted species (Wirth & Türk Reference Wirth and Türk1973; Wirth Reference Wirth1995). Cetraria sepincola is easily recognized in the field and is therefore an ideal model species to study its response to current environmental stressors with minimal impact on the remaining populations. Our study addressed two primary questions: first, to assess whether the local C. sepincola populations are at the edge of their climatic range, we compared their climatic conditions in Baden-Württemberg with populations across Europe; second, we investigated the abiotic and biotic factors driving population dynamics at the regional scale. These factors include abiotic elements such as climate, substrate and nitrogen deposition, as well as biotic factors such as the composition of lichen communities in their typical microhabitats (e.g. the twigs of Betula pubescens in peat bogs and stone fields). Additionally, the availability and diversity of compatible photobionts are qualitatively examined to understand their role in population stability or decline.
Material and Methods
Study area
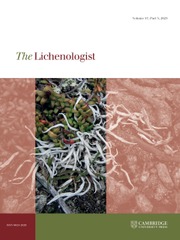
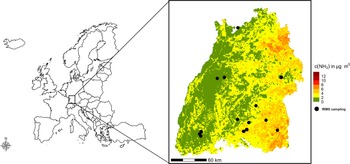
The state of Baden-Württemberg (Germany) presents a heterogeneous environment, shaped by diverse land use patterns, including agricultural areas, forests, urban regions and industrial zones. Agricultural intensity varies across the state and is reflected in the varying emission levels of NH3 (Fig. 1). High concentrations of NH3 are typically found in areas with intensive farming practices (eastern and south-eastern Baden-Württemberg). The region’s elevation ranges from 85 m to 1493 m, with mean annual temperatures between 4.8 °C and 10.9 °C and annual precipitation from 640 mm to 2000 mm, creating a varied climatic landscape. Although true alpine elevations and climates are absent from the region, some areas in its montane zones and extensive peatlands offer refugia for presumed glacial relict species (Wirth & Türk Reference Wirth and Türk1973). This includes several lichen species that are considered cold-adapted due to their distribution patterns at both regional and global scales (Wirth Reference Wirth1995, Reference Wirth2022). Baden-Württemberg is an ideal region for studying the effects of climate change and land use intensity, especially nitrogen-related impacts. This is due to the extensive published data on historical lichen distribution (Bertsch Reference Bertsch1955; Wirth Reference Wirth1995; Schiefelbein & Wirth Reference Schiefelbein and Wirth2025) and the availability of detailed information on nitrogen compound concentrations and deposition.
Map of the study sites showing Isotope-Ratio Mass Spectrometry (IRMS) sampling locations (black dots) in the state of Baden-Württemberg, and set within the regional context. Ammonia background concentration levels (c(NH3) in μg m−³) are displayed and are provided by the State Agency for Environment Baden-Württemberg (LUBW 2020a). The data indicate that eastern Baden-Württemberg has higher NH3 concentrations than other regions, primarily due to more intensive agricultural activities and livestock farming.
Study organism and occurrence data
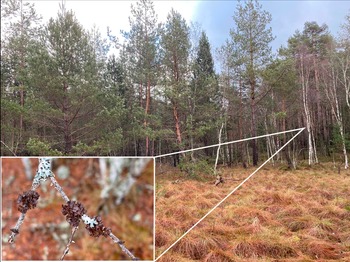
Cetraria sepincola (syn. Tuckermannopsis sepincola (Ehrh.) Hale) is an epiphytic lichen that is critically endangered in Baden-Württemberg (Wirth Reference Wirth2008), and primarily colonizes twigs and bark of Betula species (Bertsch Reference Bertsch1955; Wirth & Türk Reference Wirth and Türk1973). The species forms small, cushion-like brown thalli with irregular lobes and numerous apothecia on the surface (Fig. 2). In Germany it thrives in cold, (sub-)continental regions, particularly in fringe forests of bogs, valleys and cool stone fields in montane areas (Dettner Reference Dettner1985; Wirth Reference Wirth1995, Reference Wirth2008; Wirth et al. Reference Wirth, Hauck and Schultz2014). In Northern countries and in the Central Alps it occupies a wider range of substrates, including a large variety of tree and shrub species with acidic bark (Schittengruber Reference Schittengruber1960), and rare occurrences on tree species other than Betula but with an acidic bark have also been reported from the Czech Republic (Malíček et al. Reference Malíček, Palice, Bouda, Knudsen, Šoun, Vondrák and Novotný2025). In the study area, it is predominantly found on old twigs of Betula pubescens, on exposed branches at the tree crown’s edge, favouring high-light, open habitats such as the margins of raised bogs, stone fields, or open wood pastures. The species has experienced a dramatic decline in recent decades (see Supplementary Material Fig. S1, available online). Once abundant in the Black Forest and Upper Swabia, especially near peatlands, rock screes and wooded meadows in depressions with cold-air pools (Wirth & Türk Reference Wirth and Türk1973; Wirth Reference Wirth2008), C. sepincola has seen significant population losses. Many local populations disappeared between the late 1970s and the early 2000s (Wirth Reference Wirth2008). Historical occurrences of C. sepincola in Baden-Württemberg were assembled from published records (Rabenhorst & Grunow Reference Rabenhorst and Grunow1884; Bertsch Reference Bertsch1955; Wirth & Türk Reference Wirth and Türk1973; Wirth Reference Wirth1981, Reference Wirth1995, Reference Wirth2008, Reference Wirth2022; Dettner Reference Dettner1985; Cezanne et al. Reference Cezanne, Eichler, Hohmann and Wirth2008). Based on published literature on the species’ occurrence in the study area, potential sites were systematically investigated. The distribution map from Wirth (Reference Wirth1995) played a crucial role in narrowing down the search area. Using data from this map, we focused on open stands of Betula pubescens, particularly near peatlands, montane boulder fields, and open wooded meadows. The search was further refined using aerial maps and shape data from the biotope mapping of Baden-Württemberg, which helped identify sites with potentially suitable habitats (LUBW 2025). Each site visit was carefully documented in field books. To protect the species and prevent unauthorized collection, we give information on the regions where the sampling was carried out (following the classification by Ssymank (Reference Ssymank1994)) but do not publish precise occurrence data (Supplementary Material Table S1, available online) and have shared site information only with the Regional Administrative Districts of Baden-Württemberg. Occurrence data from other parts of Europe, from the time period 1970–2024 was obtained from the Global Biodiversity Information Facility (GBIF) using a polygon encompassing all European states (GBIF 2024). This data allowed us to test the hypothesis that local populations occur at the climatic margins of their ecological and geographical ranges.
Cetraria sepincola (inset) in its typical habitat in south-western Germany. Inset image shows the species growing on a Betula pubescens twig at the forest edge in the Northern Black Forest (Grindenschwarzwald). In colour online.

Population metrics, habitat characteristics and abiotic environmental variables
Since population size alone can be biased by differences in habitat tree count and the total area of the sites, we calculated population density per m2 and per habitat tree for each location (Giordani & Brunialti Reference Giordani, Brunialti, Upreti, Divakar, Shukla and Bajpai2015). This allowed us to develop a combined metric that relates tree density to population density. To standardize the results, we calculated the mean population density and population per tree across all sites. Using these values, we created a relative population density index, which reflects the condition of each population by comparing local densities to the overall averages. For the analysis, values were rounded to the nearest integer.
As ground truthing, we measured NO₂ and NH₃ concentrations using passive samplers (Passam AG, Männedorf, Switzerland) (European Commission 2009) at five sites, representing varying population sizes or historical presence of Cetraria sepincola. Sampling took place in three seasons during 2022 to capture seasonal variation (Supplementary Material Figs S2 & S3, available online). To assess the impact of nitrogen compounds on epiphytic lichens, we used Hypogymnia physodes (L.) Nyl., which is a common species without particular conservation value and which was present at all study sites as an ecological proxy (Bruteig Reference Bruteig1993; Ciężka et al. Reference Ciężka, Górka, Trzyna, Modelska, Łubek and Widory2022). This approach enabled us to examine the nitrogen content (Ntotal and δ15N) of the lichen community without the need to sample thalli of C. sepincola. This also enabled us to measure nitrogen deposition at the level of lichen thalli in sites with and without surviving C. sepincola populations. We could then use H. physodes as integrative proxies, providing an indirect measure of cumulative nitrogen exposure at each site. Samples of H. physodes were collected from 17 sites with current or historical C. sepincola populations between February and October 2022. Samples were stored in paper bags at −20 °C until analysis. For analysis, the lichens were ground with a ball mill and then stored in Eppendorf tubes. Each thallus was analyzed twice, and the results were averaged to minimize measurement error. For each analysis, 3 mg of the powdered sample was weighed and encapsulated in aluminium foil, then analyzed using an isotope-ratio mass spectrometer (IRMS) (Euro EA-CHNSO Elemental Analyser; EuroVector, Pavia PV, Italy). The analysis was conducted at the University of Hohenheim (Institute of Food Chemistry and Analytical Chemistry).
Bark samples were collected with a knife from the same Betula pubescens and B. pendula trees used for IRMS sampling, and stored in paper bags. The samples consisted solely of the outer bark layer and did not include any sapwood. We ensured that samples were taken from areas mostly free of stem run-off, algae, or other non-lichen epiphytes. All remaining epiphytes were removed from the samples before measurements were taken. Two bark samples, each c. 4 cm², were taken from each tree and pH was measured with a flathead pH electrode (Extech PH100; Extech Instruments, New Hampshire, USA). To determine the pH, 1 ml of 0.25 M KCl was applied to the bark, and after allowing 5 min for stabilization, the pH was recorded (Kricke Reference Kricke, Nimis, Scheidegger and Wolseley2002). The pH values from the two samples were averaged for each tree. For each site, the data from multiple tree samples (typically 3–5) were averaged to provide a representative value.
To assess the abiotic conditions of the study area, including climate and land use, we utilized a variety of raster datasets from multiple sources which we standardized in extent and resolution using the terra package (Hijmans et al. Reference Hijmans, Bivand, Pebesma and Sumner2023). Climate variables were sourced from the WorldClim 2.1 database at a resolution of 30 arc-seconds, equivalent to c. 1 km² (1970–2000) (Booth et al. Reference Booth, Nix, Busby and Hutchinson2014; Fick & Hijmans Reference Fick and Hijmans2017). Additional bioclimatic variables were generated using the envirem and spatialEco R packages, which incorporated extra-terrestrial solar radiation data and monthly climate and elevation data from WorldClim (Supplementary Material Table S2, available online) (Title & Bemmels Reference Title and Bemmels2018; Evans & Murphy Reference Evans and Murphy2023). For nitrogen levels, we utilized NH3 concentration (μg m−3) and annual total nitrogen deposition (kg ha−1 a) data from the State Agency for Environment Baden-Württemberg (LUBW), mapped on a 100 m × 100 m grid as a 5-year average (LUBW 2020a, b; Gauger et al. Reference Gauger, Hug, Hoelscher, Jakobs, Schaap, Coenen, Rihm, Kuenzle, Zirlewagen and Lorentz2023). Since NOₓ data is not available for the study area, we used total nitrogen deposition as a proxy for NOₓ pollution to provide a relevant measure of nitrogen input. By using total nitrogen deposition, we were able to assess nitrogen exposure at a landscape scale, providing a relevant alternative measure to NOₓ. This dataset was used to create the surrounding nitrogen background data for the sampled trees, by averaging nitrogen levels within a 500, 1000 and 5000 m radius (in the following buffer500, buffer1000 and buffer5000, respectively) around each tree to obtain a more robust estimate, rather than relying on a single point value (Supplementary Material Table S3, available online).
Biotic factors
To better understand potential biotic interactions influencing the occurrence and persistence of Cetraria sepincola, we conducted detailed surveys of the epiphytic lichen communities at each study site. By documenting all lichen species present in the accessible canopy of habitat trees and fallen twigs, we aimed to capture variation in community structure and composition. These patterns may reveal competitive pressures, habitat suitability, or the presence of compatible photobionts, all of which could shape the local dynamics of this locally rare species. We also documented free-living algae growing on the same twigs, providing additional insight into the broader microhabitat context. To test for potential genetic differences between sites, we obtained barcodes for the internal transcribed spacer regions (ITS) of the mycobiont from selected specimens of C. sepincola. Due to conservation concerns, we collected specimens conservatively, preferably, for example, specimens from twigs which had already fallen to the ground. Molecular data on the identity of the photobionts from C. sepincola are currently available only for collections from Iceland (Xu et al. Reference Xu, de Boer, Olafsdottir, Omarsdottir and Heidmarsson2020). We subsequently identified the associated photobiont by obtaining an ITS barcode to determine whether the populations in SW Germany share the same photobiont as the Icelandic collections and to test the range of specificity in our study area. Cetraria sepincola does not produce any vegetative propagules and relies on access to compatible algal strains to establish its thalli after germination of its spores with these algal partners, originating either from other lichens or free-living populations. We also analyzed the photobiont of H. physodes, which often co-occurs with C. sepincola in the same community and produces large quantities of soredia as vegetative means of dispersal for fungal and algal cells combined. It could therefore potentially serve as one of the donors for the algal partner of C. sepincola. At some sites in the study area, typical representatives of the nitrophytic Xanthorion communities (including Physcia adscendens H. Olivier, P. tenella (Scop.) DC., Polycauliona polycarpa (Hoffm.) Frödén et al. and Xanthoria parietina (L.) Th. Fr.) co-exist on the same twigs as C. sepincola. A spread of Xanthorion species in previously acidophytic lichen communities is a widespread occurrence in forests across SW Germany (Stapper & Aptroot Reference Stapper and Aptroot2023). We sampled species from Xanthorion communities at the same microsites as C. sepincola relict populations. Our goal was to determine whether C. sepincola shares photobionts with either H. physodes or Xanthorion lichens, and if the replacement of specific algae can potentially lead to the decline of algal strains essential for C. sepincola during the transition to Xanthorion-dominated communities.
DNA extractions, PCR amplification and sequencing
Genomic DNA was extracted using a NucleoSpin Plant II Mini Kit (Machery-Nagel, Düren, Germany) according to the manufacturer’s instructions, but with the initial lysis period extended overnight and final elution in two steps with 35 μl each. For PCR amplification, we used the MyTaq Red Mix (Meridian Bioscience, Cincinnati, USA). The internal transcribed spacer regions were amplified using the primer pair ITS1T/ITS4T (Kroken & Taylor Reference Kroken and Taylor2000) for photobionts and ITS1/ITS4 (Gardes & Bruns Reference Gardes and Bruns1993; White et al. Reference White, Bruns, Lee, Taylor, Innis, Gelfand, Sninsky and White1994) for mycobionts. PCR conditions followed the protocols described in Kroken & Taylor (Reference Kroken and Taylor2000) and Xu et al. (Reference Xu, de Boer, Olafsdottir, Omarsdottir and Heidmarsson2020). Sequence editing was carried out using BioEdit v. 7.2.5 (Hall Reference Hall1999) and Geneious v. 8.1.9 (https://www.geneious.com). We obtained seven fungal ITS sequences for C. sepincola, and 20 algal ITS sequences from thalli of C. sepincola, H. physodes, Physcia adscendens, Polycauliona polycarpa and X. parietina from sites where we also sampled C. sepincola. Voucher information and GenBank Accession numbers for all sequences are provided in Table 1 (photobionts) and Table 2 (mycobionts).
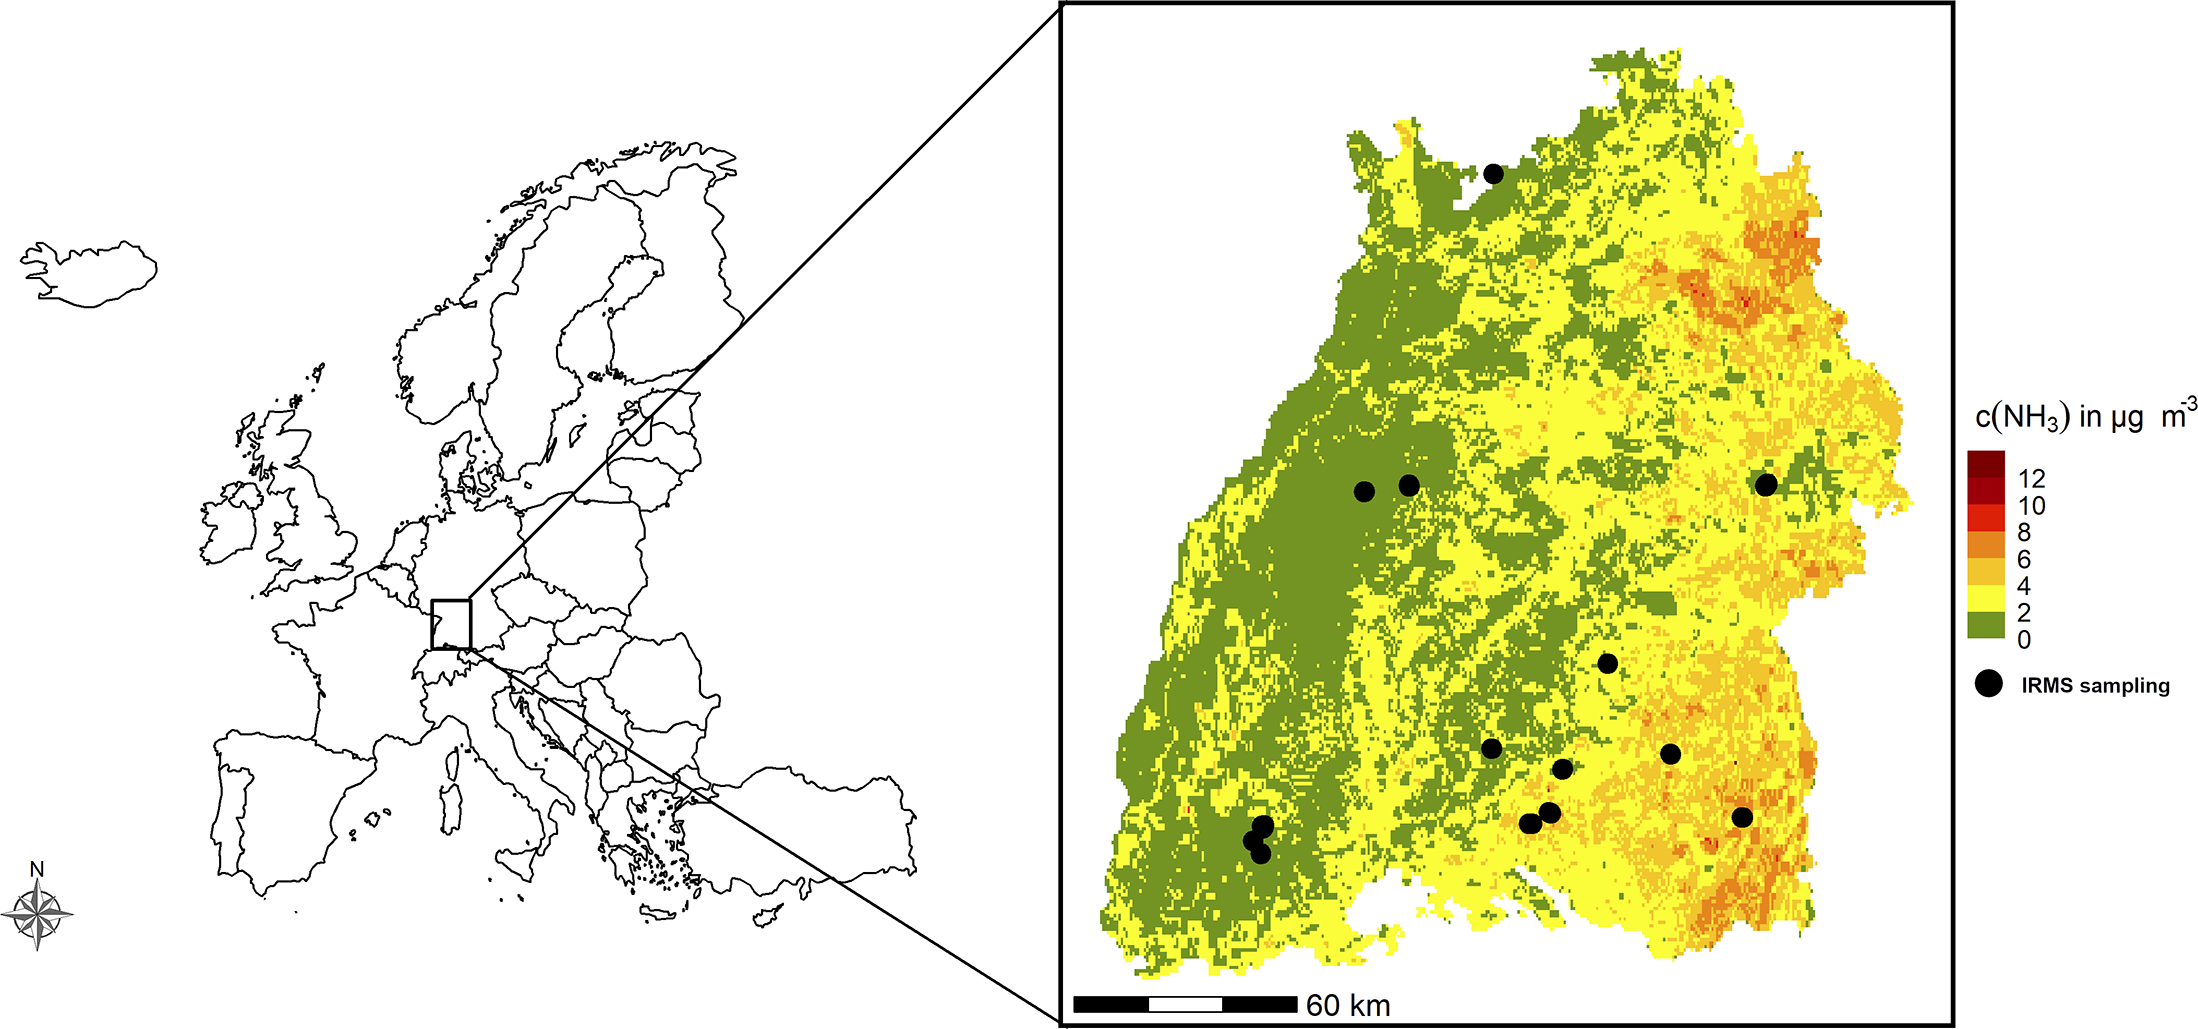
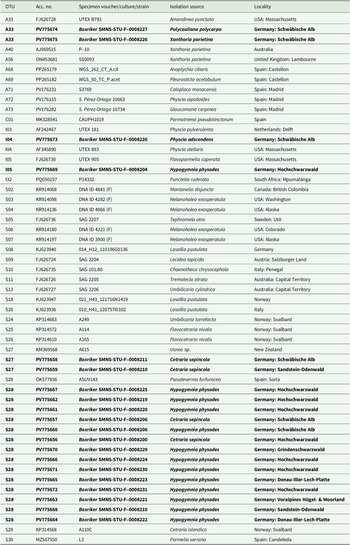
GenBank Accession numbers and voucher information for specimens and cultures of Trebouxia used in the phylogenetic analyses. Taxa are grouped in the table according to their affiliation with Trebouxia superclades, following the classification systems of Muggia et al. (Reference Muggia, Nelsen, Kirika, Barreno, Beck, Lindgren, Lumbsch and Leavitt2020) and Xu et al. (Reference Xu, de Boer, Olafsdottir, Omarsdottir and Heidmarsson2020). OTU codes are assigned following the online portal trebouxia.net (accessed 3 November 2025). New sequences generated in this study are given in bold. UTEX = Algal Culture Collection at University of Texas; SAG = Algal Culture Collection at University of Göttingen; ASUV = Algal collection from the University of Valencia.
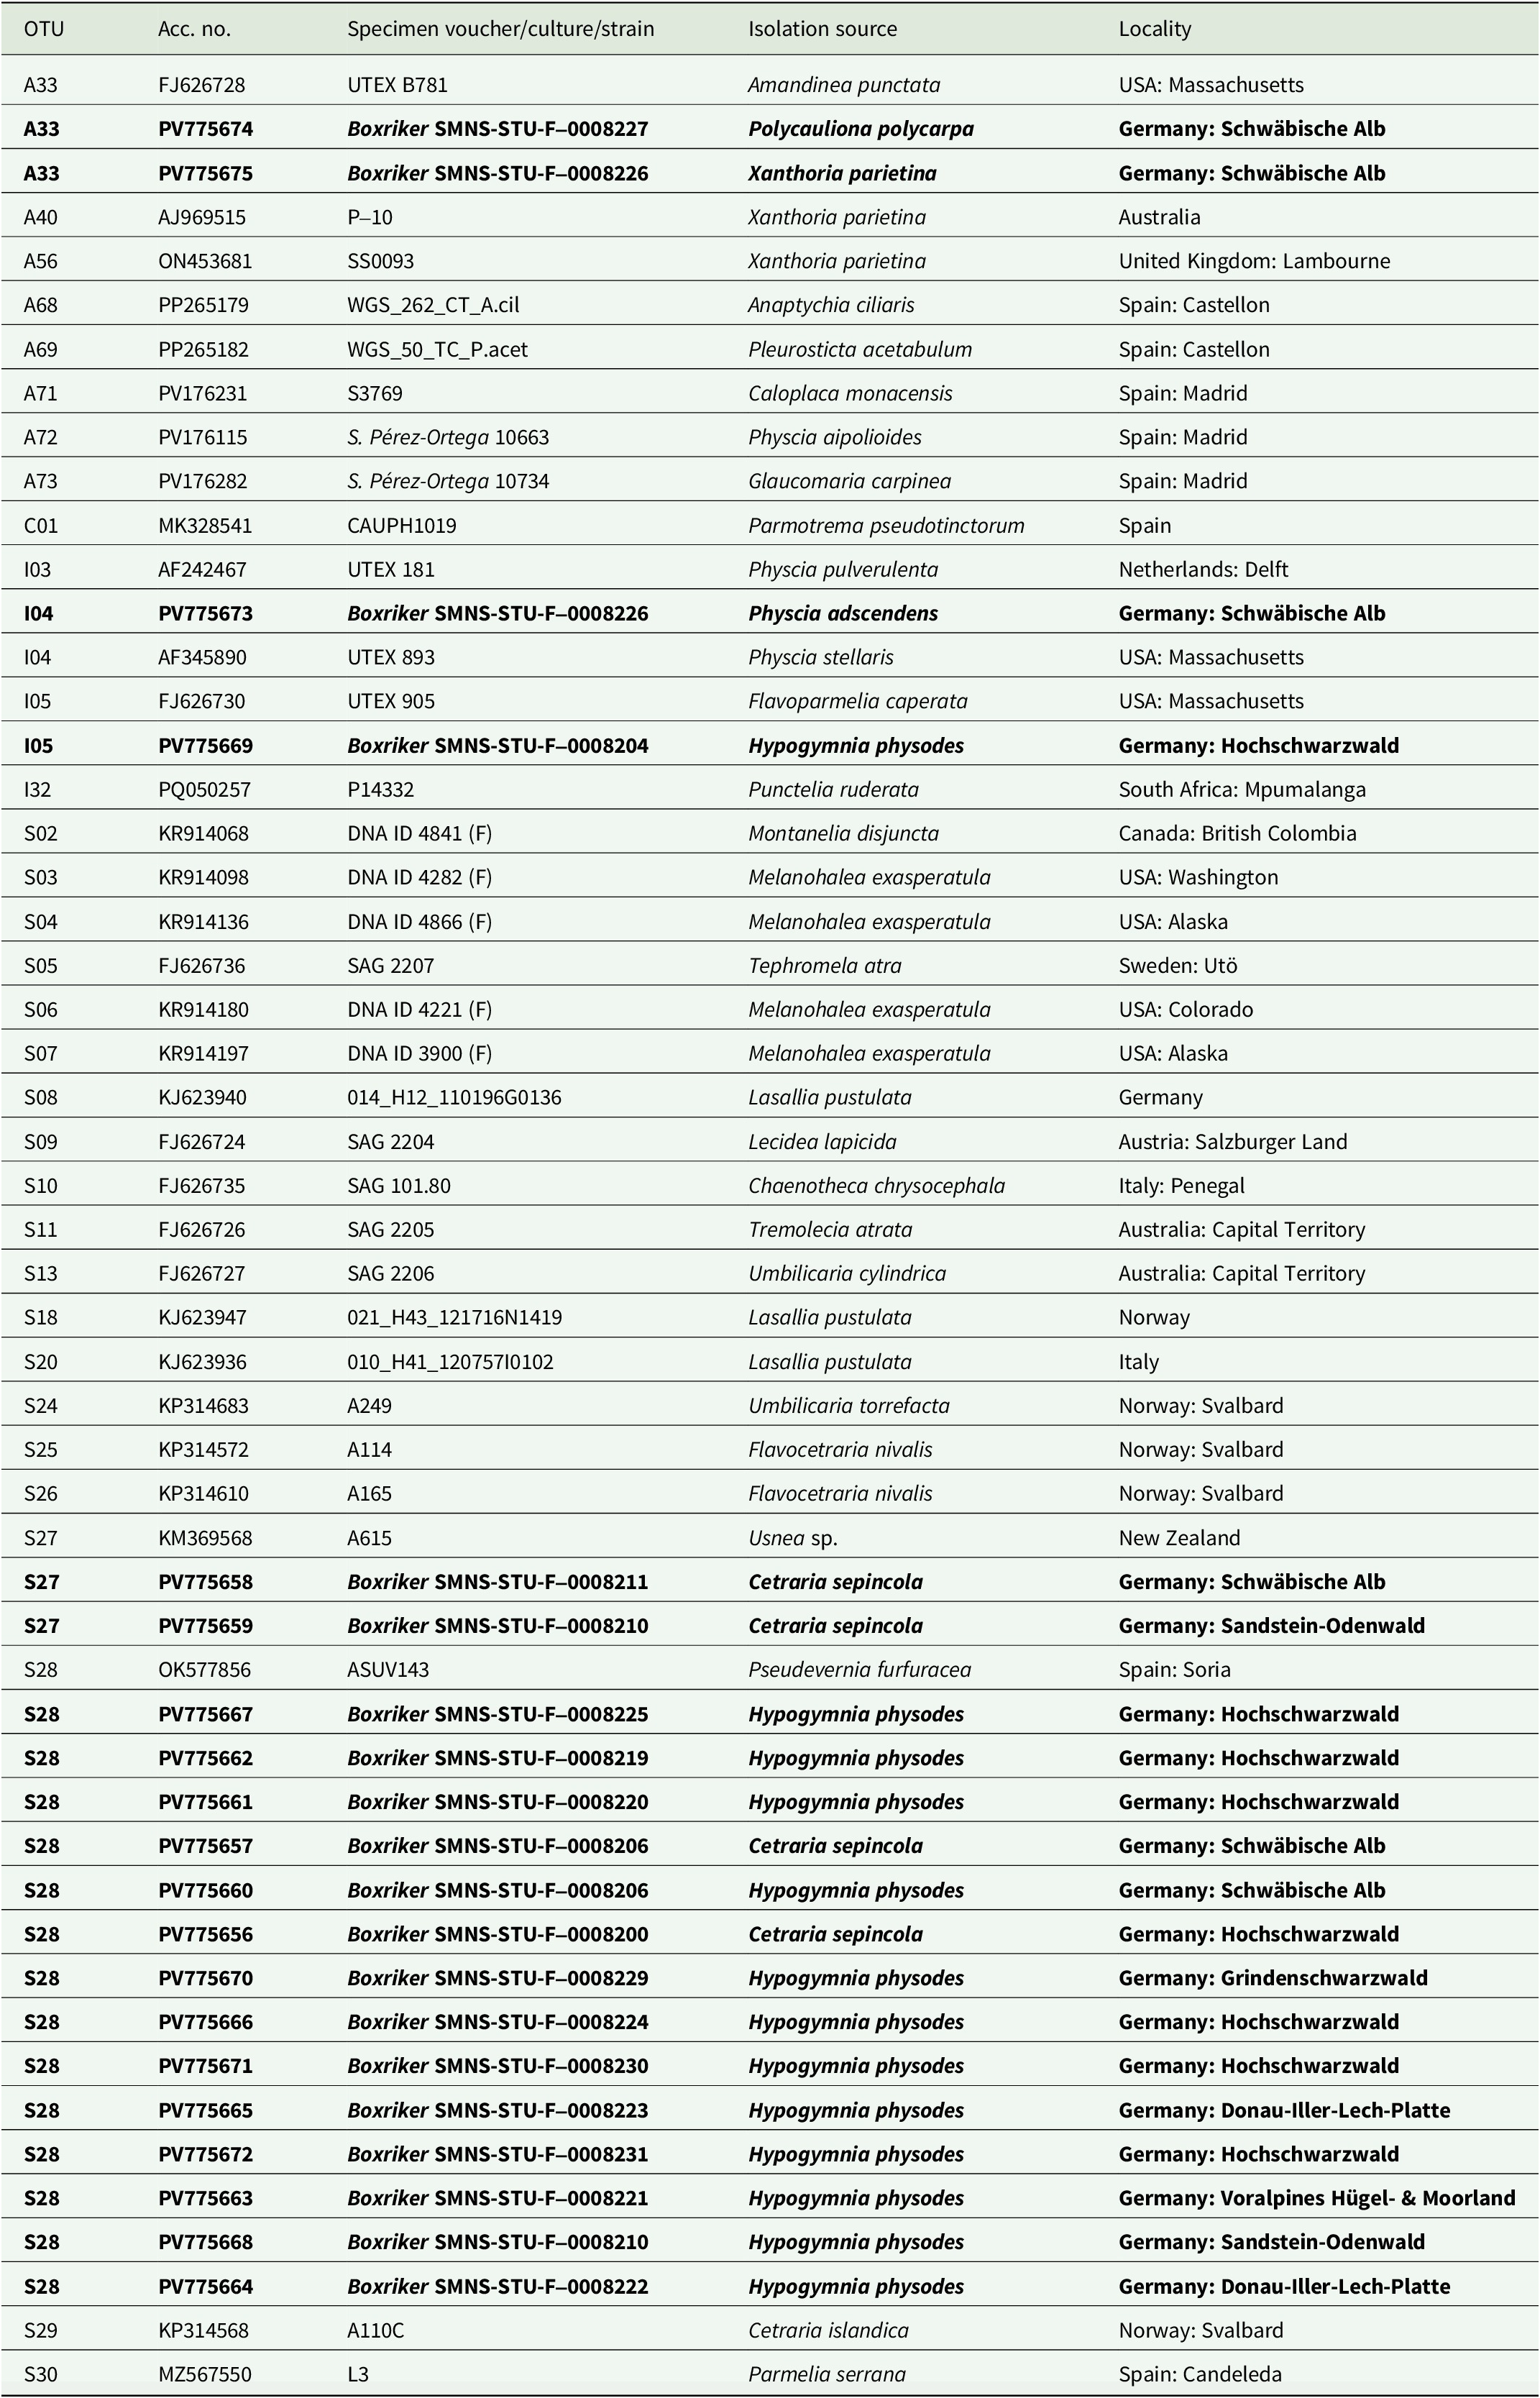
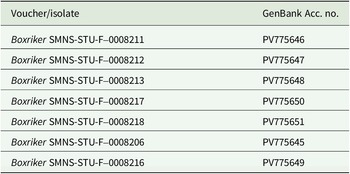
GenBank Accession numbers for newly generated ITS sequences and voucher information for Cetraria sepincola specimens from Baden-Württemberg (SW Germany).
Sequence alignment and phylogenetic analysis
Newly generated mycobiont sequences were compared with other GenBank records using the BLASTn search (Clark et al. Reference Clark, Karsch-Mizrachi, Lipman, Ostell and Sayers2016). For the photobiont data, after an initial BLASTn search, we compiled additional photobiont sequences including the closest BLASTn matches with a named lichen source, as well as a selection of Trebouxia accessions representing the clades A, S and I, as defined by Muggia et al. (Reference Muggia, Nelsen, Kirika, Barreno, Beck, Lindgren, Lumbsch and Leavitt2020) and Xu et al. (Reference Xu, de Boer, Olafsdottir, Omarsdottir and Heidmarsson2020), and carried out a preliminary analysis including all OTU reference sequences for these superclades (not shown). Subsequently, we selected sequences of OTUs with the closest affinity to our data for further analysis (Table 1). For the photobiont data, an alignment was created using MAFFT v. 7 (Katoh et al. Reference Katoh, Rozewicki and Yamada2019) with the L-INS-i method on the online server at https://mafft.cbrc.jp/alignment/server/. Before analysis, we removed excessively long flanking regions of the 18S and 28S rDNA from GenBank reference sequences, which were not covered by our newly generated ITS sequences, as well as ambiguously aligned positions and introns found in only single sequences.
Maximum likelihood-based analyses were carried out with IQ-TREE (Nguyen et al. Reference Nguyen, Schmidt, von Haeseler and Minh2015) on the IQ-TREE web server (http://iqtree.cibivunivie.ac.at) with ultrafast bootstrapping for estimating node supports (Hoang et al. Reference Hoang, Chernomor, von Haeseler, Minh and Vinh2018). Bayesian inference of phylogeny was carried out by Markov chain Monte Carlo sampling as implemented in MrBayes v. 3.3.6 (Huelsenbeck & Ronquist Reference Huelsenbeck and Ronquist2001) using a TIM + 2G model as suggested by jModelTest2 (Guindon & Gascuel Reference Guindon and Gascuel2003; Darriba et al. Reference Darriba, Taboada, Doallo and Posada2012), with two independent chains and 1 000 000 generations, from which every 100th was sampled. The first 25% of the sampled trees was discarded as burn-in. Phylogenetic trees were visualized using FigTree v. 1.4.4 (Rambaut Reference Rambaut2012) and final editing was carried out in Inkscape (https://inkscape.org).
Statistical analysis of ecological data
All statistical analyses were conducted using R v. 4.3.1 (R Core Team 2023). To address the first question, we assessed the climatic conditions of lichen populations in Baden-Württemberg in comparison to other European populations using principal component analysis (PCA). The initial variables are listed in Supplementary Material Table S2 (available online). Prior to the PCA, we addressed multicollinearity in the climate dataset using the ‘vifcor’ function from the R package usdm (Naimi et al. Reference Naimi, Hamm, Groen, Skidmore and Toxopeus2014). Variables with a correlation above 0.7 were excluded through a stepwise procedure (Dormann et al. Reference Dormann, Elith, Bacher, Buchmann, Carl, Carré, Marquéz, Gruber, Lafourcade and Leitão2013; Naimi et al. Reference Naimi, Hamm, Groen, Skidmore and Toxopeus2014). This process resulted in the selection of 10 climate variables: annual potential evapotranspiration; aridity index (aridityIndexThornthwaite; index of the degree of water deficit below water need); isothermality (day–night vs annual oscillation); mean diurnal range (average monthly day–night range); mean temperature of wettest quarter; month count with temperature above 10 °C (monthCountByTemp10); potential evapotranspiration of coldest quarter (PETColdestQuarter; potential water loss through evaporation and transpiration in the coldest three months); potential evapotranspiration of driest quarter (PETDriestQuarter); precipitation of warmest quarter; precipitation seasonality (Supplementary Material Fig. S4, available online). We standardized the climate data using the ‘scale’ function from the stats package before performing the PCA with the ‘princomp’ function (R Core Team 2023). To determine the relative position of the Baden-Württemberg populations within the species’ overall climatic spectrum, we calculated the centroid (mean) of all European occurrence data in the PCA space and measured the Euclidean distance from each site to this centroid (Blonder et al. Reference Blonder, Nogués-Bravo, Borregaard, Donoghue, Jørgensen, Kraft, Lessard, Morueta-Holme, Sandel and Svenning2015). Finally, we used a one-way ANOVA to compare these Euclidean distances between populations in Baden-Württemberg and those in other European regions, allowing us to assess whether the local populations are further from the core of the species’ overall distribution.
To address the second question, on how abiotic and biotic factors influence population dynamics at the regional scale, we selected 14 key environmental variables known to affect lichen growth to assess their impact on our population index (Supplementary Material Tables S2 & S3, available online) (van Herk Reference van Herk2001; Hauck Reference Hauck2010; Nelsen & Lumbsch Reference Nelsen and Lumbsch2020): annual mean temperature, annual potential evapotranspiration, annual precipitation, aspect, continentality, embergerQ, growingDegDays0, δ15N, Ntotal, N buffer500, N buffer5000, NH3 buffer500, NH3 buffer5000, pH bark. The variables were tested for multicollinearity (correlations > 0.7 were excluded) and analyzed with a PCA, from which we selected only those that contributed most significantly to the variance in the data. These prioritized variables were then used in the generalized linear model (GLM) analysis (annual mean temperature, annual potential evapotranspiration, embergerQ, NH3 background concentration (NH3 buffer500), nitrogen background deposition (N buffer500), pH bark) (Supplementary Material Fig. S5, available online). We applied a GLM with a quasi-Poisson distribution. To identify the most suitable model, we calculated the Quasi-Akaike Information Criterion (QAIC) and selected the best-fitting models using the ‘dredge’ function from the MuMIn package (Bartón Reference Bartón2023). Multiple models met the selection criteria (∆QAIC < 2), so we performed model averaging to account for model uncertainty. The importance of each predictor was determined by the percentage of variance it explained, calculated as the absolute value of the standardized regression coefficient for each predictor relative to the sum of all standardized regression coefficients in the model (Le Bagousse-Pinguet et al. Reference Le Bagousse-Pinguet, Soliveres, Gross, Torices, Berdugo and Maestre2019). This approach allowed us to identify the most influential environmental drivers affecting the population of the lichen species.
To explore the relationship between background NH3 levels, total nitrogen deposition and nitrogen content in lichens, we conducted a correlation analysis. Specifically, we compared the Ntotal and δ15N values in lichens with the background NH3 and nitrogen levels. We used the ‘cor.test’ function in R to calculate the Pearson correlation coefficient, which measures the strength and direction of the linear relationship between these variables (R Core Team 2023). Lastly, our collected presence-absence data from the vegetation survey was used to analyze the different lichen communities, utilizing the lichen indicator values from Wirth (Reference Wirth2010). We used the community data to examine variations in environmental conditions across sites as reflected by the lichen communities using the method of Zelený & Schaffers (Reference Zelený and Schaffers2012). To explore differences in these indicator values, we performed a detrended correspondence analysis (DCA) with the vegan package (Oksanen et al. Reference Oksanen, Simpson, Blanchet, Kindt, Legendre, Minchin, O’Hara, Solymmos, Stevens and Szoecs2024).
Results
Climatic isolation of south-western Cetraria sepincola populations
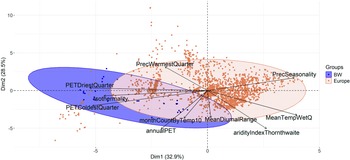
The PCA results indicate that the populations of C. sepincola in Baden-Württemberg are positioned towards the periphery of the species’ climatic spectrum, reflecting distinct climatic conditions for these marginal populations (Fig. 3). The Euclidean distances are significantly greater for the Baden-Württemberg populations than for the European populations in total (Fdf 1,2819 = 78.78, P < 0.001). In comparison to the European collections, the lichen populations in Baden-Württemberg show a stronger association with the predictors annualPET, isothermality, PETColdestQuarter and PETDriestQuarter (Fig. 3). European populations were more strongly associated with precipitation seasonality.
Principal Component Analysis (PCA) of the environmental variables at the population sites of Cetraria sepincola in Europe (red) and Baden-Württemberg (blue) reveal that the populations in Baden-Württemberg are positioned towards the periphery of the species’ climatic spectrum. annualPET = annual potential evapotranspiration; aridityIndexThornthwaite = index of the degree of water deficit below water need; isothermality = (mean diurnal range / temperature annual range) × 100; MeanDiurnalRange = mean of monthly max. temp. – min. temp.; MeanTempWetQ = mean temperature of wettest quarter; monthCountByTemp10 = count of the number of months with mean temp greater than 10 °C; PETColdestQuarter = potential evapotranspiration of coldest quarter; PETDriestQuarter = mean monthly potential evapotranspiration of driest quarter; PrecSeasonality = precipitation seasonality (Coefficient of Variation); PrecWarmestQuarter = precipitation of the warmest quarter. In colour online.

Site and substrate conditions
Substrate conditions were assessed by collecting bark samples, with pH values ranging from 3.84 to 4.88, indicating acidic conditions typical for Betula species. The total nitrogen content (Ntotal) of the analyzed lichen thalli ranged from 0.88 to 2.04%, while the δ15N varied between −15.30 and −7.54 ‰ (Supplementary Material Fig. S6, available online). We found a moderate positive Pearson correlation (r) between total nitrogen content in the lichens (Ntotal) and modelled NH3 background concentrations (r = 0.52, 95% confidence interval (CI) [0.05, 0.80], P = 0.032). The correlation analysis revealed a marginally significant positive relationship between δ15N and modelled NH3 (r = 0.46, 95% CI [−0.03, 0.80], P = 0.063). Similarly, we found a marginally significant positive correlation between δ15N and modelled nitrogen background (r = 0.42, 95% CI [−0.08, 0.70], P = 0.094). Significant positive correlations were observed between bark pH and modelled NH3 concentration (r = 0.61, 95% CI [0.18, 0.84], P = 0.01), as well as between bark pH and modelled nitrogen background deposition (r = 0.64, 95% CI [0.23, 0.86], P = 0.006). The detrended correspondence analysis (DCA) of the mean Ellenberg indicator values (EIV) for each study site revealed clear differences in lichen community composition associated with the presence or absence of C. sepincola (Supplementary Material Table S4 & Fig. S7, available online). The study species was absent from sites where the mean EIVs for nitrogen, reaction (pH) and temperature were higher. In contrast, C. sepincola was present at sites with comparatively lower EIVs for these variables and higher values for moisture.
Quantifying environmental drivers of the population index
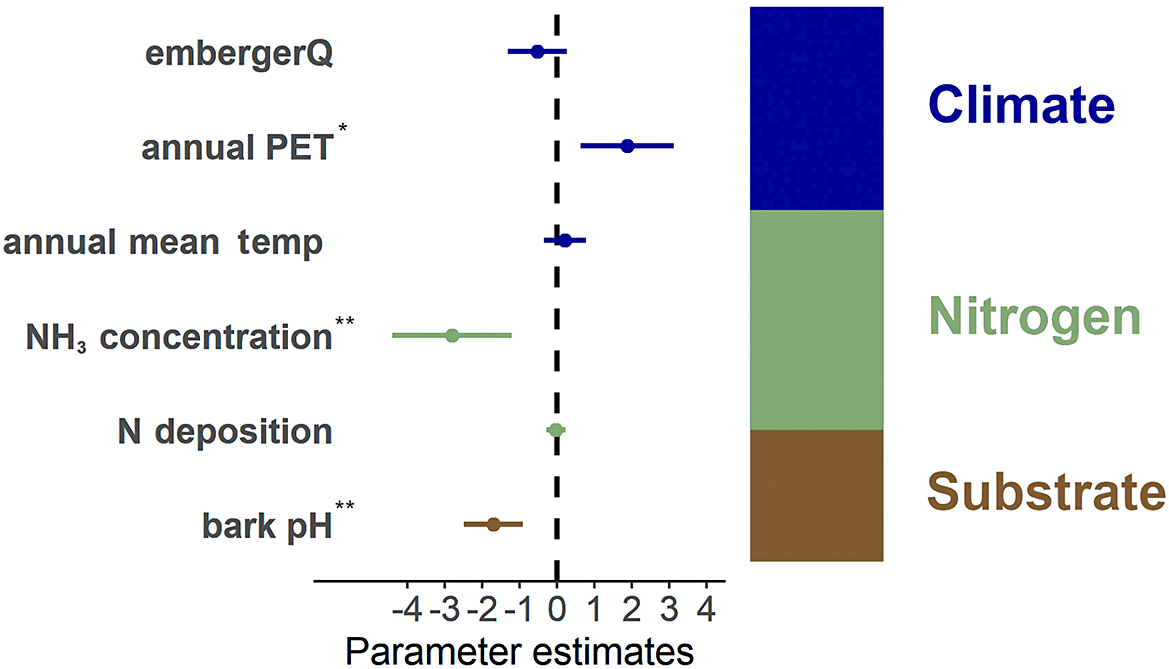
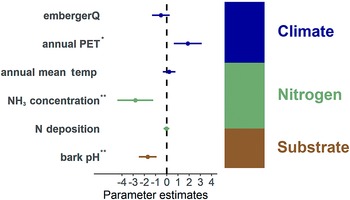
Among the environmental predictors examined, NH3 background and bark pH exhibited a significant negative impact on the population index (Fdf=16 = 3.45, P < 0.001; Fdf=16 = 4.22, P < 0.001; Fig. 4). This suggests that elevated NH3 levels and substrate conditions may have a detrimental effect on the health of the study species. Annual PET had a significant positive effect on the population index with Fdf=16 = 2.95, P = 0.003. Other predictors, including annual mean temperature and nitrogen background deposition, showed minimal effects on the population index and were not significant. EmbergerQ (Emberger pluviothermal quotient) exhibited a weak negative effect on the index, but the results were not statistically significant.
Results of the Generalized Linear Model analysis of the population index. Environmental variables are grouped in three categories: climate (embergerQ, annual PET, annual mean temperature), nitrogen (NH3 concentration, N deposition) and the substrate (bark pH). Dots represent the mean effect estimates, with lines indicating the confidence interval. Effects are considered significant (asterisks) when confidence intervals do not cross the dashed zero line. The stacked bar shows the relative explained variance of each group (%). In colour online.
Results of DNA barcoding and phylogenetic analysis
Results of DNA barcoding and phylogenetic analysis confirmed a high ITS sequence identity (> 99%) of the mycobionts in our C. sepincola from Baden-Württemberg with collections from Eastern Europe, Scandinavia and the Alps (Table 2). Although we have found two different haplotypes in SW Germany, they differed by just two single-base indels which may be within the range that can be expected from sequencing errors. For the photobiont data, our alignment consisted of 53 photobiont sequences with 794 nucleotide sites with 473 constant sites, 240 parsimony-informative sites and 468 distinct site patterns.
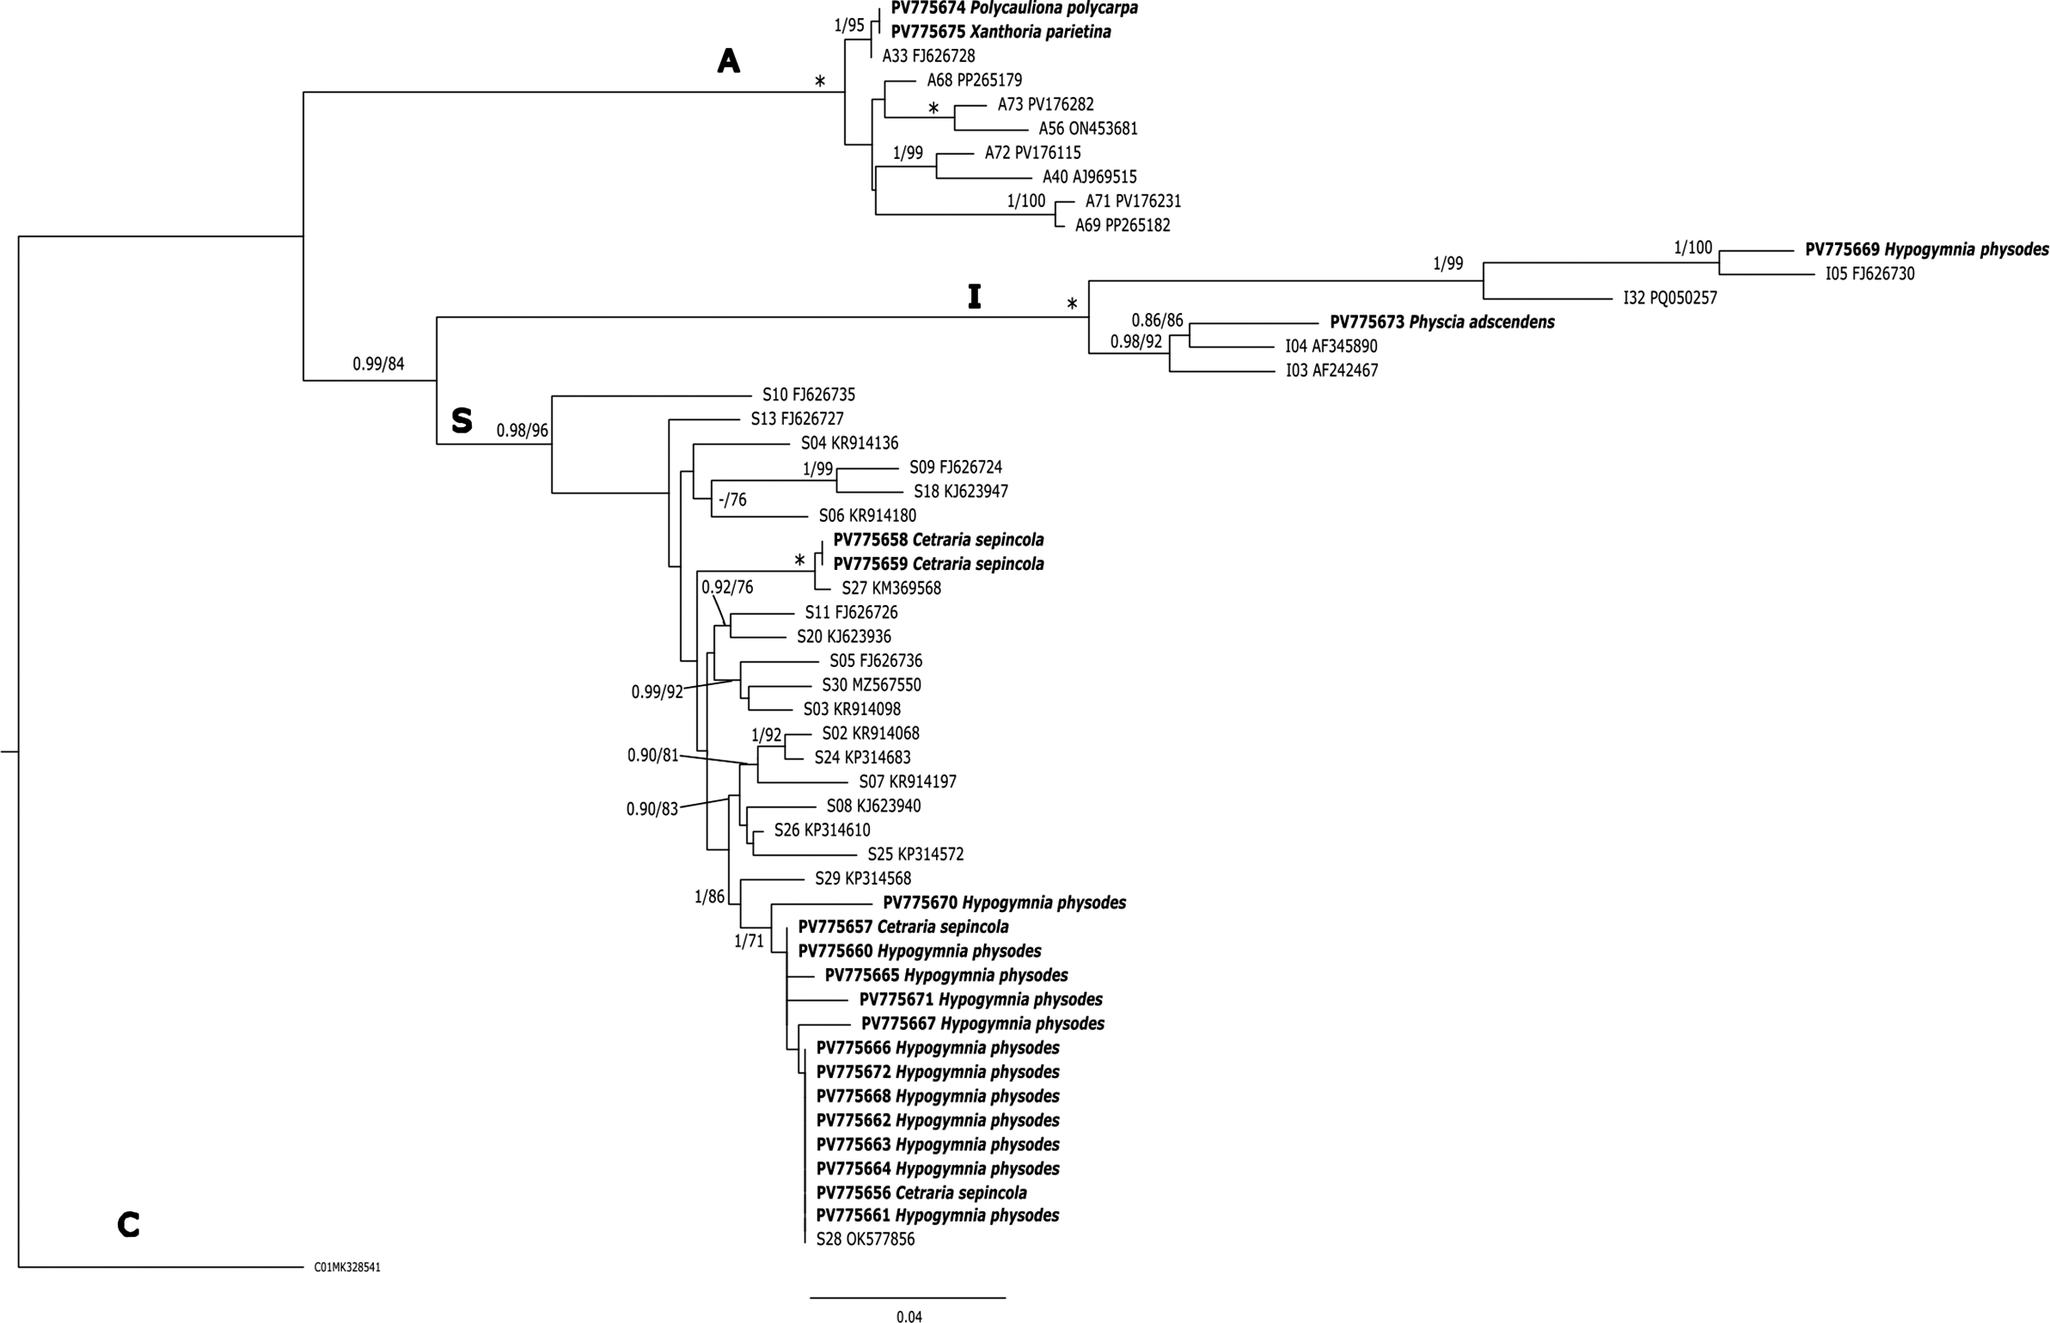
The algal partners in all C. sepincola samples were placed in Trebouxia superclade S (Muggia et al. Reference Muggia, Nelsen, Kirika, Barreno, Beck, Lindgren, Lumbsch and Leavitt2020; Xu et al. Reference Xu, de Boer, Olafsdottir, Omarsdottir and Heidmarsson2020), a superclade which contains common photobionts in many lichen species with a more or less acidophytic tendency. Two of them are identical with OTU S27, and the other two with S28 (Trebouxia barrenoae) in the classification system of the portal trebouxia.net (accessed 3 November 2025). All our sequences are different from the Trebouxia sequences obtained from Icelandic thalli of C. sepincola (Xu et al. Reference Xu, de Boer, Olafsdottir, Omarsdottir and Heidmarsson2020). Samples from Hypogymnia physodes, which co-occurred with C. sepincola, also contained mostly photobionts from superclade S, including samples identical to OTU S28 (T. barrenoae). We also found one thallus of H. physodes with a Trebouxia from clade I (most similar but not identical to the reference for OTU I05). In contrast, other lichen species collected from the same localities as C. sepincola but representing typical components of the nitrophytic Xanthorion community, such as Physcia adscendens, Polycauliona polycarpa and Xanthoria parietina, were found to associate with algal partners from distantly related superclades. Physcia adscendens was associated with a Trebouxia from superclade I (OTU I04), while P. polycarpa and X. parietina were associated with algae from clade A, OTU A33 (Fig. 5).
Phylogenetic hypothesis of Trebouxia algae based on maximum likelihood analysis (ML) of ITS data, with the placement of photobionts of Cetraria sepincola and associated lichens from Baden-Württemberg (SW Germany). A representative of superclade C (OTU C01) was used as outgroup. Values at nodes indicate statistical support of Bayesian posterior probability (left), and maximum likelihood ultrafast bootstrap (right). Superclade names (S, A, I, C) as introduced by Muggia et al. (Reference Muggia, Nelsen, Kirika, Barreno, Beck, Lindgren, Lumbsch and Leavitt2020) and Xu et al. (Reference Xu, de Boer, Olafsdottir, Omarsdottir and Heidmarsson2020) are given above branches, OTU-codes for reference sequences from the portal trebouxia.net (http//trebouxia.net; accessed 3 November 2025) are indicated in front of GenBank Accession numbers. Voucher information for all specimens and cultures is given in Table 1. Fully supported branches are marked with an asterisk. Scale bar shows estimated number of substitutions per site. Newly obtained sequences from collections at currently occupied and historical Cetraria sepincola population sites in Baden-Württemberg are marked in bold.
Discussion
Our study confirms that C. sepincola populations in south-west Germany are located at the edge of the species’ climatic niche in Central Europe, making them particularly susceptible to the impacts of rapidly accelerating climate change. We also detected a strong impact of NH3 on the population index. Regions where the species is now extinct typically showed higher NH₃ concentrations, suggesting deteriorated habitat quality and reduced population size and density. Furthermore, the mostly acidophytic community associated with C. sepincola depends on algal partners from Trebouxia superclade S (OTUs S27, S28). However, our results show that NH3 promotes the spread of nitrophytic lichens, which introduce incompatible photobionts from other superclades, potentially limiting the ability of C. sepincola to establish new thalli. Even at ammonia-rich sites, we observed no detectable competition with visible free-living algae. This is unlike in NW Germany or Denmark, where NH3 has led to noticeable growth of filamentous algae, for example Klebsormidium cf. crenulatum or Apatococcus ammoniophilus (Frahm Reference Frahm1999; Stapper & Franzen-Reuter Reference Stapper and Franzen-Reuter2004; Søchting et al. Reference Søchting, Friedl, Moestrup, Grewe, Sun, Çakır, Ganzera, Glaser, Heesch and Hammerle2025). Such effects in our study area were limited to more shaded microhabitats (e.g. at the margin of dense spruce thickets), rather than the sun- and wind-exposed canopy birch-twigs occupied by C. sepincola.
Climatic changes pose a threat to species by shrinking available habitats and isolating the populations that remain (Habibzadeh et al. Reference Habibzadeh, Ghoddousi, Bleyhl and Kuemmerle2021). Populations at the retracting edge of a species’ climatic range often occupy marginal habitats that are particularly vulnerable (Hampe & Petit Reference Hampe and Petit2005). Based on the findings of this study, the low-latitude populations of C. sepincola fit into this category (Fig. 3). The predictors suggest that the target group is more influenced by specific moisture and temperature conditions, particularly during dry or cold periods. One such predictor, high isothermality, which refers to small temperature variations between seasons, indicates stable temperature conditions throughout the year. Elevated water loss through evaporation and plant transpiration, reflected by high PET, typically occurs in areas with intense sunlight, low humidity and high temperatures. These predictors imply that the lichen populations of Baden-Württemberg occur in habitats with more stable temperature regimes across seasons and a higher demand for moisture. High PET can also put stress on these lichen populations, since they must cope with the increased water demand in such environments. Cetraria sepincola generally prefers more moist conditions (Wirth Reference Wirth1995; Wirth et al. Reference Wirth, Hauck and Schultz2014), which may primarily result from increased fog and dew formation rather than direct precipitation. It is typically found in environments that are cool and humid (but not necessarily high in rainfall), such as boreal forests, subalpine areas, and wetland habitats (Wirth & Türk Reference Wirth and Türk1973).
The local populations in the study region showed a slightly positive effect of the Emberger pluviothermal quotient (embergerQ), which indicates water availability, on the C. sepincola populations. The specific microclimatic conditions of these relict populations in the study region could explain the positive effect of annual PET on the population index. These sites, such as sheltered valleys or depressions, serve as safe havens that facilitate the formation of cold-air pools, creating essential microclimates with low temperatures and high humidity, which are often functioning independently of broader regional climate patterns (Pastore et al. Reference Pastore, Classen, D’Amato, Foster and Adair2022). Interestingly, the PCA of European and Baden-Württemberg (BW) populations reveals a preference for higher PET in the BW populations, a finding that aligns with our GLM analysis showing a positive effect of annual PET on the population index of C. sepincola in the study region. This suggests that BW populations may be more adapted to environments with higher potential evapotranspiration, reflecting local climatic adaptations.
While climatic factors such as temperature, humidity and precipitation strongly shape the distribution and vitality of lichen communities, they represent only one aspect of environmental pressures. In recent decades, rising atmospheric nitrogen deposition, particularly NH₃ and NOₓ, has emerged as an equally important driver of lichen health and community composition (Gadsdon et al. Reference Gadsdon, Dagley, Wolseley and Power2010). Unlike climatic influences, which primarily affect lichens through physiological stress and habitat suitability, nitrogen compounds directly modify nutrient balance, substrate chemistry, and competitive interactions among species (Fenn et al. Reference Fenn, Geiser, Bachman, Blubaugh and Bytnerowicz2007; Greaver et al. Reference Greaver, McDow, Phelan, Kaylor, Herrick and Jovan2023).
Consistent with these effects, we observed elevated Ntotal and higher δ15N values in Hypogymnia physodes, a lichen co-occurring with C. sepincola, as well as increased background NH3 concentrations at sites where C. sepincola populations are in poorer condition (Fig. 4). Passive sampling confirmed clear differences in NO₂ and NH₃ levels among sites (Supplementary Material Fig. S2, available online), with the lowest concentrations detected at the same remote site, suggesting lower land use intensity. As NH₃ concentrations increased, we observed a corresponding rise in δ¹⁵N values, indicating a link between rising nitrogen input and isotopic composition. This trend aligns with findings by Munzi et al. (Reference Munzi, Branquinho, Cruz, Máguas, Leith, Sheppard and Sutton2019), who also reported higher δ¹⁵N under increased NH3 concentrations. Such enrichment in atmospheric nitrogen is known to particularly affect acidophytic lichens and their communities, which are highly sensitive to airborne nitrogen compounds (van Herk et al. Reference van Herk, Mathijssen-Spiekman and de Zwart2003). Even at levels as low as 0.3 mg N l-1 in precipitation, several acidophytic species show a decreased likelihood of occurrence (van Herk et al. Reference van Herk, Mathijssen-Spiekman and de Zwart2003). Furthermore, NH3 can react in the atmosphere, given sufficient water availability, with sulphur compounds such as sulphuric acid (H₂SO₄) to form ammonium sulphate ((NH₄)₂SO₄). These stable particles can be transported within cloud water over long distances. The StickstoffBW project group reported that this wet deposition is particularly concentrated at orographic barriers, such as the higher elevations of the Swabian Jura, the Black Forest, and the Odenwald (Gauger et al. Reference Gauger, Hug, Hoelscher, Jakobs, Schaap, Coenen, Rihm, Kuenzle, Zirlewagen and Lorentz2023). These regions are among the most important remaining regional habitats for C. sepincola, and the increased wet nitrogen deposition in these areas has probably contributed to its decline in the study area (Supplementary Material Fig. S1, available online). Reducing NH3 in the atmosphere, by implementing various agricultural techniques such as the immediate incorporation of slurry, digestate, poultry manure and solid manure, as well as using trailing hose technology instead of broadcast spreading, could help mitigate its impact (Hermann et al. Reference Hermann, Wiegmann and Wirz2020).
Efforts to mitigate nitrogen inputs from agriculture are crucial, yet even low-level atmospheric nitrogen can have ecological effects. In particular, compounds such as NH₃ and NOₓ can modify bark acidity, linking nitrogen pollution directly to changes in bark pH (Greaver et al. Reference Greaver, McDow, Phelan, Kaylor, Herrick and Jovan2023). Deposition of (dry) NH₃ tends to increase the pH of the bark, making it more alkaline, which in turn can influence the species composition of lichen communities (van Herk Reference van Herk2001; Gadsdon et al. Reference Gadsdon, Dagley, Wolseley and Power2010; Pinho et al. Reference Pinho, Llop, Ribeiro, Cruz, Soares, Pereira and Branquinho2014; Zarabska-Bożejewicz Reference Zarabska-Bożejewicz2020), an effect we also observed at our study sites. Specialized lichens which are tolerant to elevated levels of nitrogen compounds often thrive under these conditions, while species that prefer more acidic bark may decline, leading to reduced lichen diversity over time (Wolseley et al. Reference Wolseley, James, Theobald and Sutton2006; Pinho et al. Reference Pinho, Dias, Cruz, Sim Tang, Sutton, Martins‐Loução, Máguas and Branquinho2011; Mayer et al. Reference Mayer, Pfefferkorn-Dellali, Türk, Dullinger, Mirtl and Dirnböck2013). NH3 levels in our study showed a significant impact on the population index. This is probably because NH3 concentrations can vary more widely across different habitats, seasons and land use types, thus providing a clearer relationship with population dynamics (Schiferl et al. Reference Schiferl, Heald, van Damme, Clarisse, Clerbaux, Coheur, Nowak, Neuman, Herndon and Roscioli2016). In contrast to the clear effect of NH3, we found no effect of total nitrogen deposition on the population index (Fig. 4). A possible explanation is the broad averaging used in its calculation. Nitrogen background deposition is estimated using atmospheric models that combine monitoring data, emission inventories, and land use characteristics, typically resulting in uniform deposition values across large spatial areas (LUBW 2020b). In our study, these values were similar across sites, which may have obscured any potential impact on the population index, especially in areas with minimal variation in land use. Our study sites were mostly characterized by limited or only extensive human intervention and relatively uniform habitat conditions. This could suggest that certain forms of habitat management, such as the removal of dense canopy, may benefit the species by maintaining the open habitats it requires for survival. Historical management practices, such as maintaining ancient wood-pastures, are likely to be beneficial for the species, a strategy also highlighted in recent studies in the Alps (Kiebacher et al. Reference Kiebacher, Scheidegger and Bergamini2017).
Open habitats and extensively managed sites are generally associated with lower nitrogen inputs, whereas more intensively used areas experience higher nutrient enrichment that can favour shifts in lichen community composition (Ruoss Reference Ruoss1999; Stofer et al. Reference Stofer, Bergamini, Aragón, Carvalho, Coppins, Davey, Dietrich, Farkas, Kärkkäinen and Keller2006; Hoffman et al. Reference Hoffman, Albeke, McMurray, Evans and Williams2019). We observed this pattern at sites where C. sepincola was absent and nitrophilous or neutrophytic species, such as Physcia adscendens and Xanthoria parietina, were present. These species have begun to appear in smaller numbers even at sites where C. sepincola is still present in larger numbers. Such associations had not been mentioned in early reports of C. sepincola from the region (e.g. Wirth & Türk Reference Wirth and Türk1973) and are therefore likely to represent more recent changes. This pattern is also reflected in the mean Ellenberg values of the species at the sites (Supplementary Material Fig. S7, available online). It suggests that rising nitrogen levels and potential warming are driving an ongoing shift in community assemblages at these locations. In Baden-Württemberg, the spread of highly competitive nitrophytic species, even in forested areas (Stapper & Aptroot Reference Stapper and Aptroot2023), could create an increasing threat through competition, both at the level of site occupancy of entire thalli and potentially by reducing chances to find compatible photobionts for germinating spores of C. sepincola. Although competition may play a role, environmental filtering (especially from nitrogen enrichment) appears to be the main driver of these community changes, but further studies are needed to clarify the role of competition (Ma et al. Reference Ma, Bader, Petersen and Porada2024).
To assess how such pressures might affect its persistence, we examined photobionts associated with C. sepincola. We confirmed that it is highly selective for Trebouxia strains from superclade S, including the recently described T. barrenoae (OTU S28) and the closely related OTU S27. Trebouxia barrenoae occurs in temperate forests with cold winters, warm summers, and humid, cool conditions on acidic bark (Pazos et al. Reference Pazos, Moya, Garrido-Benavent, Bordenave, Gazquez and Chiva2025). This aligns with our findings, since C. sepincola and its photobionts also strongly favour acidic bark in similar habitats. In the study area, C. sepincola shares its photobiont with H. physodes. The photobiont is also known from other acidophilic epiphytes (e.g. Pseudevernia furfuracea (L.) Zopf, Usnea sp., Bryoria sp.), reflecting a preference for acidophilic-community photobionts (Fig. 5). This selectivity may be linked to its foliose–subfruticose growth form, which probably promotes higher mycobiont specialization compared to crustose lichens (Blaha et al. Reference Blaha, Baloch and Grube2006; Guzow-Krzemińska Reference Guzow-Krzemińska2006; Muggia et al. Reference Muggia, Pérez-Ortega, Kopun, Zellnig and Grube2014; Berlinches de Gea et al. Reference Berlinches de Gea, Verdú, Villar‐dePablo and Pérez‐Ortega2024). Specialization can enhance photobiont compatibility and efficiency under stable conditions but can restrict algal switching when conditions change or compatible partners are scarce. Long-distance algal dispersal could partly offset this but is constrained by environmental factors and probably too slow to respond effectively. Differences in the identity of photobionts from C. sepincola in Iceland and those from our collections in SW Germany indicate geographical structuring and limited exchange. This suggests that algal switching within this subset of superclade S photobionts is possible, potentially facilitating the patchy distribution of C. sepincola across Europe (Domaschke et al. Reference Domaschke, Vivas, Sancho and Printzen2013). The concept of ‘symbiont turnover zones’ (regions where host species are most likely to replace symbionts) offers a useful framework for understanding these constraints (Rolshausen et al. Reference Rolshausen, Hallman, Grande, Otte, Knudsen and Schmitt2020). Across latitudinal and altitudinal gradients, symbiont replacement often occurs abruptly at predictable environmental thresholds, reflecting the combined influence of environmental filtering and host identity on photobiont communities (Muggia et al. Reference Muggia, Pérez-Ortega, Kopun, Zellnig and Grube2014; Singh et al. Reference Singh, Dal Grande, Divakar, Otte, Crespo and Schmitt2017; Rolshausen et al. Reference Rolshausen, Dal Grande, Sadowska‐Deś, Otte and Schmitt2018). Together, these patterns suggest that highly specialized hosts such as C. sepincola are ecologically and evolutionarily constrained, with life-history traits that may increase vulnerability under habitat disturbance or nutrient enrichment.
Conclusion
Climate change and land use pressures pose significant threats to endangered species such as Cetraria sepincola. Marginal populations of C. sepincola are highly sensitive to NH3 levels, as shown by the results of this study. The strong correlation between C. sepincola occurrence and low-ammonia environments, combined with its high photobiont specificity, explains the species’ vulnerability and highlights its potential role as a sentinel for habitat quality. The species inhabits habitat types such as wetlands and rock screes, which are of high conservation value for both biodiversity and ecosystem functions. Reducing NH3 levels, especially in surrounding areas and the habitat itself, would significantly enhance conservation efforts on a larger scale. Establishing NH3 buffer zones around high-conservation sites could also be an effective measure to reduce NH3 input into these habitats. Additionally, maintaining an open canopy structure while ensuring the persistence of sufficient quantities of old and young Betula pubescens trees in managed conservation sites, particularly in wooded meadow sites, would improve habitat quality on a smaller scale by ensuring sufficient light exposure.
Supplementary Material
The Supplementary Material for this article can be found at http://doi.org/10.1017/S0024282926101364.
Acknowledgements
Gratitude is extended to the Botany Department team at the Natural History Museum Stuttgart. Additionally, we would like to thank the Center for Biodiversity and Integrative Taxonomy (KomBioTa) and the State Museum of Natural History Stuttgart for funding this project. We also wish to express our thanks to the University of Hohenheim for providing access to their laboratory and equipment, as well as to Wolfgang Armbruster for his valuable assistance with the analysis of the lichen samples. Special thanks go to Philipp Schlüter for his help in coordinating the isotope analyses. We are grateful to Rainer Cezanne for his advice regarding potential study sites. We also thank Martin Heklau for his valuable assistance with the thin-layer chromatography used to identify the collected lichen samples. Finally, we would like to express our gratitude to the Regional Government Authorities of Karlsruhe, Stuttgart, Tübingen and Freiburg for granting permission to conduct research on sites under nature protection.
Author Contribution
MB and HT conceived the research idea; MB conducted the sampling and data collection; MB and VF led the data analysis, with contributions from HT; MB and HT performed the DNA analysis and phylogenetic reconstruction; MB led the writing of the manuscript. All authors contributed to the revision of early drafts and approved the final version of the manuscript.
Author ORCID
Michael Boxriker, 0009-0009-8983-3220.
Competing Interests
The authors declare none.
Data Accessibility
The data that support the findings of this study are openly available in ‘FigShare’ at https://figshare.com/s/5cc92f4ac8d59b412705.


 Open access