

Introduction
Over the last years focus in breeding dairy cattle has moved from mainly production to a situation where cost-reducing traits such as udder health, reproduction and calving ease receive increasing emphasis. This has been done both to increase the income of the farmer and also to improve animal welfare and sustainability in production (Olesen et al., Reference Olesen, Groen and Gjerde2000).
Common for most of the cost-reducing traits is a low heritability and unfavourable genetic correlation to production traits and to some conformation traits. The low heritabilities lead to lower accuracies for the predicted breeding value (EBV) for these traits. One possible way to increase the accuracy of EBVs is to perform multitrait evaluations using direct and indirect information to take advantage of the genetic relationship between the traits (Van der Werf et al., Reference Van der Werf, Van Arendonk and De Vries1992; Ducrocq, Reference Ducrocq1994). Complete multitrait evaluation in national breeding programmes with dairy cattle and properly also with other species are in most cases not computationally feasible due to the amount of data and number of traits. Therefore, approximations have been proposed (Ducrocq et al., Reference Ducrocq, Boichard, Barbat and Larroque2001)
Multitrait evaluations using direct and indirect information have been shown to increase accuracy on longevity by more than 15% for newly proven sires (Ducrocq et al., Reference Ducrocq, Boichard, Barbat and Larroque2001). Another benefit of multitrait evaluation is that it accounts for the fact that the main selection has been on production, and thereby selection bias is taken into account.
In a stochastic simulation study of a nucleus breeding scheme Sørensen et al. (Reference Sørensen, Berg, Jensen and Christensen1999) showed that a multitrait breeding goal gave a higher genetic gain than only selecting for milk production. However the selection for the multitrait breeding goal was based on breeding values from primarily single-trait models. Genetic gain for production was smaller, selecting for total merit, but due to a considerable increase in genetic gain for cost-reducing traits total economic gain increased. This has also been shown in deterministic simulation studies (Christensen, Reference Christensen1998; Willam et al., Reference Willam, Egger Danner, Sölkner and Gierzinger2002).
Ducrocq et al. (Reference Ducrocq, Boichard, Barbat and Larroque2001) compared the selection differential for the traits in the breeding goal for the 10% best bulls when using an approximate multitrait model for breeding value estimation instead of ranking according to single-trait EBVs. This showed that changing the model modified the genetic profile of the best animals, since genetic merit increased for functional longevity, somatic cell score (SCS) and female fertility and decreased for milk yield, overall type and overall udder. However, at the same time as this approximate multitrait model, a new breeding goal was introduced, so it is hard to distinguish whether it was the effect of the model or the effect of the breeding goal which changed the new selection differentials. Comparing the use of single-trait models with an approximate multitrait model similar to the one used by Ducrocq et al. (Reference Ducrocq, Boichard, Barbat and Larroque2001) in laying hens, Besbes et al. (Reference Besbes, Ducrocq and Protais2002) found an improvement for all traits in the breeding goal.
The aim of this study is to quantify the effect of at the same time changing the methods used for prediction of breeding values and the breeding goal into a more sustainable breeding programme including functional traits. This is compared with the methods and breeding goal used today. The hypothesis is that the benefit from using multitrait evaluation is bigger when selection is on a broader breeding goal. This is tested in a stochastic simulation study of a dairy cattle population.
Material and methods
Population structure
A population of approximately 100 000 cows was simulated for a 30-year period. For all animals true breeding values for seven traits were simulated, and for cows phenotypes for these traits were simulated (Table 1). Genetic parameters presented in this table come from an intensive literature study. All traits were simulated as normally distributed traits with a phenotypic variance of 1 and for all traits there was exactly one observation per cow except for dairy form and udder depth where only 40 females from each progeny group were measured. These 40 cows were randomly chosen. None of the traits was measured on the bulls. Mastitis occurrence and non-return rate were converged to binary traits with thresholds of − 1 and 0 respectively, indicating a frequency of 0.18 and 0.5 in the starting population. All traits were realised and included in the breeding value estimation when cows were 35 months old. The average herd size was 100 cows. Progeny group size was 100 and the usage of semen from young sires was 35%. Selection of proven bulls was based on EBVs and from each proven bull 20 000 doses of semen could be used per year. Cows older than 6 years and bulls older than 8 years were culled and furthermore 5% of all animals were culled every year at random for other reasons. Cow replacement was done according to the EBVs, so cows with the highest EBV for total merit were kept to produce the next generation of offspring following a truncation selection strategy. This was done yearly after each round of breeding value estimation, and in each round of selection the same selection intensity was used due to restrictions on number of doses of semen per bull and population size of females. Sire-daughter and half- and full-sib matings were not allowed. Two different breeding goals were constructed (BG1 and BG2) using the economic values in Danish Kroner per genetic standard deviation corresponding to the values used in the Holstein population in Denmark in 2005 (Danish Agricultural Advisory Centre, 2006). BG1 were constructed to be narrow and therefore only had economic value on production and mastitis occurrence, whereas BG2 was constructed to mimic a broader breeding goal having economic values on production, udder depth, mastitis occurrence, non-return rate and days open (Table 1).
Name and type of traits, economic values in Danish Kroner per phenotypic standard unit in the two breeding goals (BG1 and BG2), heritability (diagonal), genetic (below diagonal) and residual correlations (above diagonal) used in the simulation to generate records

The seven traits were chosen to represent the traits that have been in focus over the last years and likely to be in focus in the near future in dairy cattle breeding. The most important trait is production. Two conformation traits were chosen – dairy form and udder depth. These two traits have relatively high genetic correlations to the other traits and have received some attention in the breeding goal so far. Mastitis occurrence and SCS were chosen to represent health traits and days open and non-return rate at day 56 were chosen to represent reproduction traits. Longevity could also be included when using this approximate method (Besbes et al., Reference Besbes, Ducrocq and Protais2002; Tarrés et al., Reference Tarrés, Piedrafita and Ducrocq2006) but was not considered here.
Simulation
The simulation was conducted using a modified version of the DAIRYSIM program. (Sørensen et al., Reference Sørensen, Berg, Jensen and Christensen1999). This program simulates all animals in the population.
The simulation was in two steps. The first step was to simulate a population comparable with a real population in which selection has been going on for several years. This first step covered 15 years, and selection was on BG1. EBVs were obtained using single trait animal model (AM) Best linear unbiased prediction (BLUP) for production and by a trivariate AM-BLUP for mastitis treatment with information from mastitis, SCS and udder depth. After this initial step, six different scenarios were simulated in order to quantify the effects of changing breeding goal and/or changing method for prediction of breeding values. The selection in each scenario was on BLUP EBVs obtained from animal models. In scenarios N1, N2 and N3 (N for ‘Narrow’), BG1 was used as selection criterion, while in scenarios B1, B2 and B3 (B for ‘Broad’), BG2 was used as selection criterion (Table 1). In scenarios N1 and B1, a multivariate model was used for the evaluation of mastitis, udder depth and SCS, and a univariate model was used for the other four traits. In scenario N2 and B2, an approximate multitrait model was used and in scenario N3 and B3 a complete multivariate model was applied. All six scenarios were started with estimates of (co)-variance components coming from analysis using the same model as later used for prediction of breeding values. These parameters were later used in the breeding value estimation whereas the ones used to simulate the data stayed the same. For each scenario 20 replicates were simulated.
Since genetic superiority depends on the reliability of the index of the individual traits, genetic progress is a way to describe the effect of changing the method for breeding value estimation (Falconer and Mackay, Reference Falconer and Mackay1996). Therefore, genetic progress in total merit was used as the main criterion for comparison of the six scenarios.
Model for prediction of breeding values
The following linear lactation model was used:

where y i is the observations for trait i, hys i is the herd-year-season effects on trait i, a i is the genetic effects for trait i and e i is the residuals for trait i. Traditional effects such as parity and age at calving are assumed not to be statistically significant in the simulation. The models for prediction of EBVs in scenario N1 and B1 (model 1) were single trait AM for all traits, except for mastitis occurrence where a trivariate AM model for mastitis treatments, udder depth and SCS. This corresponds to the way the breeding values are calculated today in Denmark (Danish Agricultural Advisory Centre, 2006). In the approximate multitrait (MT) model scenarios (N2 and B2), a two-step analysis was performed. Data were first analysed based on models corresponding to the models used in scenario N1 and B1. Then, fixed effects estimates for (hys) were used to pre-adjust the data and on these pre-adjusted records, a full multitrait model (model 2) only containing an overall mean, a year effect, a genetic and a residual term was applied (Ducrocq et al., Reference Ducrocq, Delaunay, Boichard and Mattalia2003):


where m is individual animals. The year effect was included in order to account for potential selection biases in the models used to generate the preadjusted data (Ducrocq et al., Reference Ducrocq, Delaunay, Boichard and Mattalia2003; Lassen et al., Reference Lassen, Sørensen, Madsen and Ducrocq2007). The multivariate model was a complete multitrait model based on model 1.
(Co)-variance components for the prediction models were obtained by averaging estimates from three subsets of data, each including records from around 10 000 cows originating from 20 randomly chosen herds from the simulated data. Estimates were obtained using the AI-REML algorithm implemented in the DMU package (Madsen and Jensen, Reference Madsen and Jensen2000).
The different scenarios were compared by differences in the achieved genetic trends computed as regressions of true genetic values on year over the last 13 years and for the different traits for the different scenarios as averages over replicates. From that point on, all females with realised phenotypes in the population were offspring from animals selected with respect to the changes in breeding goal or model for evaluation. For total merit, the regressions of both true and predicted genetic values on year were calculated using the economic values from BG2.
Results
Genetic gain
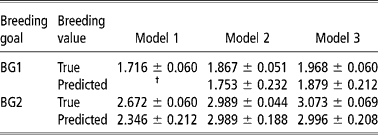
Scenario B3 led to the highest progress in true genetic total merit (Table 2). Scenario B3 was not significantly better than scenario B2 – at least with the number of replicates used to compute observed standard deviations, but these two scenarios were both significantly better than scenario B1. Similar patterns were observed for scenarios N3, N2 and N1, respectively. Using a multitrait or an approximate multitrait setting for prediction of breeding values led to a higher genetic total merit, especially when selection was done on BG2. The relative increase in true genetic trend from scenario B1 to B3 was 15.0% and from scenario B1 to B2, the increase was 11.8%. The increase between scenario N1 and N3 was 14.6% and between N1 and N2 it was 8.8%. In general the predicted breeding values for total merit were lower than the true breeding values.
Mean regression coefficients of 20 replicates in relative economic units of true and predicted genetic trends on year for total merit in simulation using the economic values from breeding goal 2 with standard errors
† Estimated breeding values were not calculated for non-return rate, days open and dairy form.
Scenario BG1 gave a higher genetic merit for production than scenario BG2. For all the other traits, BG2 gave a more favourable genetic merit than BG1 (Tables 3 and 4). For non-return rate and days open, there was very little progress if any from changing to a multitrait setting. In scenarios N1, N2 and N3 where there was no selection for non-return rate and days open, reproduction traits declined substantially.
Mean (with s.e.) of true average genetic trends from scenarios using breeding goal 1 for the seven traits on year in simulation over 20 replicates (the desired direction of selection is indicated)

Mean (with s.e.) of true average genetic trends from scenarios using breeding goal 2 of for the seven traits on year in simulation over 20 replicates (the desired direction of selection is indicated)

In general, using a method for prediction of breeding values where more of the available information is taken into account led to a more desirable genetic progress for the individual traits whatever the breeding goal. These differences were not significant, but in total they led to a higher total genetic merit.
In Table 5, the total merit is calculated using the economic values from breeding goals 1 and 2, respectively. Also the contribution of the different traits to the total merit is shown. Calculating the total merit using the weights from breeding goal 1 gives the highest merit as well as the lowest variation between scenarios. The results using weights from breeding goal 1 and breeding goal 2 cannot be compared since they are calculated using different economic expressions. In all scenarios, there is an improvement of production and mastitis and an unfavourable trend in the group of other traits containing the reproduction traits. This pattern is less pronounced when a multitrait model is used to predict breeding values. Using a more advanced model for prediction of EBVs for production did not increase genetic merit for the trait. Despite selecting for udder depth, non-return rate and days open, there was a combined decline for these traits in all scenarios.
Contribution to total merit index in relative economic units from production (A), mastitis (B) and other traits (C) using economic values from BG1 (A+B) and BG2 (A+B+C)

† Udder depth, non-return rate and days open.
Inbreeding
The yearly increase in inbreeding in scenario N1 was high (0.5%). In Table 6, the average increase in inbreeding for cows at year 30 in each scenario is compared with the increase in scenario N1 which is set to 100. There is a higher but non-significant increase in inbreeding when comparing BG1 with BG2 whatever the model. In this study there was no significant effect of using a more advanced model on increase in inbreeding.
Average inbreeding coefficient (delta F) and standard error over 20 replicates for cows at year 30 for the six scenarios relative to the increase in approach N1 which is set to 100

Generation interval
The change in accuracy of selection influenced the generation interval for both sexes but mainly for bulls (Table 7). When using the available information in the breeding value estimation, animals earlier showed their potential as candidates for selection and therefore were used to produce the next generation of offspring. Therefore generation interval decreased in scenarios where the available information in the data was fully used. This decrease in generation interval also contributed to the increase in genetic progress shown in the scenarios.
Mean generation interval over 20 replicates for cows and bulls in the six different scenarios with standard errors

Discussion
With the increasing number of traits with low heritability included in the breeding goals in dairy cattle breeding around the world (Miglior et al., Reference Miglior, Muir and Van Doormaal2005) the full potential of the traits is not exploited when correlations to other traits are ignored. A multitrait selection would be improved in terms of genetic gain if it followed a multitrait evaluation but this is often computationally impossible for large data sets and many correlated traits described by very different (non) linear models. Here the approximate MT model appeared to work well and led to genetic gains similar to the more computationally demanding full linear multitrait model. The approximate multitrait model was found to be significantly better than a model corresponding to the one used today when a broad breeding goal was applied. This effect is a combination of an increase in accuracy of the breeding values in the selection criterion which directly leads to a higher genetic gain. As the simulation program is constructed this effect also leads to a lower generation interval as animals at an earlier age become interesting to produce the next generation of offspring. The lower generation interval also contributes to a higher genetic progress for total merit. The predicted breeding values for total merit were somewhat lower than the true breeding values, although in no scenarios were they significantly lower. There seems to be no reason for the predicted breeding values to be lower than the true breeding values.
Production was more affected by a radical change of breeding goal than by a change in method for prediction of breeding values. In fact there was a small decline in genetic trend for production when a more advanced model was applied together with a broad breeding goal. So the additional information obtained by multitrait evaluation for production from other traits did not compensate for the genetic decline for the trait related to the relatively lower weight put on production. For all traits with low heritability, genetic trends improved in the desired direction. However, for reproduction, it was not possible to obtain a positive genetic trend. This was certainly due to too low an economic value for the reproduction traits in the breeding goal chosen here. In general, few theoretical or real breeding schemes have exhibited an improvement for fertility (Christensen, Reference Christensen1998; Sørensen et al., Reference Sørensen, Berg, Jensen and Christensen1999). Ducrocq et al. (Reference Ducrocq, Boichard, Barbat and Larroque2001) showed that the decline in fertility could be stopped and the selection differential of the 10% best bulls for total merit would have a mean genetic merit of 0.00 genetic standard deviation for fertility when using an approximate multitrait model compared with a mean of − 0.49 when a single-trait model was used. When changing model for prediction of breeding values to an approximate multitrait model as described in this study, Ducrocq et al. (Reference Ducrocq, Boichard, Barbat and Larroque2001) also found a decline for production. But this was also a result of changing breeding goal at the same time. Besbes et al. (Reference Besbes, Ducrocq and Protais2002) used similar methods and combined linear traits, a survival trait and a categorical trait into a total merit index and found more favourable selection differentials for all traits in the breeding goal in laying hens.
Direct comparison of the effect of the six different selection criteria in the two first columns in Table 5 is not valid since they are results of differently expressed breeding goals and economic values. However, comparison of N1, N2 and N3 with B1, B2 and B3, respectively within BG1 and BG2 seems to be valid. These results suggest that selecting for a narrow breeding goal when the true economic criterion was in fact broad was worse than selecting for a broad breeding goal when the true economic criterion was in fact narrow. This effect was more pronounced when the prediction of breeding values was done with a more advanced model. What was gained from production when using a narrow breeding goal as in scenario N1, N2, and N3 did not match the lower gain in mastitis and therefore less progress in total merit was obtained. This effect was even more pronounced when the selection criterion was broad.
Method for prediction of breeding values had no significant effect on inbreeding in this study, whereas a broad breeding goal with many traits with a low heritability gave an increase in inbreeding of approximately 10%. The reason for that was that BG2 included more traits with low heritability than BG1 which means that selection to a higher extent relies more on pedigree information and on related animals than when selecting mainly for production. This corresponds to the effect found by Sørensen et al. (Reference Sørensen, Berg, Jensen and Christensen1999). The choice of model had little or no effect on inbreeding, which might be surprising. One would expect a higher rate of inbreeding with a more advanced model due to a more extensive use of the pedigree but this effect was not significant in this study. With a higher number of replicates this might also be the case for the set up in this study. The level of inbreeding was relatively high. This was mainly due to the mating strategy, which only did not allow for matings between full- and half-sibs. All other matings were allowed. In this study any inbreeding depression was not simulated. Neither was inbreeding taken account for when predicting breeding values. Such an inclusion might have given a clearer image of the effect of increased inbreeding when applying a multitrait model and a multitrait selection criterion.
This study has a dairy-cattle specific approach. In general, more and more emphasis has been put on low heritability traits when defining breeding goals for dairy cattle over recent years world-wide (Miglior et al., Reference Miglior, Muir and Van Doormaal2005). Also with the progeny testing system that most dairy cattle populations practise the generation interval is relatively long, which makes decisions on bulls to use as proven sires crucial for long-term genetic progress. Multitrait breeding evaluation where the available information is fuller used is appealing to improve accuracy of selection and thereby be able to make better decisions in the breeding scheme. This is not just relevant for dairy cattle breeding schemes but in any species where low heritability traits play a major role in the breeding objective. Consumers have more and more focus on animal health and welfare. Traits related to this often show low heritability independent of species. Multitrait breeding value estimation could be one way to improve animal wellbeing through improved selection.
The approximate multitrait model as described in this study using pre-adjusted data in a two-step procedure has been further developed to include more complex traits, described by non-linear models (Besbes et al., Reference Besbes, Ducrocq and Protais2002; Tarrés et al., Reference Tarrés, Piedrafita and Ducrocq2006). In this study, the main focus was on the effect of using different models for prediction of breeding values and at the same time using different breeding goals more than on model development. Therefore all models were linear. Linear models are also still widely used for breeding value estimation of binary traits which justifies the use of such models in this study.
Conclusion
Using an approximate multitrait model as described for prediction of breeding values will lead to higher genetic progress for total merit than using a univariate approach. This effect is more pronounced when using a broad breeding goal than when using a narrow breeding goal. Given a selection criterion where several traits with low heritability are a major part of the breeding goal and most traits have mutually high or moderate genetic correlations a broad breeding goal will lead to a higher genetic progress in total merit. Another result can be a redistribution of the genetic merit to get a relatively lower progress in high heritability traits such as production and a relatively higher progress for low heritability traits such as cost-reducing traits. This study shows that multitrait selection should follow multitrait evaluation.



