Inflammation is a mechanism that protects the living organism against tissue damage caused by bacteria, trauma, chemicals or other degradation products. It is usually characterised by dilatation and increase of vascular permeability along with increase of blood flow, release of fluids into the intertexture space, increase of fibrinogen, as well as coagulation and migration of granulocytes and monocytes to damaged tissues. In response to inflammation, various cells and agents from vessels and immune cells are involved in a series of cascading events( Reference Mena, Domínguez‐Perles and Gironés‐Vilaplana 1 , Reference Lind, Hochwald and Malaty 2 ). C-reactive protein (CRP) is mainly synthesised by the liver cells in response to inflammation, which itself exacerbates the inflammatory cascade( Reference Abeywardena, Leifert and Warnes 3 ). In addition, CRP is a systemic sensitive index to evaluate inflammation and a valid predictive biomarker in disorders with which inflammatory processes are involved( Reference Koenig, Sund and Fröhlich 4 , Reference Ridker, Hennekens and Buring 5 ). Positive effects of anthocyanins on disorders that involve inflammatory processes, such as CVD( Reference Wallace, Slavin and Frankenfeld 6 , Reference de Pascual-Teresa, Moreno and García-Viguera 7 ), type 2 diabetes and insulin resistance( Reference Sancho and Pastore 8 – Reference Jennings, Welch and Spector 10 ), the metabolic syndrome( Reference Tsuda 11 ) and dyslipidaemia( Reference Liu, Sun and Lu 12 ), have been reported in the different surveys, including systematic review of clinical trials, review and epidemiologic studies. Anthocyanins are a group of water-soluble natural pigments in red, purple and blue that belong to the phenolic group. They exist in various plant sources such as fruits, vegetables, grains and cereals( Reference Bueno, Sáez-Plaza and Ramos-Escudero 13 ). Part of these protective effects have been attributed to the anti-inflammatory effect of anthocyanins. Findings of some animal( Reference Wang, Li and Zhu 14 – Reference Hogan, Canning and Sun 18 ) and epidemiologic( Reference Jennings, Welch and Spector 10 , Reference Chun, Chung and Claycombe 19 , Reference Cassidy, Rogers and Peterson 20 ) studies have shown positive effects of anthocyanins on the reduction of CRP concentration. However, results of randomised clinical trials (RCT) regarding the effect of anthocyanins on CRP levels are contradictory. For example, in the study conducted by Soltani et al. ( Reference Soltani, Hakimi and Asgary 21 ), reception of anthocyanin-rich extract from Vaccinium arctostaphylos had no significant effect on CRP levels in patients with hyperlipidaemia. Similarly, in different studies carried out on men with prehypertension( Reference Hassellund, Flaa and Kjeldsen 22 ) and the healthy participants( Reference Karlsen, Retterstøl and Laake 23 ), supplementation with purified anthocyanins had no significant effect on CRP levels. Moreover, the results of other surveys did not indicate any significant effect for intake of anthocyanin-rich extracts on CRP levels among healthy post-menopausal women (elderberry extract)( Reference Curtis, Kroon and Hollands 24 ) and healthy smokers (aronia berry extract)( Reference Xie, Vance and Kim 25 ). However, in a study on patients with hypercholesterolaemia, supplementation with purified anthocyanins was associated with a significant decrease in CRP plasma levels( Reference Zhu, Ling and Guo 26 ). Furthermore, Naruszewicz et al. ( Reference Naruszewicz, Łaniewska and Millo 27 ) reported a significant effect for consumption of chokeberry extract in post-menopausal women with a history of myocardial infarction. It has been frequently proposed that anthocyanins have potent anti-inflammatory capacity that can improve health and prevent from diseases. Several clinical trials have also been conducted on the effect of supplementation with purified anthocyanins or anthocyanin-rich extracts on CRP levels. However, no consistent evidence has ever been reported on the effectiveness of anthocyanins. To the best of our knowledge, no systematic review and meta-analysis has ever been conducted on this issue. Thus, in order to provide a more accurate estimate of the overall effect of anthocyanins on CRP levels, the present systematic review and meta-analysis were conducted. The aim was to evaluate the effect of supplementation with purified anthocyanins or anthocyanin-rich extracts on CRP levels. In addition, the secondary analyses including assessment of the dose and duration effects on supplementation, the population sub-groups (healthy v. patient participants) and the type of anthocyanins administered (purified anthocyanins v. anthocyanin-rich extracts) were conducted.
Methods
Search strategy
This systematic review and meta-analysis was conducted according to the Preferred Reporting Items for Systematic Reviews and Meta-Analyses Guidelines( Reference Moher, Shamseer and Clarke 28 ).
We searched online databases including PubMed, Scopus, Web of Science and Google scholar up to 14 September 2017 using Medical Subject Heading (MeSH) terms and non-MeSH terms to evaluate the effect of purified anthocyanin supplementation or anthocyanin-rich extracts on CRP levels. The following key words were used to search: (‘anthocyanins’ OR anthocyanin extract OR ‘cyanidin’ OR ‘pelargonidin’ OR ‘delphinidin’ OR ‘peonidin’ OR ‘petunidin’) AND (‘C-Reactive Protein’ OR CRP OR hs-CRP OR high sensitivity C-reactive protein OR ‘Inflammation’ OR inflammatory factors OR ‘inflammatory mediators’ OR inflammatory markers OR anti-inflammatory OR inflammatory biomarkers).
Finally, to ensure the comprehensiveness of these searches, we checked the references of the included studies for any possible additional sources.
Selection criteria
The selected studies had the following criteria: (1) RCT design, (2) the effect of purified anthocyanins or anthocyanin-rich extract on CRP levels (serum or plasma) v. placebo was evaluated, (3) the dose of administered anthocyanins was reported, (4) participants were ≥18 years, (5) the study duration was not <3 weeks, (6) sufficient information was presented for CRP levels and (7) the articles were in English.
Study selection
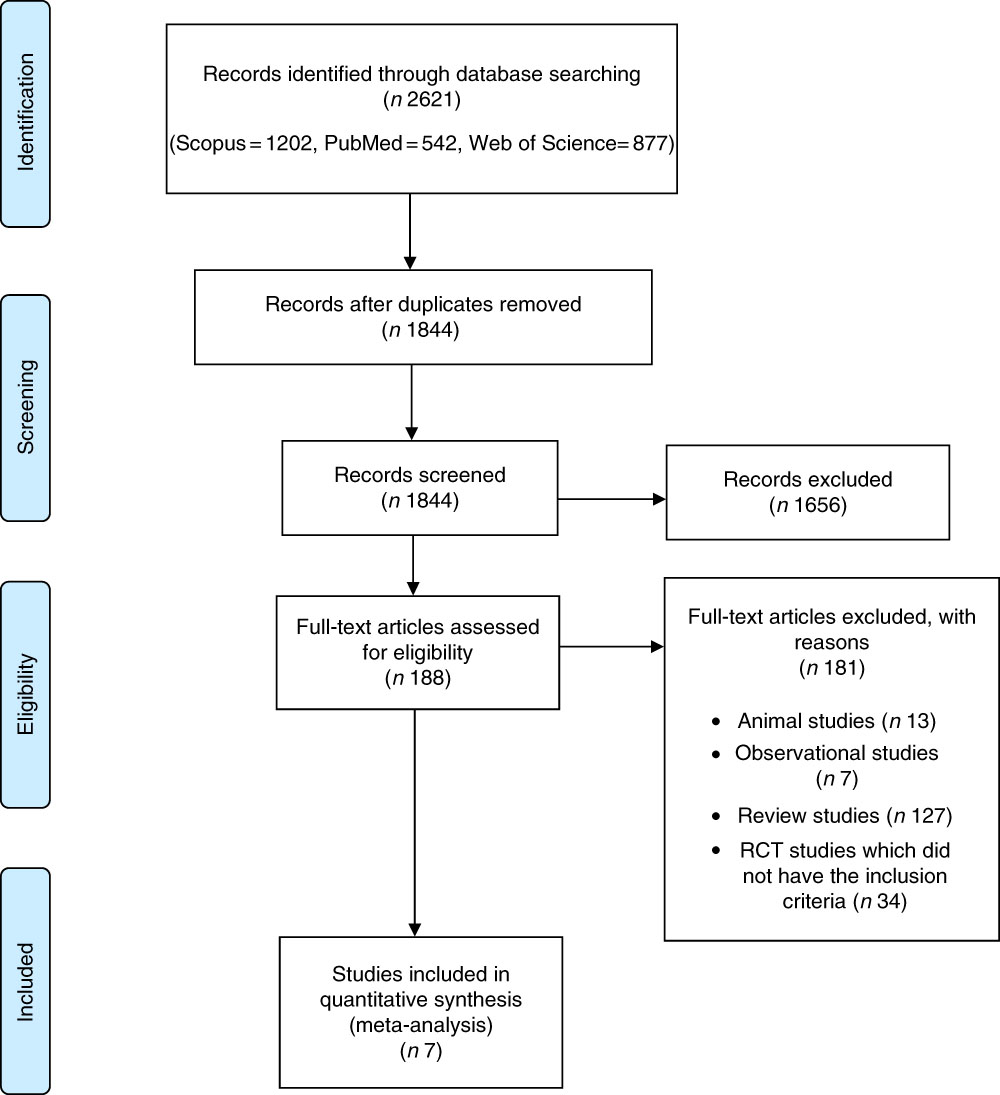
Two researchers (Z. S. S. and S. H.) separately performed the initial screening on the basis of titles and abstracts of articles. In the next step, the full texts of all related articles were investigated by reviewers to select studies on anthocyanins or anthocyanin-rich extracts with CRP levels. Eventually, any disagreements were discussed and resolved by consensus with the third researcher (M. H.) (Fig. 1).
Flow chart of study selection process. RCT, randomised controlled trial.
Data extraction
We obtained information from the selected studies on author’s family name, year of publication, sample size, loss to follow-up, dose and type of intervention, duration of study, cross-over or parallel study design, participants’ sex, age and health status, as well as mean and standard deviation of CRP concentration at the beginning and end of the study.
Quality assessment
Quality of the included studies was assessed based on the quantitative five-point Jadad scale to independently assess the methodological quality of a clinical trial( Reference Jadad, Moore and Carroll 29 ). Studies were given 0–1 point based on five sections: (1) randomisation, (2) description of randomisation procedure, (3) double blinding, (4) method of double blinding and (5) description of drop-outs and withdrawals. Then, if the study acquired ≥3 scores, it was considered to have high quality( Reference Jadad, Moore and Carroll 29 ), but in the present study, owing to limited number of studies, in addition to analysis on high quality studies, one analysis was performed on studies with a Jadad scale score ≥1.
Data synthesis and analysis
Statistical analyses were conducted using STATA software, version 11.2 (STATA Corp.). Standardised mean difference was defined as the effect size calculated through the mean divided by the standard deviation (sd) of a difference between two random values each from one of two groups( Reference Higgins and Green 30 , Reference Hou, Yanagita and Uto 31 ). In studies in which the standard error (se) value was reported, se was converted to sd through the following formula: sd=se×√n (n=number of participants in each group). In addition, to incorporate between-study variation, a random effects model was used to combine effect sizes, which took between-study heterogeneity into account. To evaluate heterogeneity among studies, I 2 and Q statistics were used. If I 2>50 % and P value of Q statistic <0·1, statistically significant heterogeneity was recognised( Reference Higgins and Thompson 32 ). Furthermore, sub-group analysis was performed to explore the possible source of heterogeneity among the studies. As participants’ health status and the type of administered anthocyanins (purified anthocyanins or anthocyanin-rich extracts) could have changed the CRP concentration score, we carried out the sub-group analysis based on these variables. Publication bias was assessed by examination of the funnel plot and formal testing for ‘funnel plot’ asymmetry using Begg’s test and Egger’s test. Sensitivity analysis was performed to identify whether a specific study or a particular group of studies affected the conclusions( Reference Hassimotto, Moreira and Nascimento 33 ). Meta-regression was conducted in order to evaluate the association of estimated effect size with dose of anthocyanins and duration of trial. In addition, we conducted the same analysis by excluding the studies of Karlsen et al. ( Reference Karlsen, Retterstøl and Laake 23 ), which had the lowest quality score, and Hassellund et al. ( Reference Hassellund, Flaa and Kjeldsen 22 ), which had a cross-over design to determine whether quality score or design of survey influences the overall result. P values of <0·05 were considered significant.
Results
Literature search
Our electronic search of PubMed, Web of Science, Scopus and Google scholar resulted in 2621 articles. Then, seven studies that met the inclusion criteria were included in our systematic review (Fig. 1).
Study characteristics
Characteristics of all studies that entered this meta-analysis are indicated in Table 1. All studies were published from 2007 to 2017. The total number of participants in these studies were 489 individuals who were divided into two groups: intervention (n 230) and placebo (n 229). A total of four studies were conducted in Europe( Reference Hassellund, Flaa and Kjeldsen 22 – Reference Curtis, Kroon and Hollands 24 , Reference Naruszewicz, Łaniewska and Millo 27 ) and three were carried out in Asia( Reference Soltani, Hakimi and Asgary 21 , Reference Zhu, Ling and Guo 26 ) and USA( Reference Xie, Vance and Kim 25 ). In all, four of the studies assayed high-sensitivity CRP instead of conventional CRP( Reference Soltani, Hakimi and Asgary 21 , Reference Hassellund, Flaa and Kjeldsen 22 , Reference Zhu, Ling and Guo 26 , Reference Naruszewicz, Łaniewska and Millo 27 ). All studies had a RCT parallel design, except one study that had a cross-over design( Reference Hassellund, Flaa and Kjeldsen 22 ). Duration of trials ranged from 3 to 12 weeks, and dose of anthocyanins was from 45·1 to 640 mg/d. In addition, anthocyanins were administered in the form of purified anthocyanins( Reference Hassellund, Flaa and Kjeldsen 22 , Reference Karlsen, Retterstøl and Laake 23 , Reference Zhu, Ling and Guo 26 ), elderberry( Reference Curtis, Kroon and Hollands 24 ), chokeberry( Reference Naruszewicz, Łaniewska and Millo 27 ), Arctostaphylos L.( Reference Soltani, Hakimi and Asgary 21 ) and aronia berry extracts( Reference Xie, Vance and Kim 25 ).
The characteristics of the included studies
CRP, C-reactive protein; hs-CRP, high sensitivity C-reactive protein; MI, myocardial infarction.
* CRP levels at baseline and the end of trial in all studies had reported as mean (sd) except study number 2 and 5 which reported as geometric mean (upper and lower quartiles) and median (range), respectively.
† Changes of CRP levels had reported in the studies number 2, 3 and 5 as mean change percentage (95 % CI), mean (sd) and median difference (95 % CI), respectively.
Assessment of quality of studies
According to the Jadad criteria, score quality of the included studies was from 1 to 5; all had high quality except one study( Reference Karlsen, Retterstøl and Laake 23 ). All the studies were randomised but only three of seven studies explained the randomisation method( Reference Soltani, Hakimi and Asgary 21 , Reference Hassellund, Flaa and Kjeldsen 22 , Reference Zhu, Ling and Guo 26 ). Moreover, all studies were double-blind and placebo-controlled, except one study( Reference Karlsen, Retterstøl and Laake 23 ) in which no explanation was provided in this regard. Furthermore, all the studies described drop-outs and withdrawals (online Supplementary Table S1).
Effect of anthocyanins on C-reactive protein level
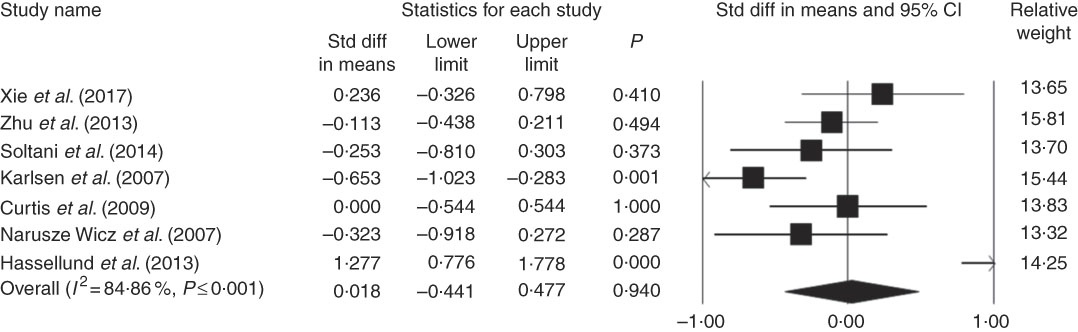
From the seven eligible studies investigated in this meta-analysis, only two indicated a significant relationship between CRP level and anthocyanins. Finally, our pool analysis demonstrated no significant relationship between the administered anthocyanins and concentration of CRP (weighted mean difference (WMD)=0·018; 95 % CI –0·44, 0·47; P=0·94) (Fig. 2). We performed similar analysis without including studies of Karlsen et al. ( Reference Karlsen, Retterstøl and Laake 23 ), which had the lowest quality score, and Hassellund et al. ( Reference Hassellund, Flaa and Kjeldsen 22 ), which had a cross-over design to evaluate whether quality score or design of study had an impact on the overall result. Then, our findings did not indicate meaningful results after excluding these studies (WMD=–0·09; 95 % CI –0·30, 0·12; P=0·39) (online Supplementary Fig. S2). In addition, removal of each study did not cause a significant change in the results (online Supplementary Fig. S1) and studies had high heterogeneity (Q≤0·001, I 2=84·86).
Forest plot illustrates standardised mean difference (represented by the black square) and 95 % CI (represented by horizontal line) for concentration of C-reactive protein and anthocyanins. Weights are from random effects analysis. The area of the black square is proportional to the specific study weight to the overall meta-analysis. The centre of the diamond displays the pool standardised mean differences and its width shows the pooled 95 % CI. Std diff, standard difference.
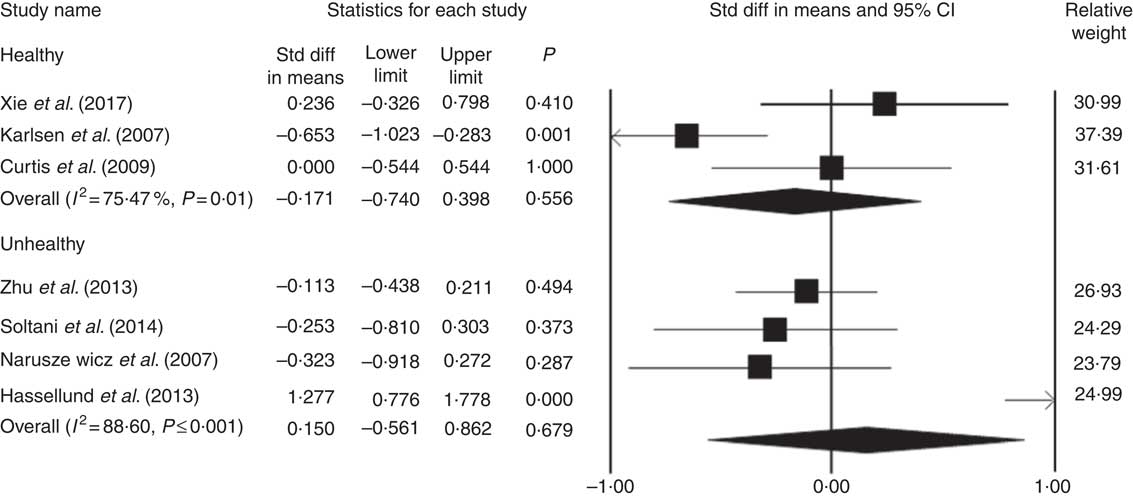
Sub-group analysis
The results of sub-group analysis showed that the administered anthocyanins did not have any meaningful effect on the concentration of CRP in both healthy participants and patients (WMD=–0·17, 95 % CI –0·74, 0·39, P=0·55; WMD=0·15, 95 % CI –0·56, 0·86, P=0·67, respectively) (Fig. 3). In addition, no significant difference was found between the type of anthocyanins and the concentration of CRP (WMD=0·15; 95 % CI –0·82, 1·13; P=0·75).
Forest plot illustrates weighted mean difference (represented by the black square) and 95 % CI (represented by horizontal line) for C-reactive protein concentration and anthocyanins in healthy and unhealthy participants. Weights are from random effects analysis. The area of the black square is proportional to the specific study weight to the overall meta-analysis. The centre of the diamond displays the pool weighted mean difference and its width shows the pooled 95 % CI. Std diff, standard difference. Std diff, standard difference.
Meta-regression
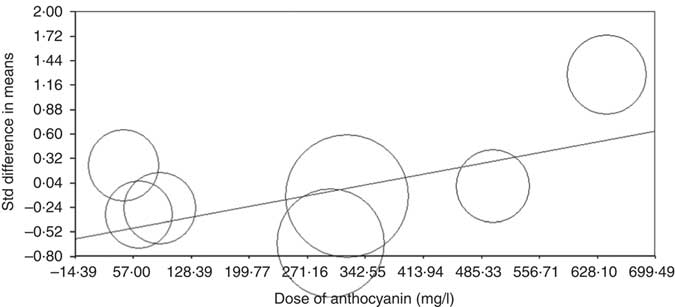
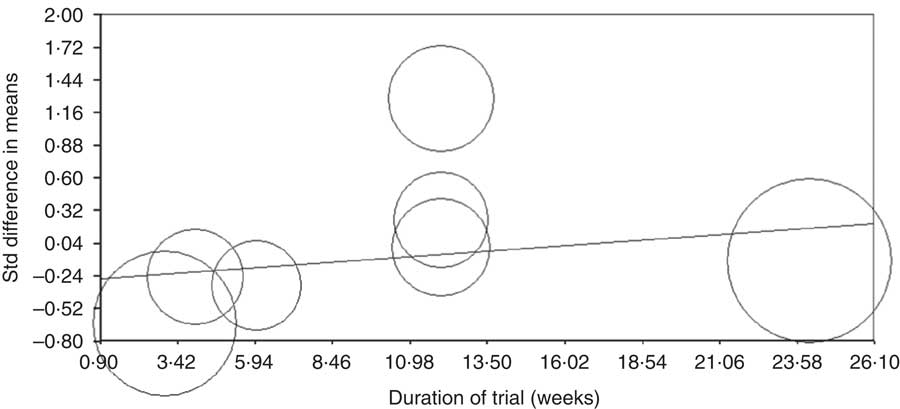
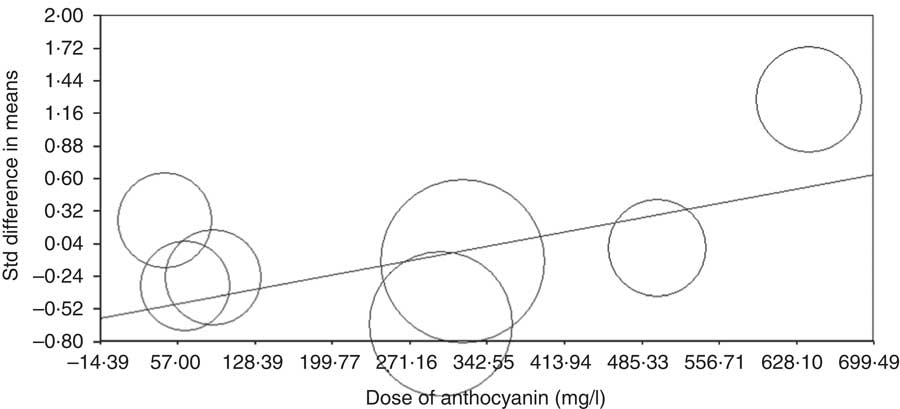
Meta-regression analysis was conducted to assess the association between changes in CRP levels with dose of anthocyanins and duration of trial. The results showed that there is no relationship between increasing the duration of the trial and CRP concentrations (based on all studies: slope: 0·01; 95 % CI –0·002, 0·03; P=0·08 (Fig. 4) (without Karlsen et al. ( Reference Karlsen, Retterstøl and Laake 23 ) and Hassellund et al. ( Reference Hassellund, Flaa and Kjeldsen 22 ) studies: slope: 0·003; 95 % CI –0·02, 0·03; P=0·76 (online Supplementary Fig. S3)). An increase in the dose of administered anthocyanins can significantly change the concentration of CRP (slope: 0·001; 95 % CI 0·0007, 0·002; P<0·001) (Fig. 5). However, this relationship was not detected by deleting studies of Karlsen et al. ( Reference Karlsen, Retterstøl and Laake 23 ) and Hassellund et al. ( Reference Hassellund, Flaa and Kjeldsen 22 ) (slope: 0·0001; 95 % CI –0·001, 0·001; P=0·88) (online Supplementary Fig. S4).
Meta-regression plots of the association between standardised mean difference in plasma C-reactive protein concentrations values after anthocyanin supplementation with duration of trail. The size of each circle is inversely proportional to the variance of change. Std diff, standard difference.
Meta-regression plots of the association between standardised mean difference in plasma C-reactive protein concentrations values after anthocyanin supplementation with dose of anthocyanins. The size of each circle is inversely proportional to the variance of change. Std diff, standard difference.
Publication bias
Publication bias was not observed on the basis of Funnel plots and asymmetry tests (Begg’s test P=0·88 and Egger’test P=0·48) for the effect of administered anthocyanins on CRP levels (online Supplementary Fig. S5).
Discussion
The findings of this study showed no significant lowering effect for anthocyanins on CRP concentrations. The effect of anthocyanins on CRP levels was independent of the duration of supplementation, whereas it depended on the dose of anthocyanins administered. However, no significant result was found between dose of the anthocyanins administered and CRP levels after excluding the studies of Karlsen et al. ( Reference Karlsen, Retterstøl and Laake 23 ) and Hassellund et al. ( Reference Hassellund, Flaa and Kjeldsen 22 ). The research conducted by Karlsen et al. ( Reference Karlsen, Retterstøl and Laake 23 ) had the lowest quality score, whereas the study of Hassellund et al. ( Reference Hassellund, Flaa and Kjeldsen 22 ) was the only survey that had a cross-over design. Therefore, the observed differences after excluding these surveys may be attributed to the low-quality score of the study conducted by Karlsen et al. ( Reference Karlsen, Retterstøl and Laake 23 ) and different research design of Hassellund et al. ( Reference Hassellund, Flaa and Kjeldsen 22 ) survey. In addition, the results of sub-group analysis showed that the supplementation of anthocyanins did not have any significant impact on the CRP concentration in both healthy and unhealthy participants and for the type of anthocyanins administered (purified anthocyanins or anthocyanin-rich extracts).
To the best of our knowledge, the present meta-analysis is the first study that evaluated the impact of supplementation with anthocyanins on CRP levels. However, recently a meta-analysis has been published that examined the effect of pomegranate juice, containing anthocyanins as one of its beneficial compositions, on CRP concentrations. Similar to our results, this meta-analysis reported no meaningful impact of supplementation with pomegranate juice on plasma CRP levels, and this impact was independent of supplementation duration( Reference Sahebkar, Gurban and Serban 34 ). However, in contrast to the mentioned meta-analysis, our findings demonstrated that the effect of anthocyanins depended on the administered dosage. However, no significant finding was observed between the anthocyanin dosage and CRP levels after excluding the studies of Karlsen et al. ( Reference Karlsen, Retterstøl and Laake 23 ) and Hassellund et al. ( Reference Hassellund, Flaa and Kjeldsen 22 ). Discrepancies between our findings and the mentioned meta-analysis( Reference Sahebkar, Gurban and Serban 34 ) may be related to different types of intervention. The effect of supplementation with purified anthocyanins or anthocyanin-rich extracts was evaluated in the current meta-analysis. In the study of Sahebkar et al. ( Reference Sahebkar, Gurban and Serban 34 ), the effect of pomegranate juice as a food source containing anthocyanins was examined. The other beneficial compounds such as flavonoids or other phytochemicals in the pomegranate juice may have influenced the results. In addition, between-subject variations in bioavailability of bioactive compounds in the plant foods and their biological responses could have resulted in different effects in humans.
The evidence indicated that anthocyanins exhibit anti-inflammatory activity by inhibiting NF-κB signalling pathways( Reference Li, Wang and Luo 35 , Reference Taverniti, Fracassetti and Del Bo’ 36 ). Moreover, anthocyanins down-regulate cyclooxygenase-2 expression and inhibit the production of PGE2( Reference Hassimotto, Moreira and Nascimento 33 , Reference Li, Wang and Luo 35 ). In addition, anthocyanins exhibit anti-inflammatory effects by suppressing the synthesis of nitric oxide and reducing the level of TNF-α, IL-1β and IL-6( Reference Tsuda 11 , Reference Li, Wang and Luo 35 ). Meanwhile, the findings of some animal( Reference Wang, Li and Zhu 14 – Reference Hogan, Canning and Sun 18 ) and epidemiological( Reference Jennings, Welch and Spector 10 , Reference Chun, Chung and Claycombe 19 , Reference Cassidy, Rogers and Peterson 20 , Reference Duffey and Sutherland 37 ) studies showed a meaningful effect of anthocyanins on the reduction of CRP levels. However, the mechanisms through which anthocyanins decrease CRP concentrations are not fully known. One possible mechanism may be inhibition of NF-κB activation( Reference Li, Wang and Luo 35 ) because CRP is one of the target genes of NF-κB( Reference Karlsen, Paur and Bøhn 38 ). Furthermore, anthocyanins act as a reactive oxygen species scavenger that suppresses oxidative stress and thereby diminishes the inflammatory response by anti-oxidative activity( Reference Karlsen, Retterstøl and Laake 23 ). However, the reported beneficial effects of anthocyanins on reduction of CRP levels were not confirmed in the present meta-analysis of human clinical trials.
No study has ever been attempted to specify the optimal dose of anthocyanins for anti-inflammatory effects. Therefore, it is unclear whether the doses used in included clinical trials were really sufficient to create significant anti-inflammatory effects. In addition, some studies reported that the anti-inflammatory impact of anthocyanins might depend on different factors, including sources, doses and categories of anthocyanins used in the researches( Reference Hou, Yanagita and Uto 31 , Reference Li, Wang and Luo 35 ). In addition, some studies suggested that a mixture of various anthocyanins may cause a more anti-inflammatory effect than a single anthocyanin, because different anthocyanins in the mixture can have additive or synergistic effects regarding the anti-inflammatory response ( Reference Zhu, Ling and Guo 26 , Reference Li, Wang and Luo 35 ). Therefore, different effects reported in the literature investigated in the present study were probably caused by different doses of the administered anthocyanins, sources used for extraction and production of anthocyanins-rich extracts or purified anthocyanin supplementations, composition and type of anthocyanins in the prescribed extracts or supplements and various supplementation durations. Furthermore, a recent review article suggested that between-subject variations in bioavailability of bioactive compounds in plant foods (such as anthocyanins) and their biological responses may have resulted in different effects on humans. Inter-individual variations in bioavailability can be associated with differences in absorption, metabolism, tissue distribution and turnover, excretion or a combination of these factors. Moreover, the gut microbiota has a substantial role in making the variability in the metabolism of plant foods bioactives. In addition, other parameters including sex, age and dietary habits may influence the bioavailability of plant food bioactives. Similarly, inter-individual variations in biological responses may be related to variety in bioavailability of plant foods’ bioactives and other factors such as sex, age, gut microbiome composition and (epi)-genetic profiles. Therefore, different effects observed in the current study are probably caused by various characteristics of varied populations( Reference Manach, Milenkovic and van de Wiele 39 ).
Meanwhile, various assay methods used to determine CRP (conventional CRP or high-sensitivity CRP) may have contributed to different effects in different studies. However, the sub-group analysis based on the type of analytical techniques to determine CRP did not demonstrate any significant finding for the effects of anthocyanins.
The present meta-analysis had several limitations. First, RCT included in the present study had small sample sizes and limited follow-ups. Second, the investigated studies were heterogeneous considering their populations’ characteristics, the administered anthocyanin dose, use of purified anthocyanins or anthocyanin-rich extracts, source of anthocyanins and composition of anthocyanins in the extracts. Third, no study has ever evaluated the effect of dose escalation on the optimum pharmacological dose of anthocyanins regarding the anti-inflammatory activity. Furthermore, the possible minor effects of other components of the extracts such as polyphenols, flavonoids or other phytochemicals should not be ignored. Fourth, we could not conduct sub-group analysis based on other potential factors such as sex, age, baseline CRP levels and the type of disease owing to limited availability of studies.
Meanwhile, it was not possible to classify the RCT study populations by the baseline CRP level because the CRP levels of the investigated studies were close to each other and CRP levels in most of these studies (i.e. six out of seven), except the study of Naruszewicz et al. ( Reference Naruszewicz, Łaniewska and Millo 27 ), were in the normal range. Fifth, we did not consider RCT used in anthocyanin-rich fruits and/or juices because they contain different other compounds such as polyphenols, flavonoids or other phytochemicals, and the effect of anthocyanins alone have not been studied in these surveys. Therefore, other compounds may have influenced the results.
Conclusion
The present meta-analysis of RCT did not demonstrate any significant effect of anthocyanins on CRP concentrations. This effect was independent of supplementation duration. However, it depended on the administered anthocyanin dosage. However, no significant result was observed between the dose of administered anthocyanin and CRP levels after excluding studies of Karlsen et al. and Hassellund et al. Further well-designed RCT with larger sample sizes and longer duration are needed to investigate the effectiveness of anthocyanins and dose response on CRP levels.
Acknowledgements
The authors thank the Nutrition Department in Shahid Sadoughi University of Medical Sciences in Iran.
The study was funded by the Nutrition and Food Security Research Center, Shahid Sadoughi University of Medical Sciences, Yazd, Iran.
Z. S. S. and M. H. designed the study. Z. S. S. and S. H. collected and extracted the data. S. H. and M. H. performed the statistical analysis. Z. S. S. and S. H. wrote the draft of the manuscript. M. H. critically revised the manuscript and approved the final version of manuscript to be submitted. All authors read and approved the final version of the article.
The authors declare that there is no conflict of interest regarding the publication of this paper.
Supplementary material
For supplementary material/s referred to in this article, please visit https://doi.org/10.1017/S0007114518002957