


Introduction
Between c. 4200 and 3600 BC, the so-called Trypillia mega-sites were established on the northern limits of the Pontic Steppe (Zbenovich Reference Zbenovich1996; Videiko Reference Videiko1998; Menotti & Korvin-Piotrovskiy Reference Menotti and Korvin-Piotrovskiy2012; Müller et al. Reference Müller, Rassmann and Videiko2016a; Gaydarska Reference Gaydarska2020). With sizes of up to 320ha and around 10 000 inhabitants, they are among the largest prehistoric communities in Europe. These settlements were built in a partially open forest-steppe landscape with very fertile loess-based soils (Kirleis & Dreibrodt Reference Kirleis, Dreibrodt, Müller, Rassmann and Videiko2016; Dreibrodt et al. Reference Dreibrodt2022). They were agricultural settlements inhabited all year round, with an economy based on the cultivation of cereals and pulses and on intensive and extensive animal husbandry centred on cattle (Kruts et al. Reference Kruts, Korvin-Piotrovskiy and Rizhov2001; Kirleis & Dal Corso Reference Kirleis, Dal Corso, Müller, Rassman and Videiko2016; Dal Corso et al. Reference Dal Corso2018; Orton et al. Reference Orton, Nottingham, Rainsford-Betts, Hosking, Millard and Gaydarska2020; Makarewicz et al. Reference Makarewicz, Hofmann, Videiko and Müller2022; Schlütz et al. Reference Schlütz2023).
While some researchers assume that these settlements had the character of ‘giant’ villages (Kruts Reference Kruts, Menotti and Korvin-Piotrovskiy2012), others emphasise the urban characteristics of large Trypillia settlements (Videiko Reference Videiko1998; Wengrow Reference Wengrow2015). Among the manifold approaches to urban agglomerations, the Trypillia mega-sites represent a form of agrarian agglomeration, which is seen as an alternative concept of urbanism (e.g. Gaydarska Reference Gaydarska and Gyucha2019; see also Ohlrau Reference Ohlrau2022), including egalitarian forms of socio-political organisation without central leadership (Müller Reference Müller, Videiko, Müller, Rassman and Videiko2016; Graeber & Wengrow Reference Graeber and Wengrow2022: 316–25).
In our view, the social fabric plays a crucial role in explaining the rise and fall of these mega-sites, as it regulates processes of political decision-making and the distribution of surpluses. Are there differences in wealth between households in the mega-sites and in the sequence of Trypillia settlements in general? Based on the results of extensive excavations and geophysical surveys, this article calculates Gini coefficients—a statistical measure of inequality in the distribution of household income—of house floor sizes, which have been shown to be a suitable proxy for evaluating household variability in diverse cultural contexts and in global comparative studies (e.g. Kohler et al. Reference Kohler2017; Thompson et al. Reference Thompson, Feinman and Prufer2021; Basri & Lawrence Reference Basri and Lawrence2020).
Data sources
The present study includes approximately 7000 houses from 38 Cucuteni-Trypillia settlements dating to between 4800 and 3000 BC (Table 1, see also the online supplementary material (OSM)). Most of the data have been extracted from geophysical surveys undertaken over the last decade as part of a long-term co-operation between Kiel University, the Eurasia Department and the Roman-Germanic Commission of the German Archaeological Institute and regional partners in Moldova, Romania and Ukraine (Rassmann et al. Reference Rassmann, Ohlrau, Hofmann, Mischka, Burdo, Videjko and Müller2014, Reference Rassmann, Mertl, Voss, Bicbaiev, Popa, Musteaţă, Müller, Rassman and Videiko2016; Ohlrau Reference Ohlrau2015; Hofmann et al. Reference Hofmann, Ţerna, Rud, Shatilo, Sîrbu, Mischka, Mischka and Preoteasa2016a & Reference Hofmann, Ţerna, Ursu, Brandtstätter, Tiede, Mainusch and Authenriethb, Reference Hofmann, Ţerna, Shatilo, Rud, Sirbu, Hofmann, Kirleis, Müller, Rud, Ţerna and Videikoin press a; Rud et al. Reference Rud, Ohlrau, Federov and Zaitseva2018, Reference Rud, Hofmann, Kosakivskyi, Zaitseva and Müller2019, Reference Rud, Hofmann, Kosakivskyi, Zaitseva, Müller, Hofmann, Kirleis, Müller, Rud, Ţerna and Videikoin press; Ohlrau & Rud Reference Ohlrau, Rud, Mischka, Mischka and Preoteasa2019; Ţerna et al. Reference Ţerna2019, Reference Ţerna, Hofmann, Shatilo, Rud, Hofmann, Kirleis, Müller, Rud, Ţerna and Videikoin press; Hofmann & Shatilo Reference Hofmann, Shatilo, Hofmann, Kirleis, Müller, Rud, Ţerna and Videikoin press). In addition, we have also made use of house sizes detected during geophysical surveys and excavation plans drawn up by other research groups (Dumitrescu Reference Dumitrescu1954; Petrescu-Dîmboviţa et al. Reference Petrescu-Dîmboviţa, Florescu and Florescu1999; Chapman et al. Reference Chapman2018; Asandulesei et al. Reference Asandulesei, Tencariu and Nicu2020).
Regional distribution of settlements.
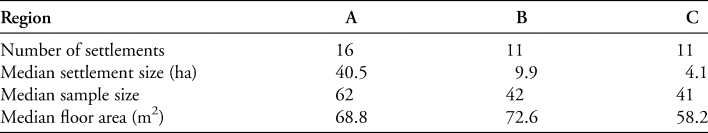
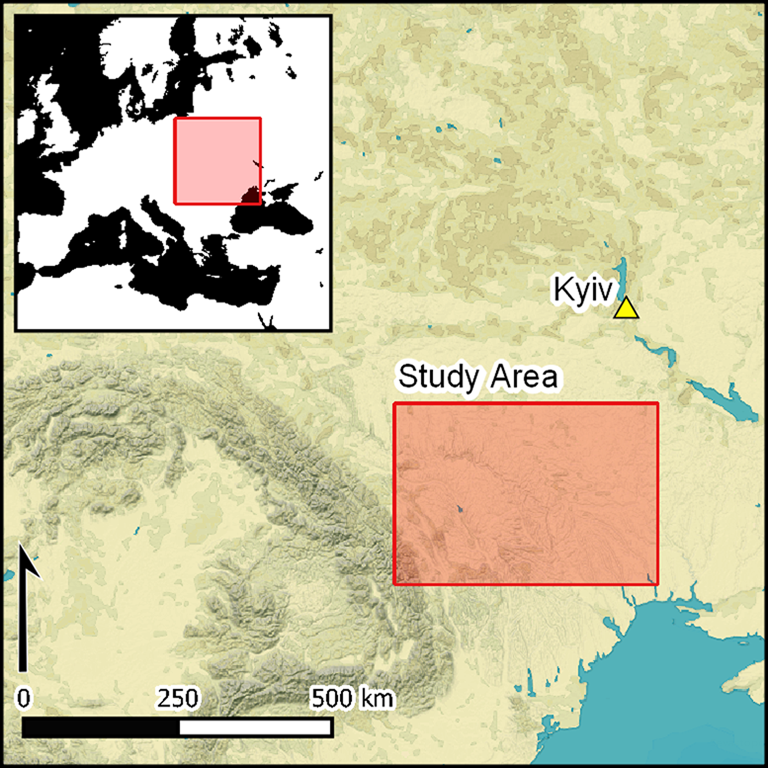
The division into three test regions in present-day Romania, Moldova and Ukraine—A, B and C— is designed to compare regions with different scales of population aggregation. It is based on large rivers within the study area extending between the Carpathians in the west and the Dnieper in the east (Hofmann et al. Reference Hofmann2018) (Table 1 & Figure 1). Region A encompasses settlements in the catchment area of the river Sinyukha, a tributary of the southern Bug, where a concentration of large, aggregated settlements extending up to 320ha has been identified (Shatilo Reference Shatilo2021). Region B refers to the Dniester-southern Bug interfluve, where settlements larger than 50ha are much rarer and do not exceed 100ha in size (Rud et al. Reference Rud, Hofmann, Kosakivskyi, Zaitseva and Müller2019). Region C comprises the region between the foothills of the Carpathians and the Dniester, where most sites are relatively small, with the largest not exceeding 30ha.
Distribution of surveyed sites by region with sample sizes and Gini coefficients (figure by authors).
The chronology of the sites is based on radiocarbon dating, systematically obtained in test trenches for each of the sites investigated (Diachenko & Harper Reference Diachenko and Harper2016; Müller et al. Reference Müller, Hofmann, Brandtstätter, Ohlrau, Videiko, Müller, Rassman and Videiko2016b, Reference Müller, Hofmann, Kirleis, Müller, Rud, Ţerna and Videikoin press; Rud et al. Reference Rud, Hofmann, Kosakivskyi, Zaitseva and Müller2019; Ţerna et al. Reference Ţerna2019; Millard Reference Millard and Gaydarska2020; Ohlrau Reference Ohlrau2020; Harper et al. Reference Harper2021; Shatilo Reference Shatilo2021). The start and end dates of occupations were determined using the boundary function of OxCal v4.4 (Bronk Ramsey Reference Bronk Ramsey2009) and the calibration curve IntCal20 (Reimer et al. Reference Reimer2020. For sites without radiocarbon dates, mean dating of the periods according to Harper (Reference Harper2013) was used. The often-inconsistent data of the radiocarbon laboratory in Kiev were not relied on.
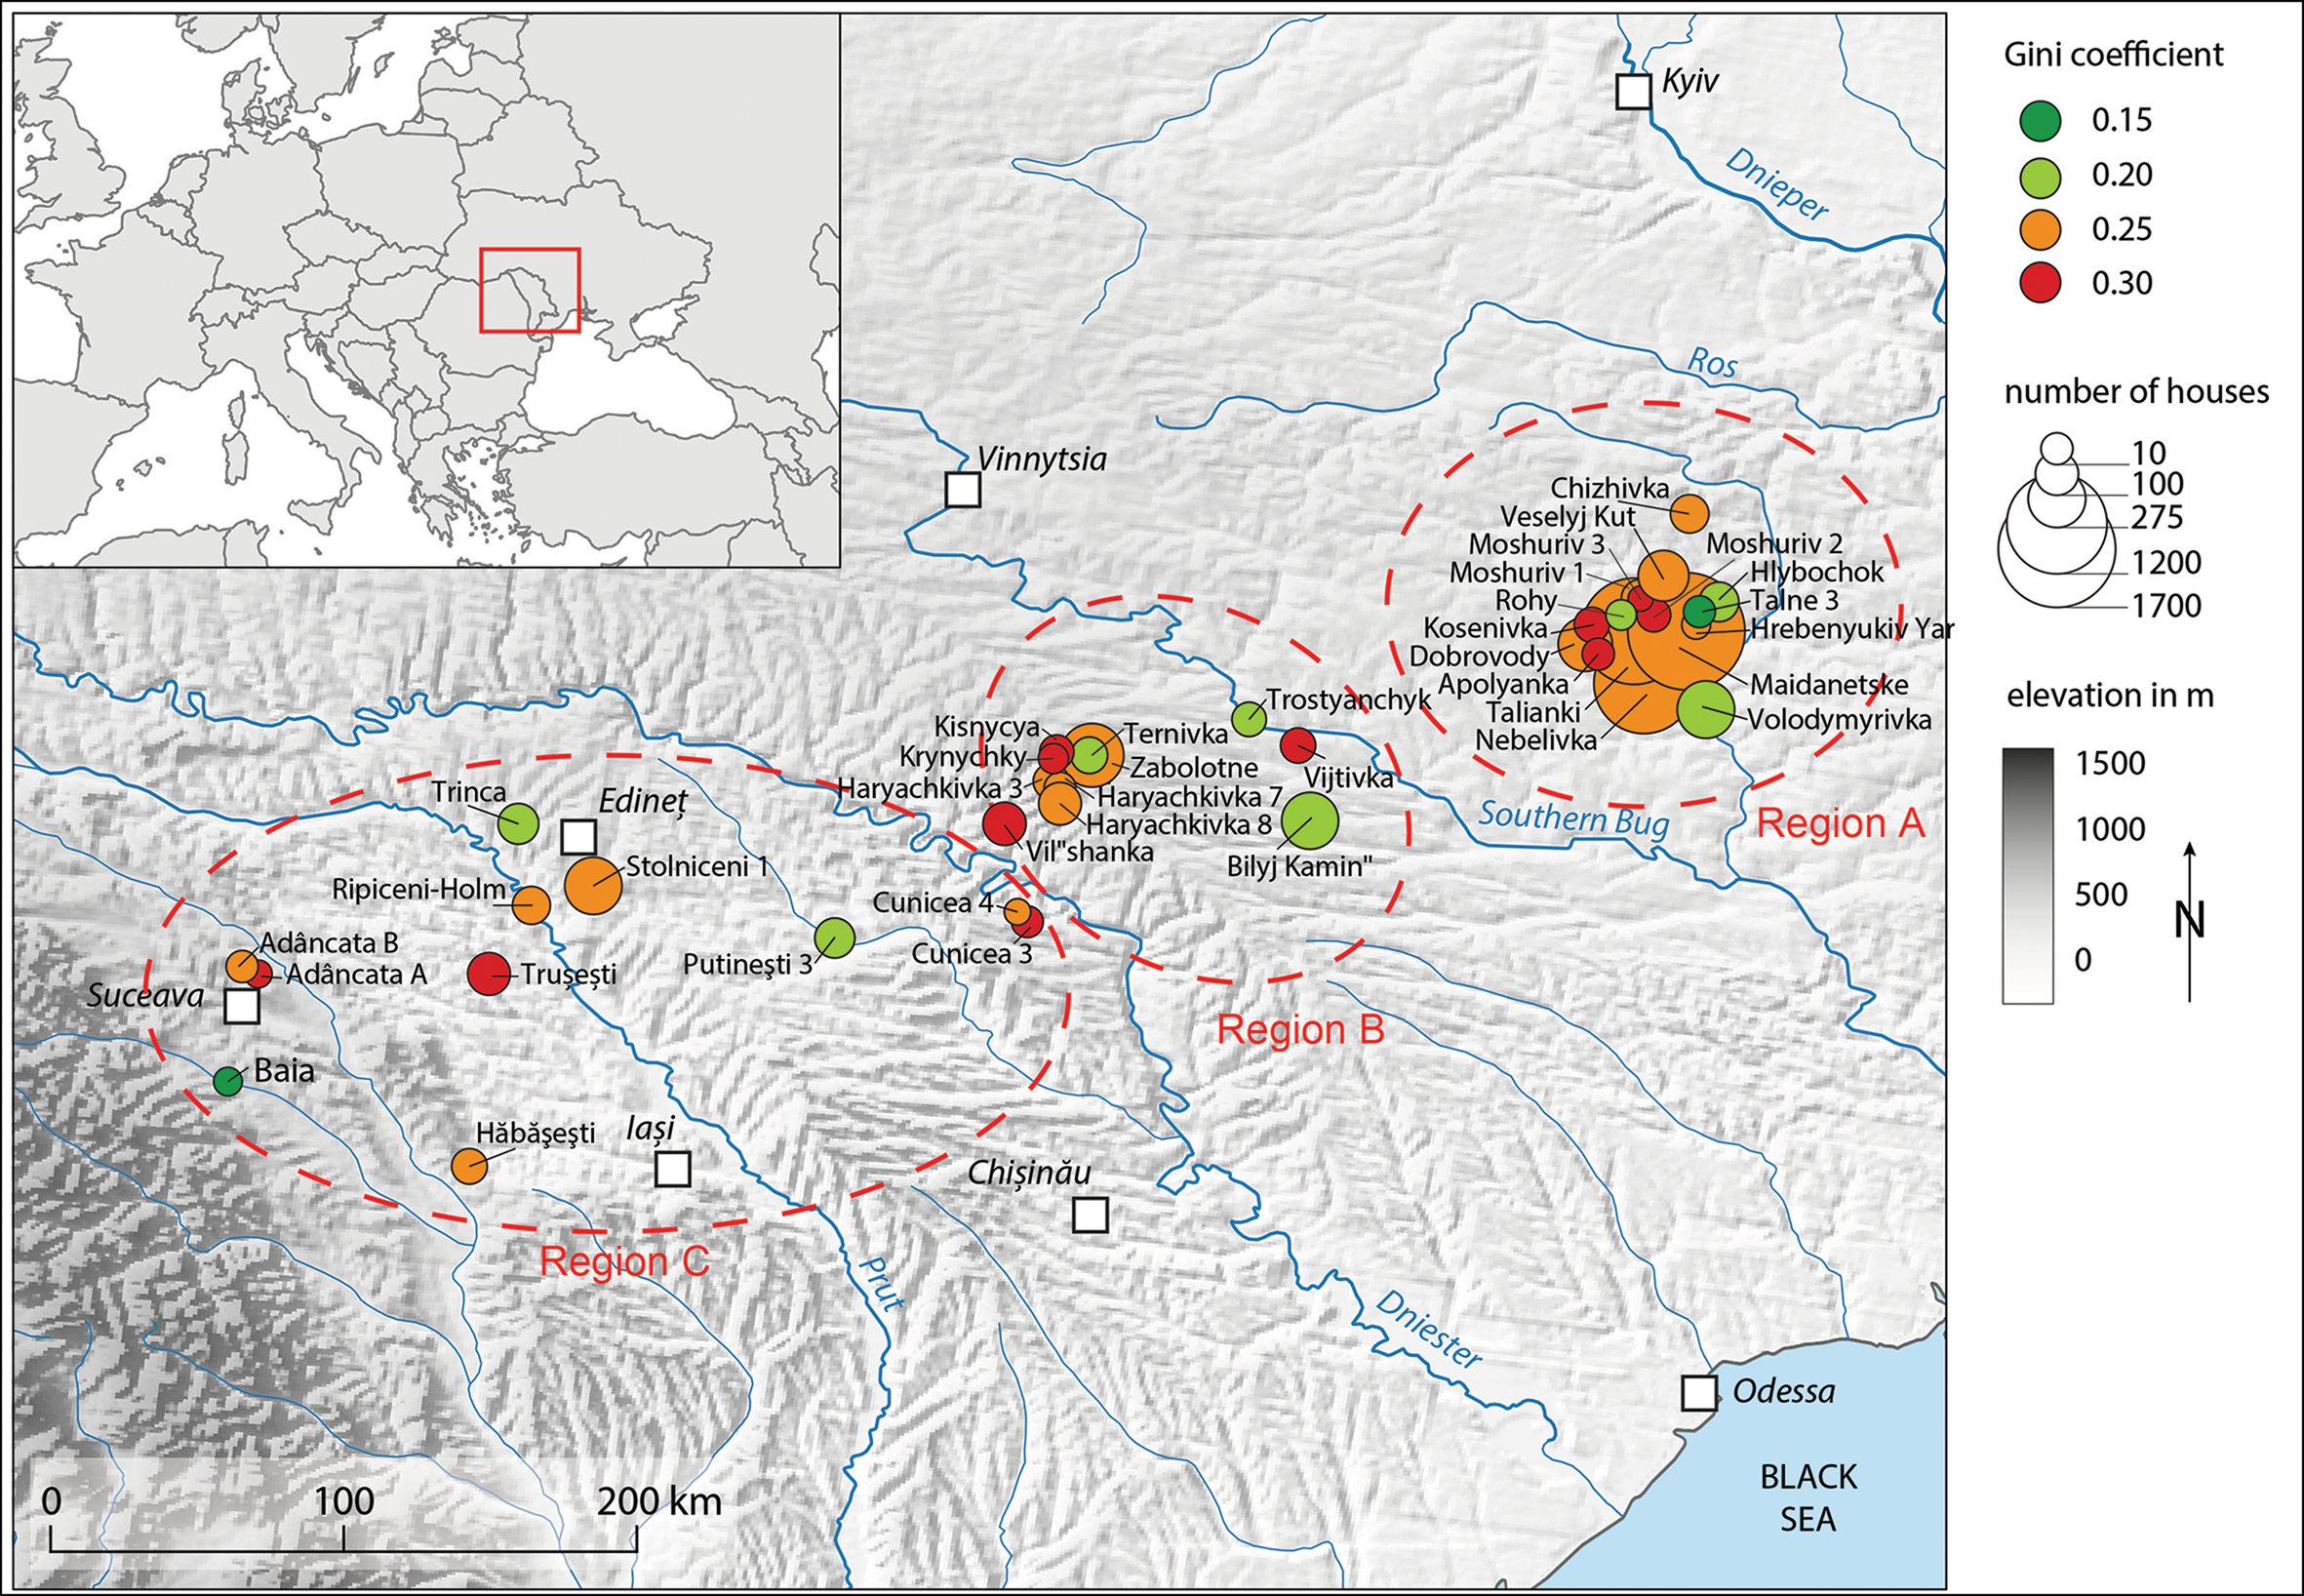
Trypillia houses show enormous spatio-temporal variation in terms of construction, size and floor plans. The remains of burnt Trypillia houses, so-called Ploshchadki, are frequently characterised by massive platforms. Often, but not always, the main living floor was located on the upper surface of this platform, with partly standardised arrangements of ovens, fireplaces (so-called altars), podiums, storage bins and workspaces (Chernovol Reference Chernovol2019). Since there are also cases where these elements are arranged partly or completely beneath the platform, some authors assume that these houses had two full storeys (Kruts Reference Kruts, Korvin-Piotrovskiy, Kruts and Rizhov2003; Burdo et al. Reference Burdo, Videiko, Chapman, Gaydarska, Hofmann and Smyth2013). Although there are instances where installations and partition walls were present on two levels, they are mostly concentrated on only one level. We consider this level to be the main living floor, while the other level might represent a space for storage, craft activities or the stabling of animals. Moreover, the reconstruction of buildings with two full storeys is questionable, given the lack of vertical posts necessary to support such a structure. It seems more plausible that the platform was only slightly raised above ground level, but high enough to create a space for certain activities to be carried out beneath the main living space (Müller & Videiko Reference Müller, Videiko, Müller, Rassman and Videiko2016; Müller et al. Reference Müller2017) (Figure 2). We therefore assume that the different levels do not have a significant effect on the usable living space and that the floor size of the houses can be determined with sufficient precision. The shapes of individual houses are visible in geophysical surveys because their daub structures were burnt. We have reconstructed the size of houses based on the outer edge of each discrete, rectangular area of burnt daub. Magnetic anomalies indicated houses of uncertain extent are excluded from the analysis. Also excluded were the remains of communal buildings, which can be identified from their highly visible positioning within the settlements’ public spaces and their exceptional size and architecture (Hofmann et al. Reference Hofmann2019).
Artist's reconstruction of a Trypillia house with a raised platform at the mega-site of Maidanetske in region A (image by Susanne Beyer).
Where geophysical surveys have only partially covered the full extent of a settlement, the degree to which the surveyed area is representative of the wider settlement may be questionable. This is especially evident at the sites of Hlybochok and Vijtivka, where magnetometry survey focused on the settlements’ central open spaces (see Ohlrau & Rud Reference Ohlrau, Rud, Mischka, Mischka and Preoteasa2019). Comparisons with other settlements, such as Maidanetske and Bilyj Kamin, show that these central spaces are marked by particularly large houses. This may result in the biasing of house size variability for only partly surveyed settlements like Hlybochok and Vijtivka but, due to its hypothetical nature, this was not factored in our analysis. When these settlements have been fully surveyed, we will check how this affects our results.
Methods
The use of house size as a proxy for the economic status and social power of households in a society is based on broad cross-cultural evidence from ethno-archaeological studies and archival sources as it has been found that household wealth and house size are correlated in many societies (e.g. Netting Reference Netting1982; Kohler et al. Reference Kohler2017: suppl. 1). Others see the variability in household sizes mainly as reflection of the number of people belonging to a household (e.g. Wilk Reference Wilk1983; Smith et al. Reference Smith, Kohler, Feinman, Kohler and Smith2018). However, household size also appears to be positively related to material household wealth, particularly in agricultural and pastoralist societies, insofar as household wealth can be inherited over several generations and thus tends to accumulate (Mulder et al. Reference Mulder2009). In addition, poorer households are prone to lose members to richer households, have lower life expectancy and higher infant mortality rates (Netting Reference Netting1982). As larger households had greater prosperity and could draw on a sufficient pool of labour, they could be both the cause and the result of a higher household income (Bogaard et al. Reference Bogaard, Styring, Whitlam, Fochesato, Bowles, Kohler and Smith2018; Porčić Reference Porčić2018). Floor sizes and the general (construction) quality of housing thus potentially reflect the ability of a household to mobilise materials and labour for its construction. Altogether, house floor sizes combined with other indicators seem to be a reliable proxy for both the economic status (wealth) and social power of a household within a society (e.g. Smith et al. Reference Smith, Kohler, Feinman, Kohler and Smith2018; Basri & Lawrence Reference Basri and Lawrence2020).
The Gini coefficient is a well-established method of measuring unevenness in the distribution of material within a given population or sample. In economics, it is used to measure the relative concentration or inequality of incomes (see Gini Reference Gini1921). It is expressed as values between zero and one: in the case of completely equal distribution, the Gini coefficient is zero, and where total income is concentrated with only one individual or in a single household, it has a value of one. In archaeological applications, Gini coefficients have been used to evaluate the inequality of burial assemblages (e.g. Windler et al. Reference Windler, Thiele and Müller2013; Großmann Reference Großmann2021) and house sizes (Kohler et al. Reference Kohler2017; Porčić Reference Porčić2018; Bogaard et al. Reference Bogaard, Fochesato and Bowles2019; Basri & Lawrence Reference Basri and Lawrence2020).
To calculate Gini coefficients based on Trypillia house sizes, we have used the DescTools (v0.99.44) package in the open-source programming language for statistical computing, R (v4.0.3, R Core Team 2021). This package allows bootstrapping of the confidence intervals of the coefficient. Bootstrapping is a standard sampling method to get to reliable estimates of the “true” parameters of the underlying distribution. It involves random draws from the sample up to the size of the sample. This process is repeated many times (in our case 10 000 times). We used the unbiased version of the formula for the Gini coefficient which is especially relevant for small sample sizes. This entails multiplying the Gini value by n/(n-1) (Weiner & Solbrig Reference Weiner and Solbrig1984). We calculated bias corrected and accelerated (bca) confidence intervals (Dixon et al. Reference Dixon, Weiner, Mitchell-Olds and Woodley1987) to cater for the fact that conventional confidence intervals are known to be biased and too narrow with a range of 80 per cent (following Kohler et al. Reference Kohler2017: 5) with 10 000 bootstrapped replicates (= repetitions, see above). For the graphical output of the locally weighted scatterplot smoothing regression (LOESS) lines, we relied on the smoothing function ‘loess’ in the ggplot2 package (v3.3.5) with a span of 0.75 and a confidence level of 0.95. LOESS involves continuous polynomial fitting of a subset of the data at hand along the x-axis with weighted least squares regression. This method is very effective in visualising the non-linear relationship between two variables without presupposing any global function (Cleveland Reference Cleveland1979).
Results
Differences in house size by region and compared to settlement size
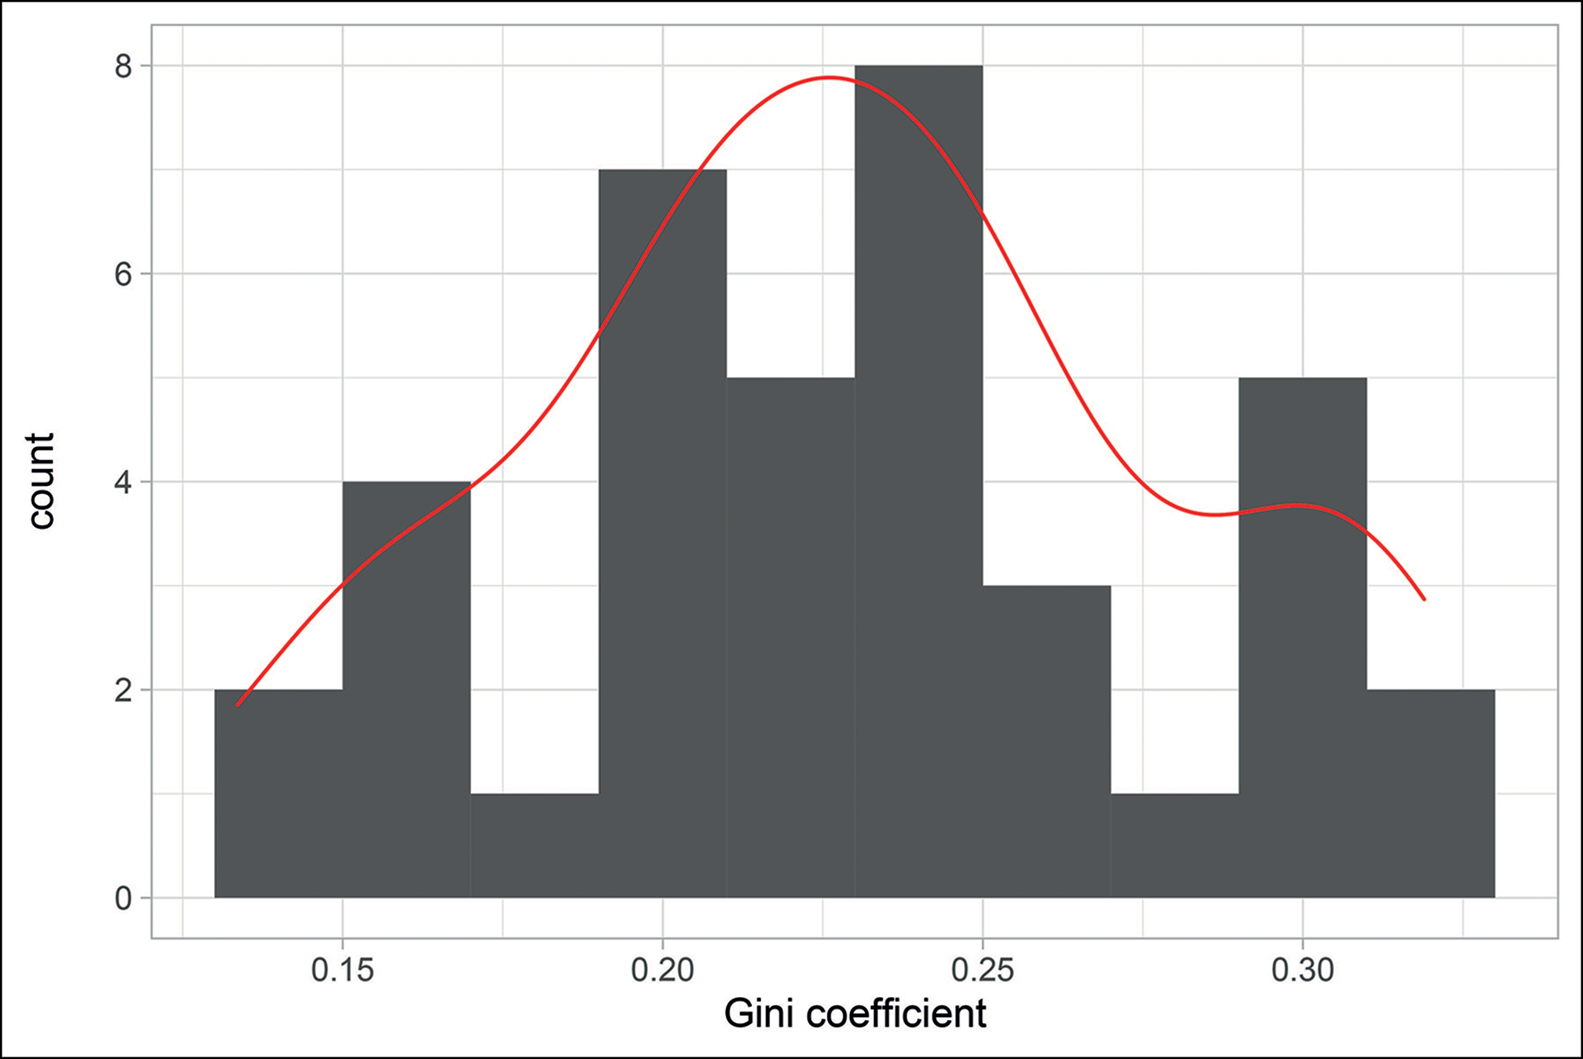
The overall Gini coefficient for all houses is 0.2385 (80% CI: 0.2355–0.2416). The Gini coefficients for each individual settlement are shown in Tables 2–4. These range between 0.1336 and 0.3189 with the mean at 0.2295. Overall, the values follow a normal distribution (Figure 3).
Distribution of Gini coefficients in the combined sample of sites (bin width = 0.02) (figure by authors).
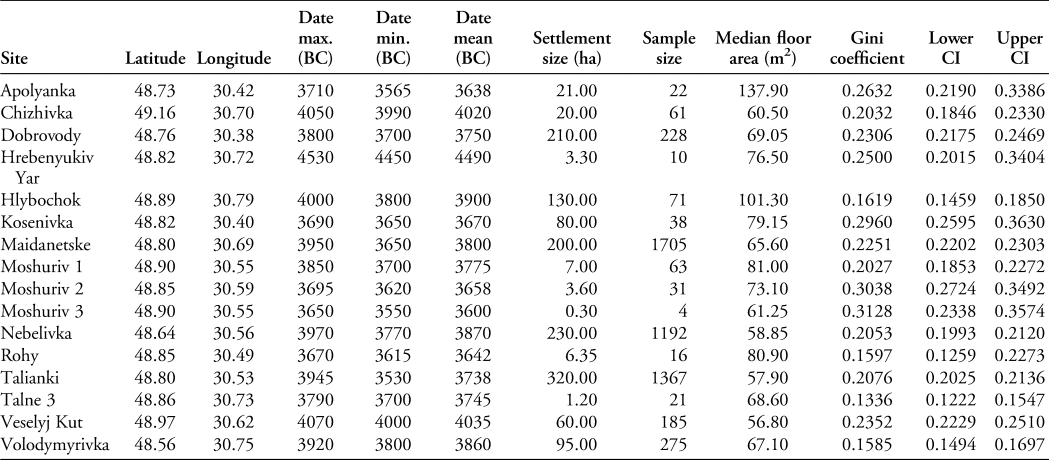
Data for sites from study region A. CI: confidence interval for Gini coefficient. Dating of the sites is given with the highest dating probability.
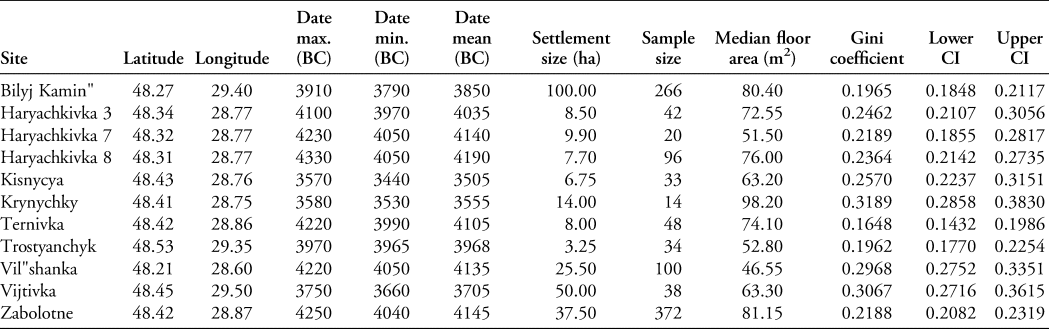
Data for sites from study region B. CI: confidence interval for Gini coefficient. Dating of the sites is given with the highest dating probability.
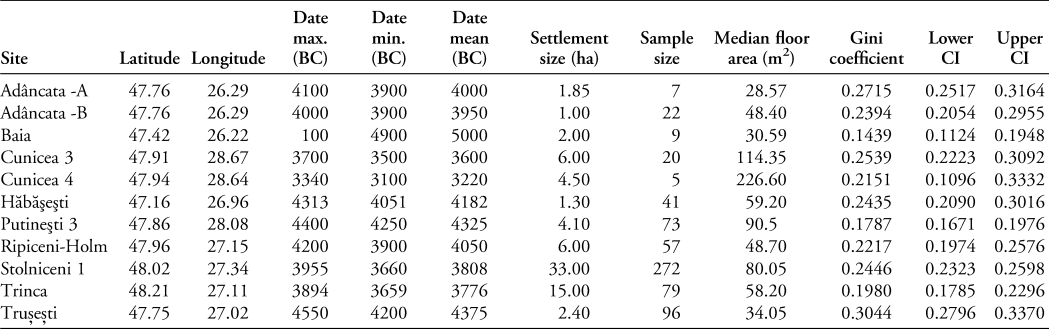
Data for sites from study region C. CI: confidence interval for Gini coefficient. Dating of the sites is given with the highest dating probability.
The Gini coefficients do not appear to be related either to overall settlement size or the number of houses within each settlement (Figure 4). Fitting the log-values of settlement size to the respective Gini coefficients yields non-significant p-values for each of the three regions (p-values: 0.4129, 0.5161, 0.768). Note, however, that the largest sites tend to exhibit Gini coefficients that are close to the mean of the overall distribution.
Gini coefficients in relation to settlement size and sample size (figure by authors).
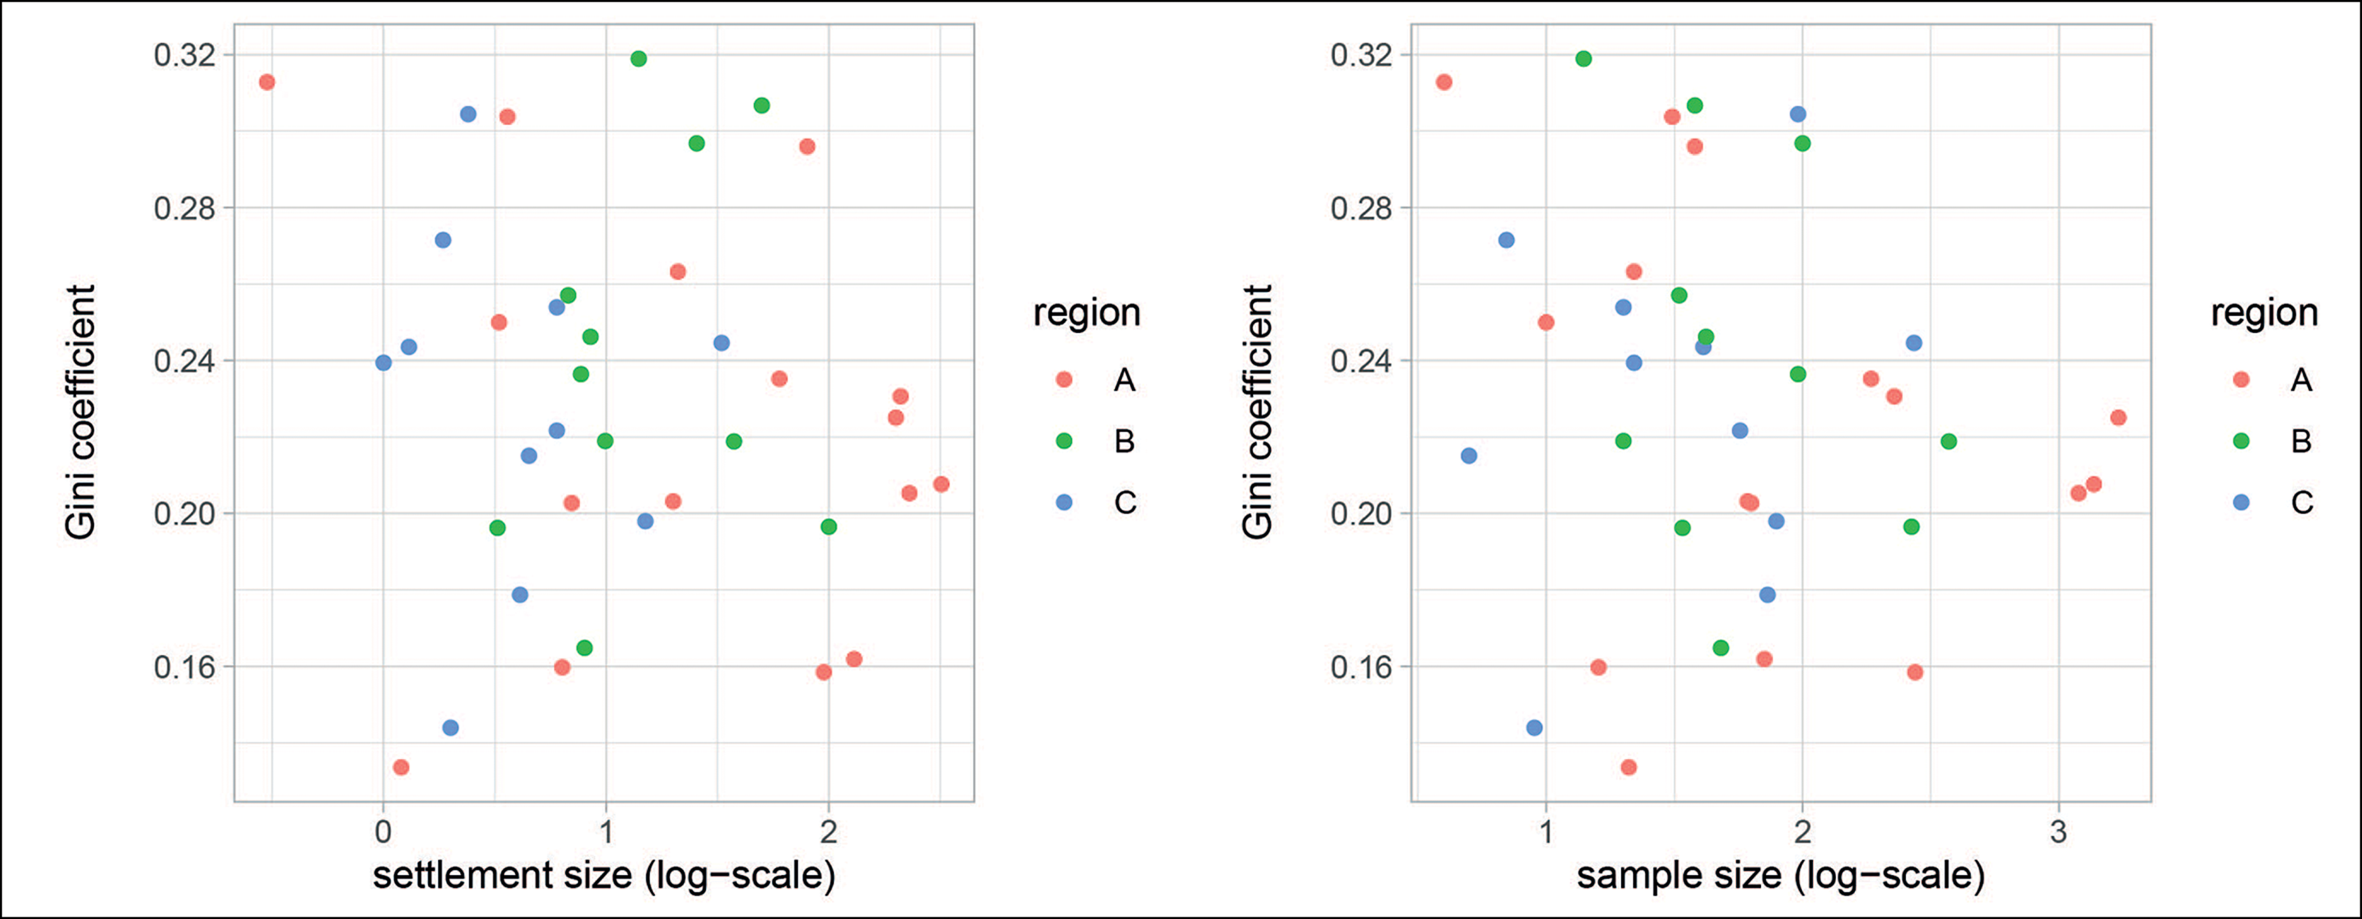
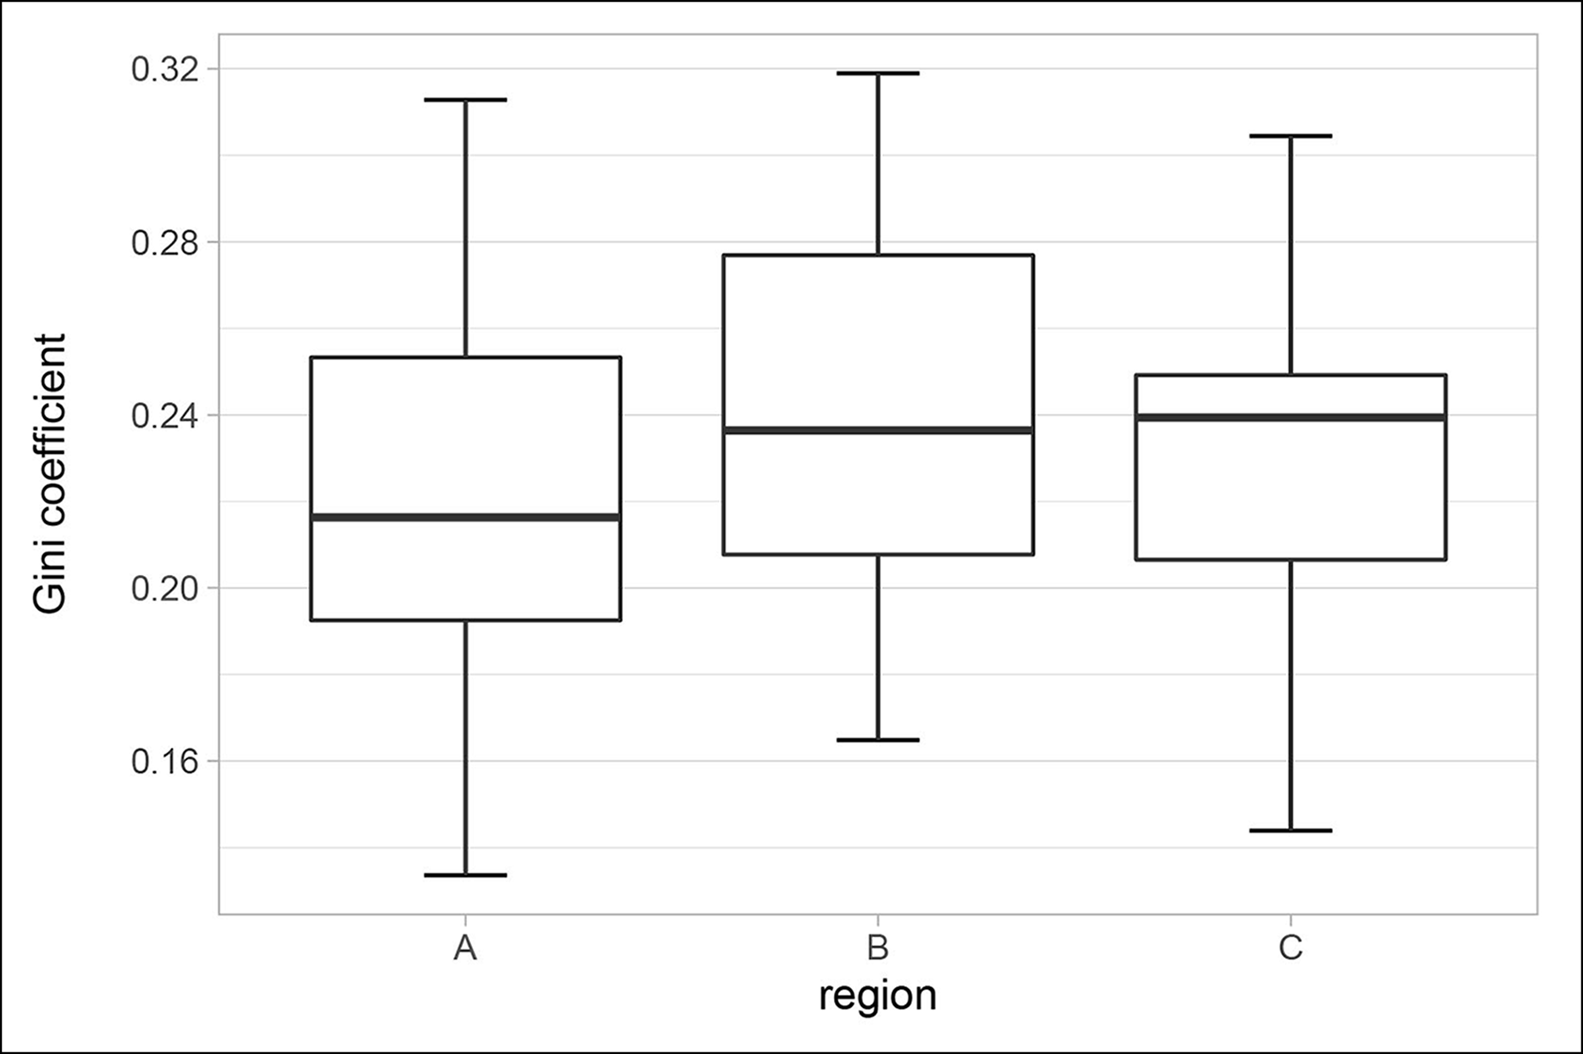
In terms of regional differences, region A has slightly lower median Gini coefficients than region B, which in turn has lower values than region C (Figure 5). However, large overlaps in the boxplots of Gini coefficients for each region suggest that the differences are not statistically significant. This is reflected in the results of Mann–Whitney U-tests of the mutual pairs A-B, A-C and B-C, none of which are significant (p-values: 0.3676, 0.6448, 0.6994).
Boxplots of Gini coefficients in regions A–C. The whiskers extend to 1.5 of the interquartile range; there are no outliers (figure by authors).
Differences in house size over time
The Gini coefficients for the settlements range between 0.17 and 0.32. The greatest variability is observed in the early Trypillia phase and the start of the middle Trypillia phases until c. 4200 BC. After that, variability decreases significantly (Figure 6A & B). Before c. 4400 BC and after 3500 BC, very few data are available. In view of these uncertainties during the earliest and latest phases of the settlement sequence, our conclusions below refer exclusively to the period that is most strongly supported by the data.
Gini values and confidence intervals for Trypillia sites across time. A–C show results from all regions; D–F show individual regions. Red, green and blue lines: locally weighted smoothing regression (LOESS), for A–B with 0.95 confidence band. Vertical bars: 0.8 confidence intervals for Gini values after bootstrapping. Horizontal bars: dating ranges of individual sites (highest probability) (figure by authors).
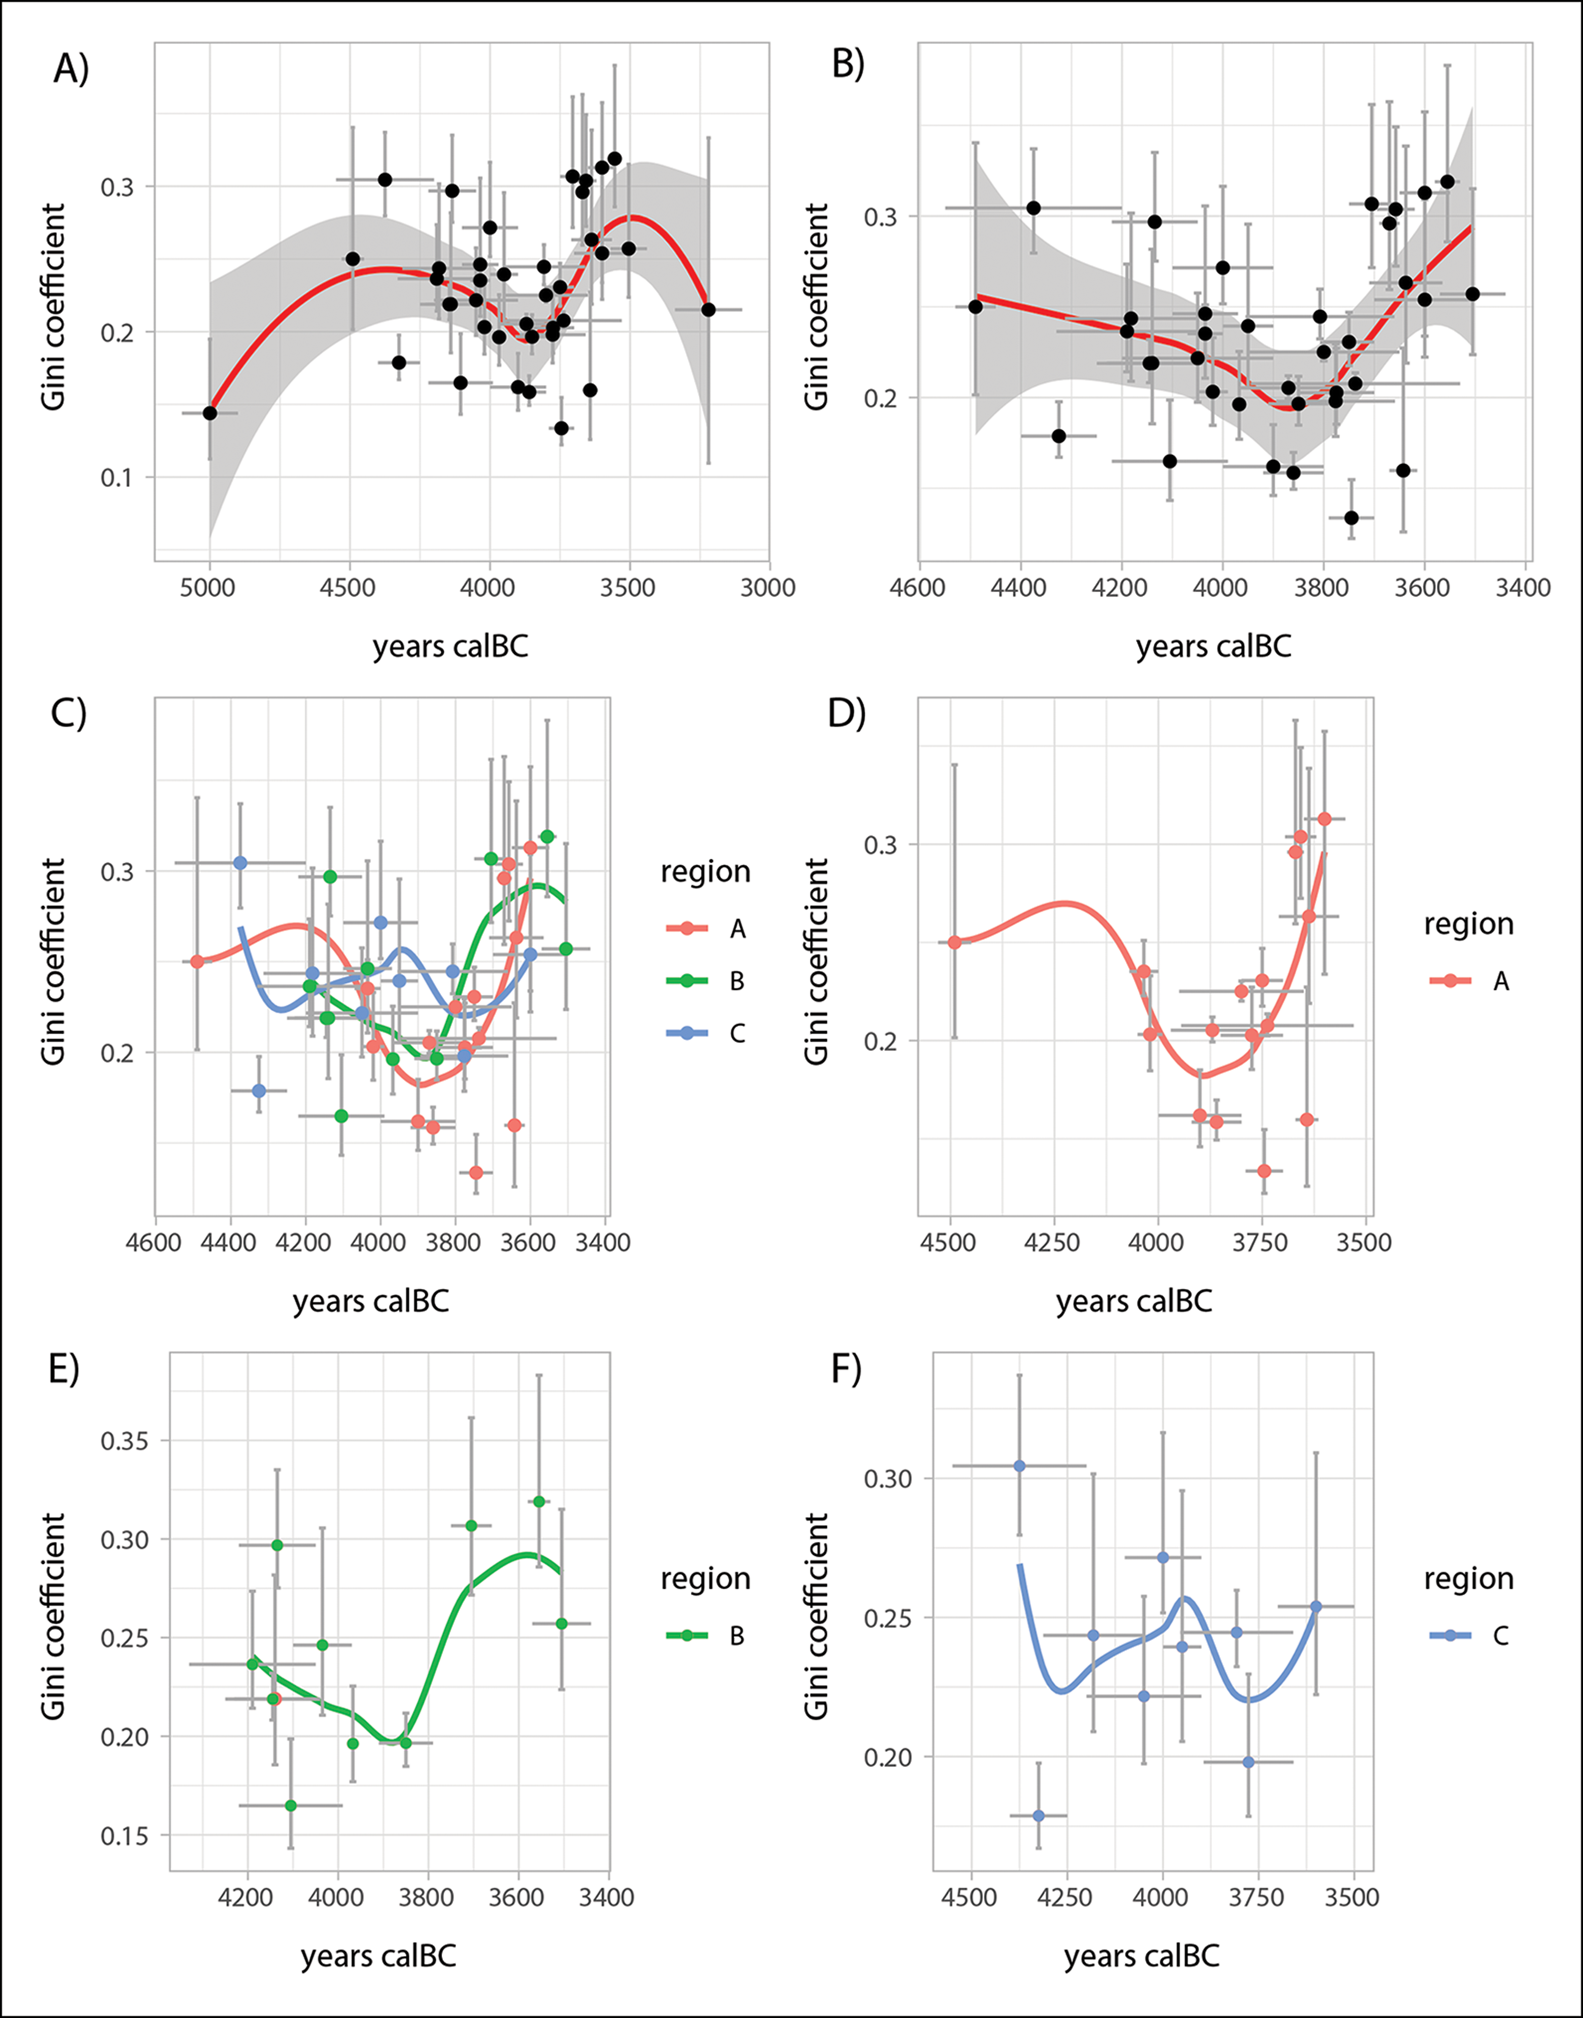
Looking at all the regions together (Figure 6A & B), a steady decline in the Gini coefficient from approximately 0.25 to 0.2 is noticeable in the early phase of Trypillian population aggregation, between c. 4200 and c. 3800 BC. In the subsequent late phase of aggregated settlements, Gini coefficients increase substantially to values of up to 0.25. In the following phase, between c. 3650 and c. 3500 BC, when populations dispersed away from aggregated settlements into smaller settlements this trend of increasing Gini coefficient continues, rising to more than 0.3 in some cases.
In region A, early settlements such as Veselyj Kut and Chizhіvka demonstrate Gini coefficients between 0.2 and 0.25 (Figure 6C & D; Table 2). In contrast, in the following phase (c. 4000–3800 BC), settlements such as Volodymyrivka, Hlybochok and Nebelivka have much lower Gini coefficients. A reversal of this trend towards somewhat higher, though still comparatively low, Gini coefficients emerges after c. 3800 BC. This includes the mega-sites of Maidanetske and Dobrovody, and the smaller settlement of Moshuriv 1. Simultaneously, some of the emerging small settlements, such as Talne 3, show extremely low Gini coefficients. During the phase between 3650 and 3550 BC, when populations began to move away from the large aggregated Trypillia settlements, the trend towards higher Gini coefficients clearly intensifies. This is the case, for example, at Moshuriv 2 and 3, Apolyanka and Kosenivka.
The pattern in region B is similar to that of region A (Figure 6C & E): in the northern sub-region, early settlements, such as Haryachkivka 7 and 8, Vil"shanka and Zabolotne, show average Gini coefficients between 0.2 and 0.3 (Table 3). The variability of house floor sizes also declines here at settlements such as Ternivka, Trostyanchyk and Bilyj Kamin". In contrast to region A, however, no large settlements are known (so far) from the phase between c. 3800 and 3700 BC. Following this hiatus, settlements with significantly higher mean Gini coefficients between 0.25 and 0.3 reappear in the northern subregion from 3750 BC onwards represented, for example, by Krynychky and Kisnycya. The pattern of house size variability in region C contrasts somewhat with the pattern in regions A and B (Figure 6C & F). Here, the Gini coefficients (Table 4) tend to increase between c. 4200 and 3900 BC; they then decrease (until at least 3800 BC) to increase again later, but the latter trend is documented only at Cunicea 3.
Discussion
Assuming that the variability in the floor size of houses reflects differences in household wealth, we can discern a decline in social inequality in Trypillia communities until at least 3800 BC. Only after 3800 BC, in the final phase of the aggregated settlements, did inequality increase slightly, before reaching a peak after 3750 BC in the phase following the demise of the large settlements. The development outlined here suggests that both an egalitarian ideology and effective mechanisms for avoiding social inequality must have existed within Trypillia communities. It implies intra-settlement mechanisms for reconciling interests and redistributing surpluses that might have been established collectively. These ideological views and mechanisms may have changed over time, enabling a revival of vertical social differentiation. In our opinion, this was a decisive factor in the subsequent gradual demise of aggregated settlements.
Several other arguments can be advanced to support our interpretation of the Gini coefficient data:
1) The architecture of the houses (i.e. floor plan and construction) shows a high degree of standardisation, as do the furnishing of the houses and the economic activities detectable within (Chernovol Reference Chernovol, Menotti and Korvin-Piotrovskiy2012).
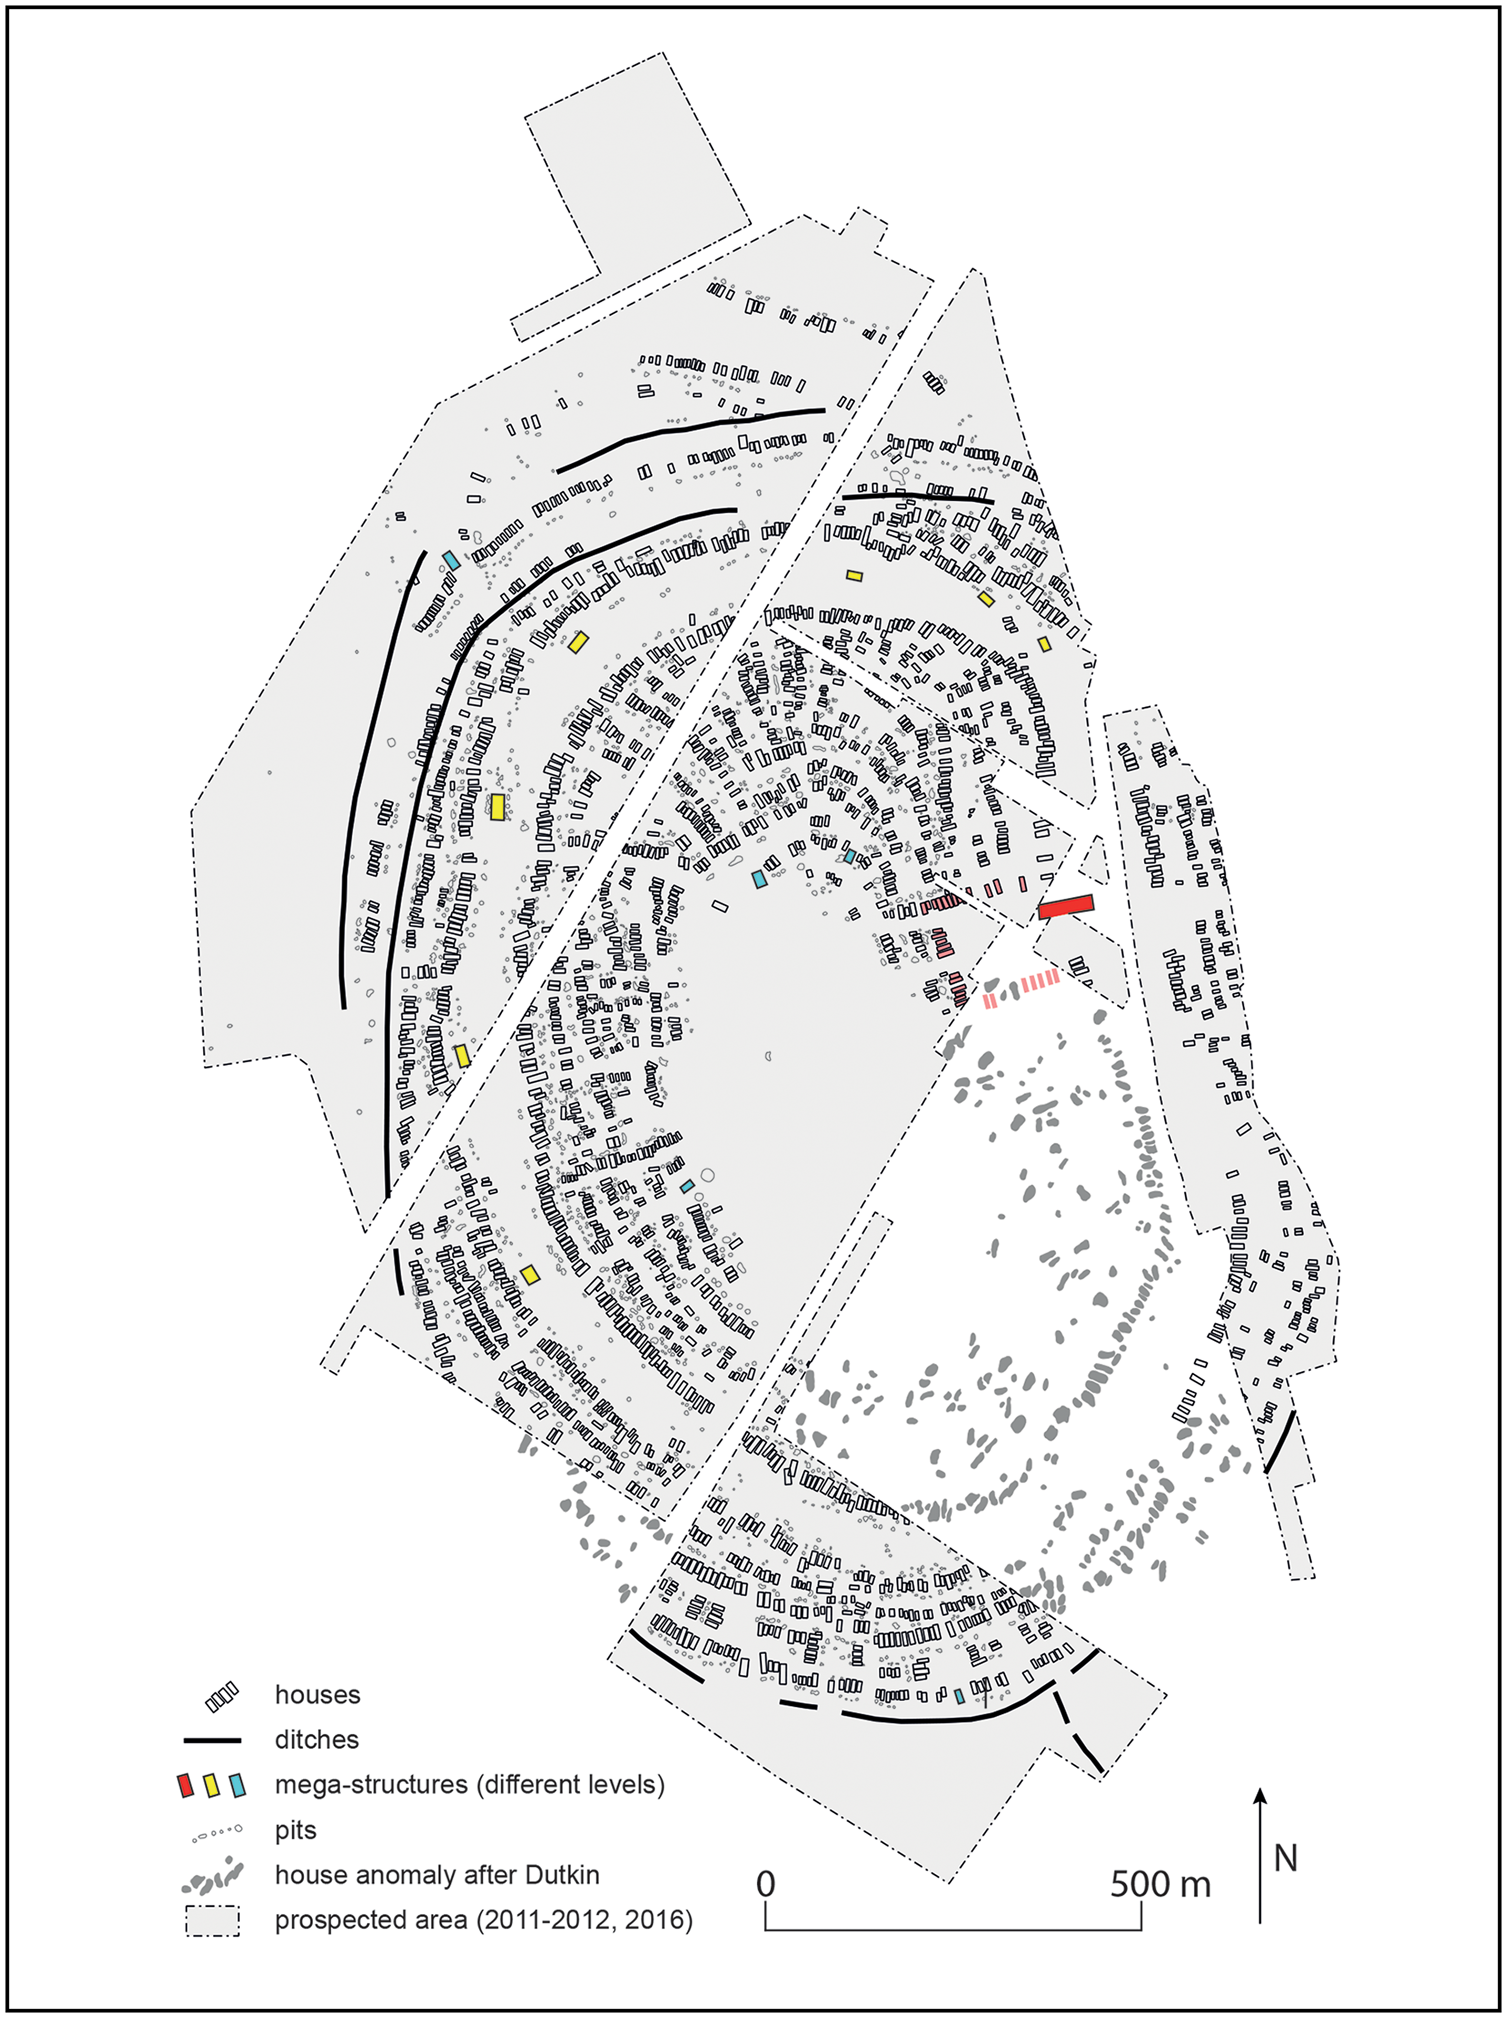
2) The round and oval settlement layouts ensured equal access to structural elements and infrastructure (e.g. central open spaces) and find analogies in the floor plans of communities organised along egalitarian lines in other ethnographic contexts (e.g. Wagner Reference Wagner, Haude and Wagner2019) (Figure 7).
3) At Maidanetske and other sites, large dwellings requiring much construction material are concentrated along the corridors between the concentric rings of houses and other highly visible public places within the settlements (Pickartz et al. Reference Pickartz2022). This matches the observation made by Castro et al. (Reference Castro, Hakansson and Brokensha1981) that richer households occupy economically strategic and more visible positions in settlements.
4) Recent studies that have examined Trypillia sites from a social archaeological perspective, based on systematic comparisons of assemblages from houses, suggest that larger houses contain higher quantities of objects associated with food preparation (Ohlrau Reference Ohlrau2020: 58) or more evidence of activities associated with higher social prestige (Țerna Reference Țerna2021).
5) Large aggregated Trypillia settlements frequently demonstrate evidence of a system that included multifunctional assembly houses, the so-called mega-structures (Müller et al. Reference Müller, Hofmann, Ohlrau, Müller, Rassman and Videiko2016c; Hofmann et al. Reference Hofmann2019). These buildings were positioned prominently in public spaces, indicating wide participation in political processes and the consumption of surplus. They probably functioned as institutions in political decision-making processes and were particularly developed in our region A. The development of house size variability seems to coincide with changes in decision-making processes. The reduction in size and eventual disappearance of the more modestly sized assembly houses was accompanied by the increasing enlargement and architectural elaboration of central mega-structures, starting c. 3800 BC at the latest (Hofmann et al. Reference Hofmann2019). Some of these high-level mega-structures take on monumental forms (Rud et al. Reference Rud, Hofmann, Kosakivskyi, Zaitseva and Müller2019). In our view, it is reasonable to suggest a link between growing social inequality—manifested in increased variability in house sizes—and transformation of social organisation towards centralised decision-making.
6) Our argument is further supported by the settlement dynamics in study regions A and B. The demise of large Trypillia settlements and the formation of smaller communities in the surrounding regions starts just when social inequality begins to increase again (Hofmann & Shatilo Reference Hofmann, Shatilo, Dębiec, Górski, Müller, Nowak, Pelisiak, Saile and Włodarczak2022). These smaller communities were likely to have been formed by groups of people who decided to no longer live at a mega-site (Hofmann & Shatilo Reference Hofmann, Shatilo, Dębiec, Górski, Müller, Nowak, Pelisiak, Saile and Włodarczak2022; Hofmann et al. Reference Hofmann, Shatilo, Videiko, Hofmann, Kirleis, Müller, Rud, Ţerna and Videikoin press b). Thus, the end of the aggregated Trypillia communities and mega-sites coincided with when the mechanisms of social levelling and political participation began to fail and social inequality re-emerged.
Plan of the Trypillia mega-site of Maidanetske (after Hofmann et al. Reference Hofmann2019).
Conclusion
We have used variability in the sizes of houses at 38 Trypillia settlements to explore changing levels of inequality across three geographical regions and two millennia using standard Gini coefficients. We interpret the results to indicate that Trypillia mega-sites successfully avoided wealth inequalities between individual households. Their communities may have achieved this through an egalitarian ideology and effective mechanisms of reconciliation of interests and intra-community redistribution of (potentially) collectively generated surplus. Our results shed new light on the nature and possible reasons for the formation and decline of these unique prehistoric communities. We contend that, by enabling members to participate actively in political decision-making processes, the social make-up of aggregated mega-sites might have had a ‘reforming’ character, which may have been decisive for attracting, for a time, large numbers of people to these communities.
We therefore believe we can partially answer the frequently discussed question of why Trypillia mega-sites emerged. The mega-site concept included a levelling mechanism to prevent social inequality, with co-operative economic management and living arrangements used to minimise inequality. The Gini coefficients generated here show that this was successful for a long time. Only during the later development phase of the mega-sites, from c. 3800 BC onwards, did the tendency towards social inequality increase again. Thus, the mega-site phenomenon represents one of a series of historical examples that show that an increase in the complexity of societies is not necessarily associated with an increase in vertical social differentiation. Rather, both the emergence and the break-up of aggregated Trypillia mega-sites were primarily due to the political decisions made by the individuals and communities who lived at—and who eventually decided to leave—these vast settlements.
Acknowledgements
We are most grateful for the many years of fruitful co-operation with Vladislav Chabanyuk (State Historical and Cultural Reserve ‘Trypillia Culture’ Lehedzyne, Ukraine), Knut Rassmann (Roman-Germanic Commission of the German Archaeological Institute), Vitalii Rud (Institute of Archaeology, National Academy of Sciences of Ukraine), Ghenadie Sîrbu (State University of Moldova), Stanislav Ţerna† (most recently Kiel University, CRC1266), and Mikhail Yu.Videiko (Borys Grinchenko Kyiv University, Ukraine). We thank the anonymous reviewers for their constructive and helpful comments.
Funding statement
This research was carried out within the framework of the Kiel Collaborative Research Center 1266 ‘Scales of Transformation – Human-Environmental Interaction in Prehistoric and Archaic Societies’ (German Research Foundation – Project number 290391021-SFB 1266).
Supplementary material
To view supplementary material for this article, please visit https://doi.org/10.15184/aqy.2024.18.


 Open access