

Introduction
In the last decades, genetic improvement of beef cattle breeds has been focused mainly on growth traits. However, profitability of beef production in a beef herd is directly related to a high reproductive rate. Female reproductive traits appear to be the most economically important characters in many production systems (Newman et al., Reference Newman, Morris, Baker and Nicoll1992; Phocas et al., Reference Phocas, Bloch, Chapelle, Bécherel, Renand and Ménissier1998; Urioste et al., Reference Urioste, Ponzoni, Aguirrezabala, Rovere and Saavedra1998). Hence, fertility should be included as part of the breeding objectives for beef cattle. However, the possibility of using reproductive information as a selection tool for breeders faces difficulties, especially under extensive pastoral conditions.
Reproductive performance is a complex trait with many components. Several such components have been investigated as measures of female reproductive performance. In beef cattle, focus has been on calving date (Bourdon and Brinks, Reference Bourdon and Brinks1983; Buddenberg et al., Reference Buddenberg, Brown and Brown1990), or the related calving day (Ponzoni, Reference Ponzoni1992) or days to calving (Meyer et al., Reference Meyer, Hammond, Parnell, Mackinnon and Sivarajasingam1990; Johnston and Bunter, Reference Johnston and Bunter1996; Donoghue et al., Reference Donoghue, Rekaya and Bertrand2004a). Recently, heifer pregnancy status and the outcome of subsequent rebreeding have attracted interest (Evans et al., Reference Evans, Golden, Bourdon and Long1999; Doyle et al., Reference Doyle, Green, Golden and Brinks2000; Eler et al., Reference Eler, Silva, de, Evans, Ferraz, Dias and Golden2004). Calving success (CS) has been studied as well (Meyer et al., Reference Meyer, Hammond, Parnell, Mackinnon and Sivarajasingam1990; Mercadante et al., Reference Mercadante, Packer, Razook, Cyrillo and Figueiredo2003; Donoghue et al., Reference Donoghue, Rekaya, Bertrand and Misztal2004d). Rust and Groeneveld (Reference Rust and Groeneveld2001) summarised advantages and disadvantages of different component traits. It seems that a completely satisfactory measure of reproduction has not emerged yet.
Reproductive variables are strongly influenced by management and nutrition. In addition, the level of development of the recording system represents a constraint, making prediction of breeding values a difficult task. This is particularly true for some pasture mating systems where information on females is extremely scarce, e.g. the situation reported by Rust and Groeneveld (Reference Rust and Groeneveld2002) for South African conditions. Under extensive management systems, the number of traits and the frequency at which they can be measured is low. Often, reproduction information on cows can be derived only from birth records of their offspring, since female reproductive performance is seldom recorded. This is the case of the Aberdeen Angus breed in Uruguay, where a national genetic evaluation scheme is under development. At present, expected progeny differences for growth traits are reported routinely, but no genetic evaluation of female reproductive ability is available yet.
In addition, many reproductive measures, such as CS, heifer pregnancy and rebreeding performance outcomes, are typically binary traits, i.e. without continuous phenotypic expression, and analysis must centre on the probability of success (1) or of failure (0). Bayesian methods for categorical data are potential candidates for analysis of many reproductive traits. Markov chain Monte Carlo (MCMC) methods can be used in Bayesian threshold models for inferring genetic parameters of categorical traits (Sorensen et al., Reference Sorensen, Andersen, Gianola and Korsgaard1995) and this approach has been applied in dairy cattle to health (e.g. Heringstad et al., Reference Heringstad, Rekaya, Gianola, Klemetsdal and Weigel2001; Chang et al., Reference Chang, Gianola, Heringstad and Klemetsdal2004) and reproductive data (e.g. Averill et al., Reference Averill, Rekaya and Weigel2004; González-Recio et al., Reference González-Recio, Chang, Gianola and Weigel2005).
Bayesian analyses of reproductive traits using threshold models are rare in beef cattle (Donoghue et al., Reference Donoghue, Rekaya and Bertrand2004b and Reference Donoghue, Rekaya, Bertrand and Misztal2004d; Spangler et al., Reference Spangler, Sapp, Rekaya and Bertrand2006). There is a need for further characterisation of CS, because it is easy to record under extensive conditions. The objective of this study was to assess CS as a heritable female reproductive trait under pastoral conditions, using simple Bayesian threshold-liability sire models that account for the discrete nature of the measure. The Uruguayan situation was used as an example of a scenario in which this candidate trait can provide a tool for beef cattle breeding improvement programmes under extensive conditions.
Material and methods
Data
Records were from the Uruguayan Aberdeen Angus database. The initial data set had approximately 33 000 calving records and 14 000 cows in 56 herds. Variables that are often used for describing female fertility include joining or mating dates and type of mating (artificial insemination (AI) or natural service). This type of information was not available systematically in this database. Calving records from cows with missing sire or birth date, born in the fall, age <600 days at calving, used as embryo transfer donors or recipients or with calving interval <280 days, were removed. The data used for analysis included spring calving cows with a clearly identified first calving at the age of 2 or 3 years, and with all subsequent calvings. In this database, 70% of the animals are pedigree cows. Because of this, such cows have an extra economic value and tend to stay in the herd longer than grade cows, even if they do not calve for several years. On the other hand, grade cows are often treated like pedigree cows. Therefore, the assumption that all non-pregnant cows remained in the herd seemed realistic. Hence, a cow with no recorded calving in a specific year(s), but appearing in subsequent year(s), was assigned a zero (failure to calve) score in the corresponding year(s) between two identified calvings.
As a consequence of this editing strategy, there was no variation in the outcome of first calving since all cows included had a first (success) calving record. We focused on the second, third and fourth calving opportunities, because there were very few cows with records on subsequent parturitions. CS was defined as a binary trait: females that calved were coded as 1, whereas cows failing to calve were coded as 0. CS at the three different calving opportunities was treated as a different trait. No distinction between observations obtained from natural or artificial mating was made, following Donoghue et al. (Reference Donoghue, Rekaya, Bertrand and Misztal2004c), who reported a high genetic correlation between days from calving to first insemination under artificial or natural mating, suggesting that it is the same trait.
Herd and year levels with less than five observations were discarded. After this editing process, the final data set consisted of 2032 records from cows having a second calving opportunity, born in 1975 through 2000, in 24 herds; 1080 and 947 cows had a third and a fourth calving opportunity, respectively. A total of 444 male ancestors, including 409 sires with daughter records and their sires and maternal grandsires, were in the pedigree file. Further description of data and genealogy is in Table 1.
Descriptive statistics of the data set

†SS = sire of sire; MGS = maternal grandsire.
Statistical procedures
Threshold liability models (e.g. Gianola and Foulley, Reference Gianola and Foulley1983) were used for the analysis of CS as a binary response. The threshold model postulates an underlying continuous random variable, called liability, λ, such that the observed binary responses (y) are the result of the following relationship:
where τ is a fixed threshold and yi = 1 or 0 corresponds to the observed success or failure to calving for observation i, respectively. In a univariate setting, liability is assumed to be normally distributed with mean vector μ and covariance matrix ![]() , where
, where  is the variance in the underlying scale. Since the threshold and
 ![]() are not identifiable, these parameters are usually set to some arbitrary values (τ = 0 and
are not identifiable, these parameters are usually set to some arbitrary values (τ = 0 and  ) to denote origin and scale of measurement, respectively.
Univariate, bivariate and trivariate models were fitted to describe CS (0, 1) data at the second, third and fourth calving opportunities. Preliminary runs indicated that including or excluding from the model effects such as age at first calving, age at calving and previous physiological status did not affect estimates of dispersion parameters. One disadvantage of including age at first calving or previous physiological status of cows in the model is that these variables may reflect environmental and genetic components, probably those we want to detect. Service bulls and mating management (AI or natural service) were available for calving but not for failing cows, hence they could not be used for further analysis. With the purpose of using a simple model, these effects were not fitted in final analyses.
There was a high degree of confounding between age of cow and year of birth, since 92% of cows calved at 3 years of age. Under extensive conditions, the year effect is a descriptor of variation in climate and pasture conditions. Finally, we were also interested in herd variability as a way to ascertain differences in nutrition and management, relative to genetic variability. Hence, liabilities were expressed as a linear function of effects of cows’ birth year, herd, sire of cow and of a residual.
The trivariate model is described in what follows, with the bivariate and univariate models being special cases. In matrix notation, the model can be represented as
where λ is an n × 1 vector of unobserved liabilities, β is a vector of calving year (or cows’ birth year) effects of order p; h is a vector of herd effects of order q; s is a vector of sire expected progeny differences of order r; e is the vector of residual effects and X, Zh and Zs are known incidence matrices.
Residuals were assumed to be distributed according to the multivariate normal process  , where I is an identity matrix of appropriate order, and
is the within-cow residual (co)variance (correlation) matrix of the order k, where k is the number of calving opportunities (2, 3 or 4), and ri,j is the residual covariance between calving opportunities i and j. For k > 1, for cows lacking data for all calving opportunities, ‘missing liabilities’ were included in an augmented posterior distribution, assuming missingness was at random.
A sire model, with sire and maternal grand sire pedigree information, was used to avoid pitfalls of the animal threshold model in connection with estimation of genetic parameters (Moreno et al., Reference Moreno, Sorensen, García-Cortés, Varona and Altarriba1997).
Prior and posterior distributions
Independent proper uniform priors (−9999, 9999) were assigned to each of the elements of β. With a small number of records per herd, the possibility that all observations fall in the same category, either one or zero, arises. When this occurs, the maximum likelihood estimates of such effects, when treated as fixed, are not finite. Moreno et al. (Reference Moreno, Sorensen, García-Cortés, Varona and Altarriba1997) showed that assigning herd effects a Gaussian prior distribution centred at zero in Bayesian analysis, helps in reducing biases in inferences about variance components. Therefore, a multivariate normal prior was used for herd effects, with the specification
where
is the k × k (co)variance matrix between herd effects on the k calving opportunities, and I is an identity matrix of the order q×q.
Sire expected progeny differences on the liability scale were assigned the multivariate normal prior
where
is the (co)variance matrix between sire expected progeny differences for the k calving opportunities, gi,j is the sire covariance between CS at the ith and jth calving opportunities, and A is the known additive genetic relationship matrix between sires. Independent inverse Wishart priors were assigned to both H0 and G0, and the chosen hyper-parameter values were as in Chang et al. (Reference Chang, Gianola, Heringstad and Klemetsdal2002). Furthermore, each of the diagonal elements of G0 was bounded between 0 and 1/3, implying that the prior density of heritability is also bounded as 0 < h 2 < 1. Finally, independent bounded uniform priors ![]() were assigned to the residual correlations in matrix R0.
were assigned to the residual correlations in matrix R0.
The fully conditional posterior distributions needed for Gibbs sampling can be derived from the joint posterior density, after augmentation with the liabilities (Sorensen et al., Reference Sorensen, Andersen, Gianola and Korsgaard1995). However, the fully conditional posterior distribution of R0 does not have a recognisable form, since all residual variances are equal to one. A random walk Metropolis algorithm was employed to sample residual correlations from their posterior distributions, as described in Chang et al. (Reference Chang, Gianola, Heringstad and Klemetsdal2002).
Genetic correlations were calculated from the matrix G0 as
where ![]() is the genetic correlation between CSs at different opportunities. Similarly, heritability of liability to CS was calculated as
is the genetic correlation between CSs at different opportunities. Similarly, heritability of liability to CS was calculated as
where ![]() is the heritability of liability for CS at opportunity i, and gi,i and hi,i are the sire and herd variances, respectively.
is the heritability of liability for CS at opportunity i, and gi,i and hi,i are the sire and herd variances, respectively.
Convergence was assessed in experimental runs, using different starting values and different chain lengths (0.5, 1.5 and 3 million samples), and monitored by a visual inspection of trace plots. Subsequently, single chains of 3×10⁶ (univariate) and 5×10⁶ (bivariate and trivariate analyses) samples were run. A burn-in period of 1×10⁶ samples was used, without thinning.
Simulation
In order to investigate further the extent of uncertainty associated with the posterior estimates of the parameters, especially the genetic correlation between CS2 and CS3, a simulation was carried out. One hundred data sets were generated randomly with a bivariate model resembling the numbers and structure of the data for CS2 and CS3 and using the posterior estimates from the real data set, with the exception of the genetic correlation, as true parameters. As in the observed data, CS2 and CS3 were 57% and 72%, respectively; there were 26 year effects, 25 herds and 400 sires. For simplicity, sires were assumed unrelated. Scenarios investigated corresponded to true genetic correlations of −0.4, −0.2, +0.2 and +0.4, to span over a reasonable range of alternative values.
Results and discussion
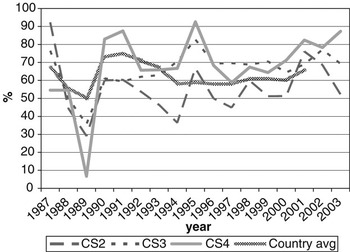
CS at calving opportunities 2, 3 and 4 was denoted as CS2, CS3 and CS4, respectively. Average calving rate was 66.3% overall, and 56.8%, 72.3% and 75.3% for CS2, CS3 and CS4, respectively. Figure 1 shows variation in calving rates over years of calving, with the national average (MGAP-DIEA, 2003) presented as a benchmark. Lower values are usually expected at the second calving, due to the cow’s difficulty in meeting nutritional requirements and storing body reserves that are adequate for subsequent reproduction after a first calving. These cows are still growing and experiment greater nutritional stress during lactation than fully mature cows.
Change of calving success on the second, third and fourth calving opportunities (CS2, CS3 and CS4, respectively) over year of calving (period 1987-2003), with the national average as a benchmark.
Sire and herd variances for liability of CS at second, third and fourth calving opportunities are presented in Table 2 (bivariate analyses not shown). Plots of posterior distributions seemed approximately symmetric. In the light of the range spanned by credibility intervals, the sire variance did not differ much between calving opportunities, and ranged from 0.08 to 0.11 (trivariate estimates). Rust and Groeneveld (Reference Rust and Groeneveld2002) reported an estimate of 0.07, close to ours.
Posterior distribution means, standard deviation (s.d.) and quantiles for sire and herd variances of liability to calving success at the second, third and fourth calving opportunities (CS2, CS3 and CS4)
Sire variances may be inflated by extreme category problems (ECP). This was detected when analysing CS3, where a few sires with progeny groups larger than 10 daughters, all calving, were found influential. ECPs can arise due to incomplete recording of the AI data, or because only successful calvings are reported in some herds, producing confounding effects between sire and management. Multivariate analysis attenuated this effect.
The between-herds variance seemed to be higher in CS2 (twice as large as the sire variance), which was expected. Large differences between herds in nutrition and management, in use of AI, in completeness of calving reporting, or in accuracy of reporting management groups, are expected. In pasture systems, a critical physiological event is rebreeding after a first successful calving, under varying amounts of feed supply, while the cow is still lactating and growing. Information on physiological status at rebreeding, e.g. lactating or dry, was lacking, and this is critical for a correct definition of contemporary groups. For CS3 and CS4, the between-herd variance was somewhat larger than the sire variance. Here, ECP problems were minor.
In spite of the limitations posed by the data set available, there was evidence of genetic variability in CS, with a 99% posterior probability of heritability being larger than 0.08, 0.07 and 0.05 (percentile 1 of the distribution in trivariate analyses, see Table 3) for CS2, CS3 and CS4, respectively. CS appears to be moderately heritable, as posterior means ranged from 0.27 to 0.35, although credibility intervals indicate imprecise inferences. Heritability estimates of calving success or related traits obtained with threshold models range from 0.03 (Donoghue et al., Reference Donoghue, Rekaya, Bertrand and Misztal2004d) to 0.25–0.27 (Silva et al., 2002; Rust and Groeneveld, Reference Rust and Groeneveld2002). Phocas et al. (2002), also using sire models, reported values between 0.07 and 0.16, with large standard errors.
Posterior mean, standard deviation (s.d.) and quantiles for heritability of liability to calving success in the second, third and fourth calving opportunities (CS2, CS3 and CS4)
Our study shared similarities with the South African situation reported by Rust and Groeneveld (Reference Rust and Groeneveld2002), e.g. no records of reproductive abilities available, except those that could be deduced from birth dates. These authors used standard Gaussian linear animal models on the observed scale, and a sire model on the liability scale, under a frequentist approach. They obtained very low estimates of heritability with linear procedures, but an overall value of 0.27 with the sire threshold model, using a selected data set with nearly 4000 records from 192 well-proven sires (more than four herds and 75 offsprings per sire). This indicated the existence of genetic variability for calving success.
The study of Donoghue et al. (Reference Donoghue, Rekaya, Bertrand and Misztal2004d) differed markedly from ours in terms of the model (a service sire effect was used) and the amount and quality of data. These authors found that the service sire variance was more than three times larger than the animal variance, producing one of the smallest heritability estimates reported in the literature. This result might be partly due to confounding between service sire and mating management effects.
In a selection experiment assessing change in reproductive traits in Angus cattle, Morris et al. (Reference Morris, Wilson, Bennett, Cullen, Hickey and Hunter2000) found that heritability of pregnancy rate was 0.04 for cows, 0.08 for 2-year olds and 0.12 for yearlings. Johnston and Bunter (Reference Johnston and Bunter1996) analysed calving success without adjustment for the categorical nature of the trait, and reported a heritability estimate of 0.11. This is higher than the estimate presented by Meyer et al. (Reference Meyer, Hammond, Parnell, Mackinnon and Sivarajasingam1990) in Angus (0.015). The latter authors found heritabilities of about 0.08 in both Hereford and zebu crosses. Buddenberg et al. (Reference Buddenberg, Brown and Brown1990) reported a heritability estimate of 0.17 for pregnancy rate in Angus heifers, with a wide range in other breeds.
Phocas and Sapa (Reference Phocas and Sapa2004) investigated female fertility in heifers from French progeny testing programmes. Fertility was defined as calving success (0 or 1) after a fixed insemination period. However, the discrete nature of the trait was ignored. Heritability (standard error) of calving success was low, with estimated values of 0.02 (0.02), 0.00 and 0.08 (0.04) for Charolais, Limousin and Blonde d’Aquitaine heifers, respectively. Evans et al. (Reference Evans, Golden, Bourdon and Long1999) defined heifer pregnancy as the observation that a heifer conceives and remains pregnant to palpation, given exposure at breeding. Using 986 Hereford heifers, they obtained a heritability estimate of 0.14 with a standard error of 0.09. In a larger data set, Eler et al. (Reference Eler, Silva, de, Evans, Ferraz, Dias and Golden2004) used a categorical animal model and method ![]() to obtain heritability estimates (standard error) of 0.61 (0.10) and 0.68 (0.09) for heifer pregnancy. These estimates are unusually large, and may reflect the pitfalls of using an animal threshold model jointly with a heuristic approach to estimation.
to obtain heritability estimates (standard error) of 0.61 (0.10) and 0.68 (0.09) for heifer pregnancy. These estimates are unusually large, and may reflect the pitfalls of using an animal threshold model jointly with a heuristic approach to estimation.
In conclusion, estimates of heritability in our study are higher than in the literature, and this may reflect differences in populations, analytical procedures, trait definition or data structure. Trivariate analyses, using all available information, tended to produce lower estimates than univariate analyses.
Genetic, herd and residual correlations are presented in Table 4 (only results from trivariate analyses are shown). Herd correlation was positive between CS2 and CS3; other correlations included zero within the credibility interval, but estimated mean and median values were positive as well. This could be interpreted as levels of herd management tending to be maintained over parities. The residual correlation between CS2 and CS3 was negative. Other residual correlations were not different from zero.
Posterior means, standard deviation (s.d.) and quantiles (Q) for genetic (rg), herd (rh) and residual (re) correlations between liabilities of calving success at second, third and fourth calving opportunities (CS2, CS3 and CS4)
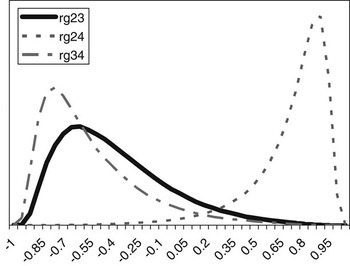
The posterior distributions of the genetic correlations were skewed (Figure 2). Genetic correlation between CS2 and CS4 was positive (at 90% probability) and high. Posterior mean and median of genetic correlations involving CS3 were negative, with the value of zero included within the credibility interval. There may be a negative genetic relationship between adjacent calving opportunities. Low genetic correlations suggest that different genes may be acting in each case. Repeatability models (e.g. Mercadante et al., Reference Mercadante, Packer, Razook, Cyrillo and Figueiredo2003) assume a genetic correlation of one among calving opportunities, but our results do not support a repeated measures model. Uncertainty in all correlations was large, however.
Posterior distributions of the genetic correlations between calving success at second and third (rg23), second and fourth (rg24) and third and fourth (rg34) calving opportunities.
To investigate further the extent of uncertainty associated with the posterior estimates of the parameters, especially the genetic correlations, a simple simulation was carried out. Using two traits (CS2 and CS3), the consequences of assuming different values for the true genetic correlation between them were illustrated.
Estimates of sire and herd variances, and of herd and residual covariances were, on average, reasonably close to the true values under all scenarios, and so are not presented or discussed. Table 5 shows features (median, 5–95 quantiles and 90% range) of the empirical distribution obtained from the 100 estimates of the genetic correlation between CS2 and CS3. These replicates are drawn from the unknown frequentist distribution of the Bayesian posterior mean estimator. In all cases, the 90% empirical confidence region was very wide, indicating imprecise inference. Thus, a sizeable proportion (0.04 to 0.38) of the replicates produced estimates of genetic correlation having a sign that was opposite to that of the true value. This confirms that the genetic correlation is a difficult parameter to infer, and particularly so when estimated on an underlying scale.
Median, quantiles (Q) and range 90% for the distribution of 100 mean estimates of the genetic correlation between the second and third calving opportunities (CS2 and CS3), under four scenarios with different true genetic correlations
†% wrong sign: proportion of opposite sign to that of the true value.
A second approach was used to illustrate the uncertainty (due to the data structure) associated with the genetic correlation estimates. It consisted of modifying the degrees of belief parameters of the inverse Wishart priors for the sire covariance matrix, with increasing values (10, 50, 100 and 100), meaning that a higher weight is assigned to the prior values. Assigning zero correlation in the prior distribution of sire (co)variance and different degrees of belief, a single MCMC chain with 5 million samples was run. Burn-in consisted of 2 million iterations. The 3 million samples from the posterior distribution were subsampled every 100 steps, so that 30 000 draws were used to compute the posterior mean estimate of the genetic correlation. Results are shown in Table 6. Clearly, as more weight was given to the prior, correlations tended to zero and uncertainty decreased. This is interpreted as strong evidence that the data contained a limited amount of information for inferring genetic correlations, as posterior inference is sensitive with respect to the prior.
Changes in posterior means, standard deviation (s.d.) and quantiles (Q) with varying degrees of belief parameters (10, 50, 100 or 1000) of the Inverse Wishart priors for the sire covariance matrix

Estimates of correlations for CS have not been published before. Negative phenotypic correlations between adjacent calvings were reported under low input systems (e.g. Morris, Reference Morris1980) but how much of that is due to a genetic component is unclear. The simulation and the different weightings given to priors (Tables 5 and 6) support the view that the estimate of genetic correlation obtained from the Uruguayan data is not a methodological or structural artifact. Rather, it is an estimate associated with a large uncertainty produced by the limited amount of data. Furthermore, the posterior probability of positive values of the genetic correlation estimated from real data was relatively high.
Areas of future improvements could include new alternatives to the genetic model used in this study; the current model eventually did not completely disentangle environmental and genetic effects, due to a sparse additive relationship matrix with only sires and maternal grandsires. Also, cows assumed empty may be misclassified and this could inflate (co)variances, as suggested by Spangler et al. (Reference Spangler, Sapp, Rekaya and Bertrand2006). With the present recording scheme it is not possible to check the relevance of such misclassification. Therefore, more research based on improved data quality is needed. Our findings reinforce the need to strengthen the Uruguayan database and illustrate the power of the Bayesian approach for describing uncertainty.
Conclusions
More appropriate statistical techniques make possible the attaining of a better description of genetic variation for reproductive traits. Besides being moderately heritable, calving success is simple, inexpensive and easy to record. Estimates of genetic correlations were, however, associated with large uncertainty. One of the limitations found in this study is the difficulty to define overall fertility, since success at a given parity seems to decrease the chances of success in the subsequent parity.
At present, CS is not an immediately available option for genetic evaluation of reproduction in beef cattle under circumstances like those exemplified with the Uruguayan Angus data. This could change if recording becomes more accurate and genetic models are improved. The quality of data could be improved in the Angus recording scheme, by recording joining dates, service bulls, pregnancy status of heifers and cows, entry and exit dates, type of service management used (AI or natural service) and final outcome of the breeding season, even if no calf results from the service. Capturing additional genetic variation using a continuous and genetically correlated indicator trait such as calving day should also be desirable. If these changes were adopted, breeders will have tools to effect direct selection on economically important female reproduction traits.
Acknowledgements
This research was made possible by dedicated Aberdeen Angus breeders who collected data and allowed its use. This work was carried out during Jorge I. Urioste’s stay at the Department of Animal Sciences, University of Wisconsin-Madison, from August to October 2005, as a part of a sabbatical leave. Support by the Wisconsin Agriculture Experiment Station and grants NSF DEB-0089742 and NSF DMS-NSF DMS-044371 is acknowledged. Useful comments of Dr Agustin Blasco and two anonymous reviewers on an earlier draft are greatly appreciated.


