

Like wheat, rice (Oryza sativa L.) is a type of grain eaten worldwide( 1 ). Especially in Southeast Asia and East Asia, rice is a staple food and an important source of dietary carbohydrates. In Japan, a culture of eating cooked rice as-is, represented by GOHAN (cooked rice), ONIGIRI (rice ball) and DONBURI (rice bowl dishes), is well established. Rice is one of the daily essentials in Japanese life style (compared with other nations). Therefore, huge efforts have been invested into cultivar improvements to enhance the flavour and yieldability of Japonica rice (O. sativa L. ssp. Japonica) cultivars with methods such as cross-breeding and differential induction by nitrosomethylurea( Reference Satoh and Omura 2 ). As a result, over 500 rice cultivars are registered in the Ministry of Agriculture, Forestry, and Fisheries of Japan. These rice cultivars present various characteristics such as a resistance to high temperature, a better harvest and a more gigantic endosperm( Reference Wada, Tsubone and Inoue 3 – Reference Maeda, Nemoto and Iida 5 ). Although rice consumption is decreasing in Japan, especially in young people, because of the diversification of dietary life associated with Western wheat-based diet such as breads and pasta( Reference Melby and Takeda 6 , Reference Adachi 7 ), rice is still an important carbohydrate source in Japan. In addition, global demand of rice is considered to rise because of its beneficial functionalities for health and the cultural importance of Japanese traditional meals( Reference Hamajima, Matsunaga and Fujikawa 8 , Reference Funatsu, Kondoh and Kawase 9 ). However, it was reported that high-frequency consumption of rice could result in higher risk of type 2 diabetes (T2D), a glucose metabolism disorder increasingly prevalent in Asian countries( Reference Golozar, Khalili and Etemadi 10 , Reference Saneei, Larijani and Esmaillzadeh 11 ). This concern regarding the health impact prevents people from consuming rice. There is a trend towards low-carbohydrate diet to avoid consuming rice( Reference Foster, Wyatt and Hill 12 – Reference Hickey, Hickey and Yancy 14 ). However, advantages and disadvantages of rice for health maintenance are still under debate( Reference Eshak, Iso and Date 15 ).
Besides morphological phenotypes as described above, rice has a quantitative and qualitative diversity of nutrient components (carbohydrate and proteins) in endosperms( Reference Mizuno, Fukumori and Liu 16 – Reference Jeng, Ho and Shih 18 ). Differences in nutrient components in rice endosperm are utilised for the treatment of metabolic diseases. For instance, a cultivar of rice, ‘LGC-Jun’, is used as functional rice for patient with nephropathy, a protein metabolism disorder( Reference Nishimura, Kusaba and Miyahara 19 ). Because the rice ‘LGC-Jun’ lacks easily digestible proteins (glutelin and globulin) in its endosperm, it is less burdensome in diets for patients with renal disease( Reference Nishimura, Kusaba and Miyahara 19 ). Like this instance of ‘LGC-Jun’, various functionalities are being added to rice lines( Reference Mizuno, Fukumori and Liu 16 , Reference Mizuno, Fukumori and Liu 17 , Reference Ogo, Wakasa and Hirano 20 ). The aim of this study was to screen and evaluate a functional rice line for diabetes. We focused postprandial blood glucose levels as a target in this study. The postprandial blood glucose level is an important factor for the development of T2D, even though increase in blood glucose levels just after diet (a postprandial blood glucose spike) was reported as one of risk factors of T2D and other diseases( Reference Ceriello, Esposito and Piconi 21 , Reference Bonora and Muggeo 22 ). Furthermore, postprandial glucose level is strongly affected by dietary components. For instance, the higher resistant starch (RS) lowers postprandial blood glucose level( Reference Brites, Trigo and Carrapiço 23 , Reference Klosterbuer, Thomas and Slavin 24 ). Our group previously reported that a rice mutant line with starch branching enzyme IIb-deficiency showed high RS contents when it was boiled( Reference Tsuiki, Fujisawa and Itoh 25 ). However, how differences in dietary grains, especially rice, impact on postprandial blood glucose levels remains unknown. To evaluate the effects of rice grains on postprandial blood glucose levels, we conducted oral administration tests using rats and then screened antidiabetic rice lines based on cluster analysis with the result of oral administration tests. Furthermore, we fed one of the mutant rice lines categorised as ‘antidiabetic’, #4019 (starch synthase IIIa (ss3a)/branching enzyme IIb (be2b)), to Goto-Kakizaki (GK) rats, a model rat of T2D( Reference Goto, Kakizaki and Masaki 26 ). In addition, we investigated the antidiabetic effect of #4019 in vivo and in vitro.
Methods
Materials
Rice test samples were provided by Professor N. F. (Akita Prefectural University), Professor T. K. (Kyushu University), and from KAMEDA SEIKA CO., LTD. A rice cultivar ‘Nipponbare’ was used as the control cultivar because its genome is already sequenced( 27 ). ‘Nipponbare’, powdered samples were made from either polished rice or brown rice. Powdered samples of the other rice lines were made from their polished rice endosperms. The characteristics of rice samples, especially mutant rice lines, are shown in Table 1. Hard wheat flour, soft wheat flour, barley flour and durum wheat flour were provided by the Torigoe Co. Ltd. Powder of β-maize starch was purchased from KYUDO Co., LTD. Acarbose (BAY g 5421, O-4, 6-dideoxy-4-(((1S, 4R, 5S, 6S)-4, 5, 6-trihydroxy-3-(hydroxymethyl)-2-cyclohexene-1-yl) amino)-α-d-glucopyranosyl-(1→4)-O-α-d-glucopyranosyl-(1→4)-d-glucopyranose) was used as a positive control in Oral cereal powder tolerance test and provided as a tablet, Glucobay 100TM (containing 740 mg Acarbose/g tablet) by Bayer Yakuhin, Ltd.
Characteristics of test mutant rice lines
ss3a, starch synthase IIIa; ss4b, starch synthase IVb; be1, branching enzyme I; be2a, branching enzyme IIa; be2b, branching enzyme IIb; ss1, starch synthase I (ssI L is ssI leaky mutant); wx, waxy (also known as gbss1, granule-bound starch synthase I).
Animals
Male Sprague–Dawley (SD) rats (Kud:SD), 4 weeks old, for oral cereal powder tolerance test were purchased from KYUDO Co., LTD. Male GK rats, 5 weeks old, were purchased from Japan SLC, Inc.. Rats had free access to a commercial non-purified diet (NMF; Oriental Yeast Co.) and deionised water and were maintained in a temperature-controlled room at 22–25°C with a 12-h light cycle (08.00–20.00 hours). All animal experiments were conducted according to the Guidelines for Animal Experiments Kyushu University and the law (no. 105) and notification (no. 6) of the government of Japan. The animal protocol was approved by the review committee of Kyushu University (authorisation no.: A26-098-3).
Oral cereal powder tolerance test
Oral cereal powder tolerance test was performed with SD rats (male, between 5 and 7 weeks old). To obtain stable results and to reduce the number of rats used, we used rats repeatedly (once a week, for 3 weeks). For the test with thirty-three samples, a total of fifty-five SD rats (five rats/sample, for three tests/rat) were used in this study. Each cereal powder (2·0 g/kg body weight (b.w.) suspended in 1·5 ml of ultrapure water) was loaded to SD rats fasted 16 h with syringes attached to 4 Fr catheters (syringe; Terumo Corporation and catheter; Atom Medical Company). As a positive control, acarbose (1·43 mg/kg b.w.) as powdered Glucobay 100TM was administered with 2·0 g/kg b.w. of Nipponbare sample. Blood glucose levels were measured with a glucometer (Accu-Chek® Aviva Nano Blood Glucose Meter System; Roche) until 300 min after loading. After tests, incremental areas under the time-concentration curve (iAUC) between 0 and 300 min (iAUC0–300 min), iAUC between 0 and 30 min (iAUC0–30 min, as an index for glucose absorption), and iAUC between 30 and 90 min (iAUC30–90 min, as an index for blood glucose clearance) were calculated with measured blood glucose levels.
Experimental feeding of mutant rice #4019 to Goto-Kakizaki rats
GK rats were fed a non-purified diet and deionised water for a week and then divided into two groups based on body weight, fasting blood glucose level, and food intake. Rats were fed experimental diet (n 7) or control diet (n 7) during a limited period (17.00–09.00 hours) for 5 weeks. Diet compositions are presented in Table 2. Food and water intakes were measured once a day, every 2 d, respectively. Rats were euthanized by decapitation after 12 h fasting at the end of the experiment. Blood was collected into tubes and kept in ice after standing at room temperature for 30 min. For plasma preparation, 1 ml of blood was mixed with 50 µl of heparin (Mochida Pharmaceutical Co., Ltd) and 20 µl of DPP-4 inhibitor (EMD Millipore) and then kept on ice. Each blood sample was centrifuged at 1500 g , 4°C for 15 min to separate serum and plasma, respectively. Organs (the liver, pancreas, white adipose tissues (WAT) and a part of the abdominal muscle) were excised, weighted, and then immediately frozen in liquid N2. Mesenteric, perirenal, retroperitoneal, epididymal and subcutaneous WAT were excised. The samples (serum, plasma and organs) were kept at −30°C until analysis.
Diet composition for #4019 feeding test using Goto-Kakizaki rats
Measurement of biochemical parameters in serum and plasma
Serum levels of TAG, total cholesterol, NEFA and glucose were measured by using commercial enzyme assay kits (Cholesterol C-Test, Triglyceride E-Test, NEFA C-Test, Glucose CII-Test; Wako Pure Chemical Industries). Plasma β-hydroxybutyrate levels were determined with EnzyChromTM Ketone Body Assay Kit (Bioassay Systems). Serum and plasma diabetic parameters were measured with ELISA kits (Rat Insulin ELISA KIT (TMB), Rat C-peptide (U-type) ELISA KIT; Shibayagi; rat Glucagon ELISA kit, rat glucagon-like peptide-1 (GLP-1) ELISA kit, Amylase test; Wako Pure Chemical Industries).
Measurement of hepatic TAG levels
Hepatic lipids were extracted by using the method described by Folch et al.( Reference Folch, Lees and Sloane Stanley 35 ). TAG contents in extracted lipids were measured with the modified method using Triglyceride E-Test as described below. In brief, 0·5 ml of lipid extracts were dried with N2 gas and then suspended in 20 µl of 1:1 mixture solution of Triton X-100 and methanol. After evaporation of the methanol with N2 gas in sample solutions, 200 µl of deionised water and 1·5 ml of colouring reagent were added. Solutions were incubated at 37°C for 5 min. Absorbance values at 600 nm were measured with an UV-VIS spectrophotometer (UV-1600; Shimadzu Corporation).
Evaluation of the effect of #4019 on insulin secretion using rat pancreas cells
SD rats (n 4/diet) were trained to consume the basal diet twice/d between 10.00 and 11.00 and 16.00 and 17.00 hours for 2 d. After morning feeding on the 3rd day, the rats were anaesthetised with Somnopentyl® (Kyoritsu Seiyaku Corporation) before blood sampling. At 11.30 hours on the 3rd day, blood samples were obtained from the aorta. Serum samples were separated from obtained blood samples by centrifugation (1500 g , 4°C, 5 min×2 times) and inactivated by incubation at 67°C, for 15 min. The rat pancreas BRIN-BG7 cells (ECACC 10020902) were purchased from DS Pharma Biomedical Co., Ltd( Reference Clarke, McClenaghan and Barnett 36 , Reference McClenaghan, Barnett and O’Harte 37 ) and cultured with RPMI-1640 medium (Thermo Fisher Scientific) containing 5 % (v/v) fetal bovine serum (FBS) and 5 % rat serum as described above. For maintenance, we used RPMI-1640 medium containing 10 % FBS, not containing rat serum. After 24 h, cells were incubated with low glucose Krebs buffer (1·1 mmol/l glucose) for exactly 40 min and then incubated with high-glucose Krebs buffer (16·7 mmol/l glucose) for exactly 20 min( Reference Moran, Abdel-Wahab and Flatt 38 ). After incubation, Krebs buffer and cells were collected. C-peptide concentrations in condensed collected buffer were measured with an ELISA kit. Total RNA was obtained from collected cells and expression levels of genes related to insulin secretion were measured by using real-time RT-PCR system (Mx3000P; Agilent Technologies Japan, Ltd) with a SYBR Premix EX Taq II kit (Takara Bio Inc.). The mRNA levels were normalised by using the β-actin (Actb) gene (for hepatic genes) and the cyclophilin A (Cypa) gene (for pancreatic genes) as internal standards. Primer sequences for the analysis are shown in Table 3.
Primers for real-time RT-PCR
Analysis of water-soluble metabolites in rat serum (non-target metabolome analysis)
Water-soluble metabolites in rat serum were analysed following the protocol described by Tsugawa et al. ( Reference Tsugawa, Bamba and Shinohara 39 ) with some modifications as described below.
Rat serum (50 μl), Mix solvent (MeOH–ultrapure water–CHCl3=5:2:2) (250 μl) and 0·5 mg/ml 2-isopropylmalic acid (10 μl) were mixed in a 1·5-ml microtube. The mixture was shaken with a shaking apparatus at 37°C, 75/min for 30 min. After a centrifugation (16 000 g , 4°C, 3 min), 220 μl of supernatant was collected to a new microtube and mixed with 200 μl of ultrapure water. After another centrifugation (16 000 g , 4°C, 3 min), 250 μl of supernatant was collected to a new microtube as analysis sample. For the preparation of quality control (QC) samples, 50 μl from each analysis sample were mixed and dispensed to new tubes (200 μl/tube). Analysis samples and QC samples were condensed with a centrifugal thickener (CC-105; Tomy Seiko Co., Ltd) at room temperature until the solvent was evaporated.
Condensed samples were mixed with (or dissolved in) 80 μl of 20 mg/ml methoxyamine hydrochloride (in anhydrous pyridine) and sonicated on ice-cold water bath for 20 min with an ultrasonic cleaner (BRANSON® 5210 ultrasonic cleaner, Branson Ultrasonics; Emerson Japan, Ltd). The mixture was well vortexed and shaken with a shaking apparatus at 30°C, 75/min for 90 min. N-methyl-N-trimethylsilyl-trifluoroacetamide (30 μl) was added to the mixture. The mixture was shaken with a shaking apparatus at 37°C, 75/min for 30 min. After centrifugation (16 000 g , 25°C, 5 min), 80 μl of supernatant was collected to 100 μl-spitz attached to a 1·5-ml vial and then sealed with a septum and a screw cap.
Derivatised samples were analysed with GC-MS (Shimadzu GCMS-QP2020 coupled with a InertCap 5MS/NP-VS2 column, 30 m×0·25 mm, 0·25 µm thickness; GL Sciences). The following temperature programme was applied with helium (high-purity 99·9999 %) as a carrier gas at a flow rate of 1·12 ml/min: 80°C for 2 min; from 80 to 330°C at 15°C/min; 330°C for 6 min. The total run time was 25 min (scanned from 3·5 to 24 min). The injector, the interface, and the ion source were kept at 230, 250 and 200°C, respectively. The mass spectrometer was operated in the electron impact mode (70 eV).
The obtained MS data (qgd-format) were converted to the NetCDF format. With a MetAlign software (free software obtained from the web page of Wageningen University and Research; http://www.wur.nl/nl/show/MetAlign.htm), the peak detection and alignment were performed. The results were saved as a CSV format file. Peak identification and prediction were performed with an AIoutput software (free software obtained from the web page of Riken; http://prime.psc.riken.jp/Metabolomics_Software/). The library file used in peak identification was also downloaded from the web page of RIKEN.
Statistical analysis
All results are shown as means with their standard errors. All data (Tables 4–7, Fig. 2 and 3) were analysed with the χ 2 goodness-of-fit test as a normality test with Excel 2010 (Microsoft) and the add-in software Statcel 3. When the data were recognised as ‘non-normal distribution’, the data were normalised by logarithmic transformation for further statistical analysis. For comparisons with logarithmic transformation, each geometric mean is shown in Tables 4–7 and Fig. 2(d) and (e). Each median and 95 % CI is shown in each legend (Tables 4–7 and Fig. 2). Data of iAUC0–300 min were analysed through inspection of differences among rice samples using the Dunnett’s test with Excel 2010 and Statcel 3 (Table 4 and Fig. 1(a)). Data of iAUC0–300 min obtained from other grains and purified carbohydrates were considered as reference data (Table 4). Data in the feeding experiment and in vitro experiment were analysed with Student’s t test (Tables 5–7, Fig. 2 and 3) with Excel 2010. Differences were considered significant when P was <0·05. Test cereals were categorised by cluster analysis with data of iAUC0–30 min and iAUC30–90 min. Cluster analysis was performed with free software ‘R’ for statistical analysis (http://cran.r-project.org/) (Fig. 1b).
Cluster analysis dividing samples into five groups. (a) Five clusters on incremental area under time-concentration curve (iAUC) plot. On the iAUC plot, each point means each average of samples (n 5/group) on oral cereal powder tolerance test. Circles on the plot represent clusters as a result of cluster analysis. The numbers on (a) and (b) are obverse. On the plot, different types of symbols represent the difference in sample types (● rice samples, ∆ grain samples other than rice, ◊ purified carbohydrate samples, ■ control rice with acarbose). (b) Dendrogram representing the cluster analysis. b.w., body weight.

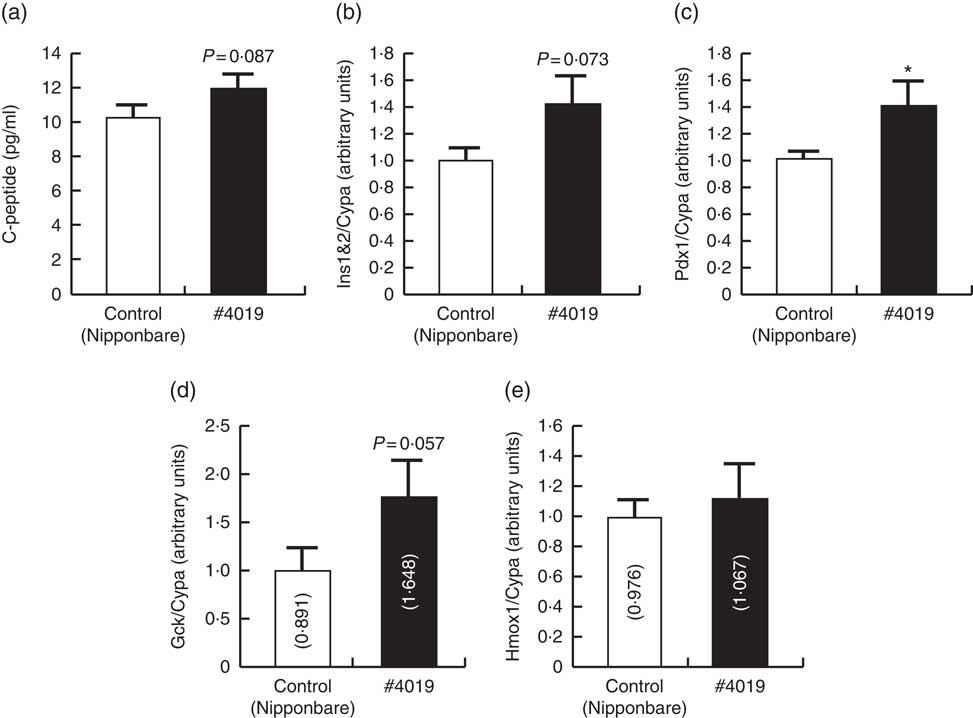
Serum from Sprague–Dawley rats being fed #4019 (ss3a/be2b) diet promoted insulin secretion from rat pancreatic cell by promoting Pdx1 expression. (a) C-peptide levels in high-glucose test buffer, (b–e) cellular mRNA levels of genes related to the regulation of insulin secretion. Values are means (n 6/group), with their standard errors represented by vertical bars. As results of normality test, parameters with non-normal distribution were normalised by logarithmic transformation before statistical analysis with Student’s t test. The values in bars in (d) and (e) are geometric means. Medians of parameters with non-normal distribution are as follows: Gck (control), 0·894 (95 % CI 0·456, 1·332); (#4019), 1·452 (95 % CI 0·733, 2·172); Hmox1 (control), 0·853 (95 % CI 0·650, 1·055); (#4019), 0·966 (95 % CI 0·560, 1·372). * Significant difference at P<0·05 analysed with Student’s t test.
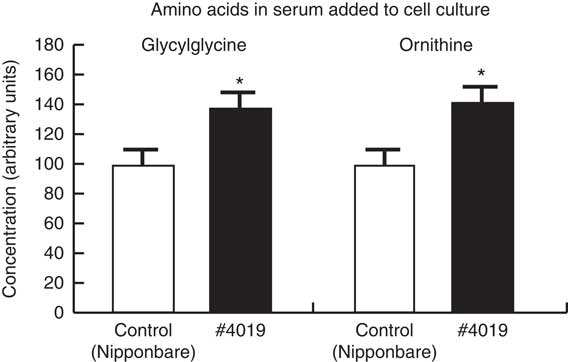
The ingestion of #4019 (ss3a/be2b) diet increased glycylglycine and ornithine concentration in the rat serum. Values are means (n 4/group), with their standard errors represented by vertical bars. The values of control groups were set to 100. * Significant difference at P<0·05 analysed with Student’s t test.
List of the incremental area under time-concentration curves (iAUC) obtained from the oral cereal powder tolerance test† (Mean values with their standard errors, geometric means; n 5/group)
b.w., Body weight.
* Compared Nipponbare (control rice cultivar) with Dunnett’s test (P<0·05).
† Medians of rice samples are as follows: Nipponbare (control rice), 49·7 min×mg/ml (95% CI 28·8, 70·7); brown rice of Nipponbare, 18·2 min×mg/ml (95% CI 9·7, 26·6); IR64 (indica rice), 78·9 min×mg/ml (95% CI 72·6, 85·2); Hinohikari, 43·7 min×mg/ml (95% CI 38·5, 48·8); Yumetoiro, 48·3 min×mg/ml (95% CI 38·0, 58·6); Akitakomachi, 43·5 min×mg/ml (95% CI 30·8, 56·2); Eminokizuna, 51·2 min×mg/ml (95% CI 34·1, 68·4); Mizuhonokagayaki, 41·4 min×mg/ml (95% CI 33·1, 49·6); Koshi-ibuki, 16·1 min×mg/ml (95% CI 7·3, 25·0); e1, 28·8 min×mg/ml (95% CI 24·7, 32·9); #2012, 53·2 min×mg/ml (95% CI 45·4, 60·9); #4012, 33·4 min×mg/ml (95% CI 11·4, 55·3); #4015, 19·7 min×mg/ml (95% CI 14·1, 25·4); #4017, 62·3 min×mg/ml (95% CI 52·3, 72·2); #4019, 25·8 min×mg/ml (95% CI 18·3, 33·3); #6002, 54·2 min×mg/ml (95% CI 32·0, 76·5); EM10, 29·1 min×mg/ml (95% CI 25·4, 32·8); EM21, 63·7 min×mg/ml (95% CI 50·2, 77·2); LGC1, 51·9 min×mg/ml (95% CI 45·9, 57·9); LGC-Jun, 44·6 min×mg/ml (95% CI 35·0, 54·3).
Growth parameters of Goto-Kakizaki rats fed experimental diet for 5 weeksFootnote † (Mean values with their standard errors, geometric means; n 7/group)
WAT, white adipose tissue.
* Significant difference at P<0·05 analysed with Student’s t test.
† As results of normality test, parameters with non-normal distribution were normalised by logarithmic transformation before statistical analysis with Student’s t test. Medians of parameters with non-normal distribution are as follows: liver weight (control), 10·4 g (95 % CI 10·1, 10·7); (#4019), 10·7 g (95 % CI 10·2, 11·2); pancreas weight (control), 0·969 g (95 % CI 0·877, 1·061); (#4019), 1·064 g (95 % CI 0·997, 1·131); perirenal WAT (control), 0·990 g (95 % CI 0·883, 1·097); (#4019), 1·110 g (95 % CI 0·995, 1·225).
Biochemical parameters of Goto-Kakizaki rats fed #4019Footnote † (Mean values with their standard errors, geometric means; n 7/group)
* Significant difference at P<0·05 analysed with Student’s t test.
† As results of normality test, parameters with non-normal distribution were normalised by logarithmic transformation before statistical analysis with Student’s t test. Medians of parameters with non-normal distribution are as follows: serum TAG (control), 1·32 mg/ml (95% CI 1·04, 1·43); (#4019), 1·37 mg/ml (95% CI 1·03, 1·70); plasma β-hydroxybutyrate (control), 0·830 mm (95 % CI 0·726, 0·934); (#4019), 0·616 mm (95 % CI 0·466, 0·765); plasma insulin (control), 4·66 ng/ml (95 % CI 3·72, 5·60); (#4019), 4·69 ng/ml (95 % CI 3·88, 5·51); plasma glucagon-like peptide-1 (control), 9·23 ng/ml (95 % CI 1·53, 16·92); (#4019), 8·72 ng/ml (95 % CI 6·58, 10·87); plasma glucagon (control), 173 pg/ml (95 % CI 55, 291); (#4019), 161 pg/ml (95 % CI 139, 184); liver glycogen (control), 17·6 mg/g tissue (95 % CI 15·9, 19·3); (#4019), 28·0 mg/g tissue (95 % CI 23·0, 32·9).
Gene expression levels in tissues of Goto-Kakizaki rats fed #4019Footnote † (Mean values with their standard errors, geometric means; n 7/group)
ND, not detected.
* Significant difference at P<0·05 analysed with Student’s t test.
† As results of normality test, parameters with non-normal distribution were normalised by logarithmic transformation before statistical analysis with Student’s t test. Medians of parameters with non-normal distribution are as follows: liver Fasn (control), 0·662 (95 % CI 0·133, 1·191); (#4019), 1·471 (95 % CI 0·196, 2·745); liver active Xbp1 (control), 0·666 (95 % CI 0·088, 1·244); (#4019), 0·992 (95 % CI 0·605, 1·378); pancreas Hmox1 (control), 1·064 (95 % CI 0·855, 1·273); (#4019), 1·671 (95 % CI −0·124, 3·467); pancreas Gpx1 (control), 0·911 (95 % CI 0·689, 1·134); (#4019), 0·978 (95 % CI 0·624, 1·332); pancreas Cat (control), 0·869 (95 % CI 0·570, 1·169); (#4019), 0·967 (95 % CI 0·770, 1·165).
Results
Comparison of incremental area under time-concentration curve between 0 and 300 min obtained with the oral cereal powder tolerance test
Table 4 summarises iAUC values obtained from thirty-three samples. Compared with the iAUC0–300 min of the control rice line (Nipponbare), those of five rice samples (brown rice of Nipponbare, Koshi-ibuki, #4015, #4019 and EM10) were significantly reduced.
Cluster analysis with incremental area under time-concentration curves between 0 and 30 min and 30 and 90 min obtained from the oral cereal powder tolerance test
As a result of cluster analysis, five clusters were formed (Fig. 1(a) and (b)). Based on the position of Nipponbare and characteristics of samples which belonged to each cluster, we defined each cluster as High-absorption cluster, Normal rice cluster, Antidiabetic cluster, Acarbose cluster and Low-dose glucose cluster, respectively. The antidiabetic cluster contained seven rice lines (#4015, #4019, brown rice of Nipponbare, e1, EM10, koshi-ibuki and mizuhonokagayaki), β-maize starch, durum wheat, rye and barley. Sucrose and 1·0 g/kg b.w. of glucose belonged to Low-dose glucose cluster. EM21, one so-called sticky rice, and 4·0 g/kg b.w. of glucose formed High-absorption cluster. Acarbose formed an independent cluster, the acarbose cluster, by itself.
Effects of the #4019 diet on growth parameters
Intake of #4019 diet did not affect body weight, food intake, water intake, and organ weight, except for perirenal WAT weight (Table 5). Perirenal WAT weight in the #4019 group significantly increased compared with that in the control group.
Effects of the #4019 diet on metabolic parameters
Under fasting conditions, there was no significant difference in serum levels of total cholesterol, TAG, plasma levels of β-hydroxybutyrate, glucose, insulin, GLP-1 and glucagon (Table 6). Liver TAG levels and abdominal muscular glycogen contents did not differ between the groups (Table 6). On the other hand, serum NEFA, plasma C-peptide levels and hepatic glycogen contents were significantly increased in the #4019 diet-fed rats (Table 6).
Effects of the #4019 diet on mRNA levels in the liver and pancreas of Goto-Kakizaki rats
There was no significant difference in mRNA levels of Fasn, Chop, active-Xbp1, Gpx1, Sod1 and Cat in the liver of GK rats fed #4019 diet (Table 7). In addition, pancreatic mRNA levels of Gcg, Cd36, Chop, active-Xbp1, Gpx1, Sod1 and Cat did not differ between the groups (Table 7). On the other hand, in the pancreas of GK rats fed #4019 diet, the expression of insulin genes (Ins1 and Ins2) was higher than that in rats fed control diet (Table 7). Expression levels of the transcriptional factor, Pdx1 and Gck, a Pdx1 target, also increased in the #4019 group (Table 7). In addition, #4019 diet significantly increased the expression levels of Hmox1, one reactive gene for oxidative stress, when compared with the control diet (Table 6).
Analysis of rat pancreatic cell line cultured in medium containing rat serum
C-peptide concentration in the test buffer tended to increase (P=0·087) after addition of serum from rats fed #4019 diet (Fig. 2). Ins and Gck mRNA levels tended to increase (P=0·073, 0·057, respectively) in BRIN-BG7 cells cultured in #4019 medium. As for GK rats, Pdx1 expression levels in the cells were significantly increased by addition of #4019 serum (Fig. 2). Unlike the feeding experiment with GK rats, Hmox1 mRNA levels were not affected by #4019 serum (Fig. 2).
Metabolome analysis of serum used for the in vitro study
Relative concentrations of ornithine and glycylglycine were significantly increased in #4019 serum compared with those in control serum (Fig. 3).
Discussion
Recent studies revealed the excessive consumption of carbohydrates, especially rice, is one of risk factors for T2D. However, the simple reduction of rice consumption is difficult because living on rice is not only one of meal types but also one of components of Japanese food culture. The aim of this study is the establishment of an antidiabetic rice cultivar lowering postprandial blood glucose level and the investigation of its mechanism. In this study, we directly compared rice powders of twenty lines, six grain powders and six purified carbohydrates containing three doses of glucose to determine their effects on postprandial blood glucose levels in rats and identified seven highly effective rice lines by cluster analysis. Among rice lines belonging to the antidiabetic cluster, we fed a mutant rice line #4019, which lacks enzymes involved in starch synthesis, to GK rats to evaluate the effects of long-term intake of #4019 on diabetes. Feeding experiment revealed that intake of #4019 promoted insulin secretion from the pancreas of GK rats via increasing pancreatic mRNA expression of Pdx1, a transcriptional factor for insulin genes (Tables 6 and 7). This phenomenon was also observed in the in vitro experiment with rat pancreatic cells (Fig. 2).
We screened seven rice lines, including four mutants screened as rice lines with small or moderate postprandial blood glucose levels (Fig. 1). Rice samples administered in this study were popular rice cultivars (commercially available in Japan) or mutant rice lines which lack genes involved in starch synthesis. Besides, Koshihikari, one of the most famous cultivars in Japan, was not administered because its genetic background is not homogenous. Among highly effective rice lines other than EM10, ss3a was commonly deficient. We previously reported that ss3a deficiency leads to high-amylose content in rice endosperm( Reference Fujita, Yoshida and Kondo 28 ). A starch structure in #4015 endosperm (A mutant rice with the strongest lowering effect; ss3a/branching enzyme IIa (be2a), sample 13) was predicted to be similar because the effect of be2a deficiency to rice endosperm is weak( Reference Nakamura 40 ). In addition, EM10 (be2b, sample 17) has been reported to have high-amylose content( Reference Asai, Abe and Matsushima 29 ) and high-RS content( Reference Nakamura, Satoh and Ohtsubo 41 ). The antidiabetic functionality of these mutant lines was considered to be glucoamylase-resistance from high-amylose contents. Interestingly, the antidiabetic effect of #2012 (ss3a/starch synthase IVb, sample 11) and #4012 (ss3a/branching enzyme I, sample 12), which also have a deficiency in SSIIIa, was weak (Fig. 1(a)). Taken together, the effect of SSIIIa deficiency changed depending on the co-deficient gene. We hypothesised that SSIIIa deficiency in rice is related to insulin secretion in animals fed with the rice, from a comparison of the results obtained with e1 (ss3a, sample 10) and #4012 (high iAUC30–90 min despite similar iAUC0–30 min).
We focused on the double mutant rice #4019 (ss3a/be2b, sample 15) among the seven screened antidiabetic rice lines and fed #4019 to GK rats, a model rat for T2D, for 5 weeks. Although #4019 feeding did not affect serum glucose levels and serum hormone levels (insulin, glucagon, and GLP-1), plasma C-peptide levels in the #4019-fed group were significantly higher than those in the control (Nipponbare-fed) group. C-peptide is the co-product of insulin maturation, and has a longer half-life than insulin( Reference Matthews, Rudenski and Burnett 42 ). Therefore, C-peptide in blood samples is considered a marker for insulin secretion. Higher plasma C-peptide levels suggested that ingestion of #4019 activated insulin secretion from pancreatic islet β-cells in the #4019 group although serum insulin levels were not changed probably due to 12-h fasting before being killed. Promotion of insulin secretion by #4019 was also observed in vitro (Fig. 2). Both in vivo and in vitro studies indicated that the expression of insulin genes (Ins1 and Ins2) and their positive transcriptional factor, Pdx1, was induced by #4019 ingestion. These results suggested that ingestion of #4019 promoted insulin secretion from the pancreas via promotion of Pdx1 expression in pancreatic cells.
The in vitro experiment suggested two points. One is that a mutant rice #4019 promotes Ins1 and Ins2 expression via Pdx1. The other is that a responsible substance is a substance that appears in blood serum after ingestion of #4019. Ferulic acid and γ-oryzanol are well-known functional components in rice( Reference Jung, Kim and Hwang 43 , Reference Yu, Nehus and Badger 44 ). However, these substances are predominantly contained in rice bran not in rice endosperm because of their hydrophobicity( Reference Zaima, Goto-Inoue and Hayasaka 45 ). We hypothesised that the responsible substance was a water-soluble metabolite in rice endosperm and performed a non-target metabolome analysis for water-soluble metabolites in rat serum used for the in vitro study. The metabolome analysis revealed that glycylglycine and ornithine concentrations in serum were significantly increased by intake of #4019 (Fig. 3). In the body, ornithine is synthesised from arginine by arginase in urea cycle. An increased arginine contents in #4019 and activation of arginase by intake of #4019 are suspected as one of possible mechanisms for high ornithine levels. In the serum of #4019-fed rats, allantoin levels, a metabolite of uric acid( Reference Wu, Lee and Muzny 46 ), were tended to increase (about 1·5 times higher, P=0·057, data not shown). This increase suggested the promotion of urea cycle and arginine conversion to ornithine. To clarify the mechanism, further studies are needed. Although ornithine is known to promote insulin-like growth factor( Reference Zajac, Poprzecki and Zebrowska 47 ), Leiss et al.( Reference Leiss, Flockerzie and Novakovic 48 ) recently reported that ornithine can also stimulate insulin secretion via Gα i2, belonging to the G-protein family. Taken together, we consider that ornithine increased by #4019 ingestion contribute to the promotion of insulin secretion from the pancreas. Although the serum concentrations of metabolites were not measurable by non-target metabolomics, it is possible to estimate the increase in serum ornithine concentration based on the literature. Vadivel et al.( Reference Vadivel, Aschner and Rey-Parra 49 ) reported that ornithine concentration in rat sera was about 100 µmol/l. Our metabolomic analysis showed that the signal intensity of ornithine in #4019-fed rat was 1·4-time stronger than that in control rats (Fig. 3). From this result, serum ornithine concentration was estimated at approximately 140 µmol/l (a 40 µmol/l increase). An i.p. administration of 10 mm L-ornithine at 100 µl (equal to 132 µg L-ornithine) to fasted rats induced a 0·1 µg/l increase of serum insulin concentration in under a minute although plasma L-ornithine concentration was not shown in the report( Reference Leiss, Flockerzie and Novakovic 48 ). The 40 µmol/l increase in serum L-ornithine concentration in the in vitro study was equal to an increase of 10·6 µg and considered reasonable for an about 4 ng/l increase of C-peptide secretion. However, whether Pdx1 expression is promoted by activation of the G-protein signal system remains unknown. As described above, ss3a and be2b, deficient genes in #4019, codes starch-synthesising enzymes( Reference Asai, Abe and Matsushima 29 ). Redestig et al. ( Reference Redestig, Kusano and Ebana 50 ) investigated the relationships between rice quality traits and various metabolites in kernels (as brown rice) by a metabolomic analysis with seven rice samples, including e1 and #4019. They reported that various metabolites in rice (stearic acid, phosphoric acid, lysine and ornithine) were involved in the determination of amylose/amylopectin ratio in brown rice( Reference Redestig, Kusano and Ebana 50 ). Although there were some differences between polished white rice and brown rice, it is predicted that starch structure and metabolites in endosperm are related to each other. Taken together, mutations in ss3a and be2b changed endosperm contents of metabolites via alteration of the starch structure. However, there are still possibilities that another substance in rice endosperm contributed to induce pancreatic expression of insulin-related genes. Further study is necessary to identify the responsible substance in #4019 for promotion of insulin expression.
In oral cereal powder tolerance test for screening, samples of other grains (three types of wheat, barley, rye and β-maize starch) were tested in the same system. Although the differences between the cultivars were ignored, increases in blood glucose levels by these samples, other than soft wheat, were relatively small compared with those induced by popular rice cultivars (Nipponbare, Akitakomachi and Hinohikari) (Fig. 1(a), Table 4). Among six loaded samples of non-rice grains, four samples (durum wheat, barley, rye and β-maize starch) belonged to the antidiabetic cluster (Fig. 1(a), Table 4). Although hard and soft wheat belonged to normal cluster, their iAUC0–30 min, recognised as an index for glucose absorption, were similar to those of durum wheat. These results indicated that consumption of popular rice cultivars resulted in higher postprandial blood glucose levels than other grains. According to Standard Tables of Food Composition in Japan (7th ed.), carbohydrate contents are similar among grains (rice: 74·5 g/100 g edible part, lay: 75·8 g/100 g, barley: 77·1 g/100 g and maize starch: 86·3 g/100 g)( 51 ). In this screening test, the same amount of grains was loaded to rats. Differences in postprandial blood glucose levels, especially iAUC0–30 min, were determined mainly by differences in digestion efficiencies of loaded samples. Higher iAUC0–30 min, reflecting greater glucose absorption, by rice samples meant rice-starch was easier to digest than starch in other grains. This tendency of rice-starch results from cultivar improvements to pursue better taste, which have been operated through the ages in Japan. To improve taste, the ratio of amylopectin in rice-starch was increased by traditional cultivar improvements to achieve easier digestion by salivary amylase( Reference Okuno, Fuwa and Yano 52 ). This is supported by the result of EM21. Almost all starches in endosperm of EM21, one of the rice lines called sticky rice, are amylopectin( Reference Nishi, Nakamura and Tanaka 33 ). Taken together, development of an antidiabetic rice line may be equal to a reversal process of development of good taste cultivars traditionally developed in Japan.
In oral cereal powder tolerance test, iAUC of 2 g/kg b.w. EM21 administration and 4 g/kg b.w. glucose were in almost the same range (Table 4, Fig. 1(a)). Not applied only to EM10, rice samples belonging to the normal cluster resulted in higher iAUC than 2·0 g/kg b.w glucose (Table 4, Fig. 1(a)). These results implied an interesting possibility about rice. In this study, we administered raw grain samples because rats present high amylase activities sufficient to digest raw rice. Raw rice endosperm contains about 80 wt% carbohydrate( 51 ); thus, 2·0 g of rice contains 1·6 g of glucose at maximum. Thus, larger-than-expected increases by rice administration could not be explained only as the result of its easily digestible starch-structure, and implied that rice contained substance(s) which inhibited insulin secretion or insulin sensitivity. Further study is necessary to confirm this hypothesis and identify the responsible substances in rice.
In this study, we used iAUC plot, which enabled us to simultaneously estimate both of increases and clearances of blood glucose after sample loading. Separation of iAUC at 30 min, not at peak times of postprandial blood glucose levels, makes separation effective. Plots of samples which result in rapid peaks and quick clearances of blood glucose such as 1 g/kg b.w. sucrose located in the lower right area (Fig. 1(a)). On the other hand, plots of samples which result in moderate increases and clearances of blood glucose like lactose located higher in the left area (Fig. 1(a)). We believe that iAUC plot is quite useful for the screening of antidiabetic foods.
In conclusion, in this study, we separated seven highly effective rice samples from twenty rice samples by oral cereal powder tolerance test with other grains and six purified carbohydrates. One of the rice samples belonging to the antidiabetic cluster, #4019, was fed to GK rats. Feeding experiments revealed that intake of #4019 promoted insulin secretion from the pancreas via activation of Pdx1. Intake of #4019 instead of other popular rice cultivars is expected to be a useful approach for the prevention of T2D. In addition, our methodology in this study will be available for the establishment of other functional cultivars.
Acknowledgements
The authors would like to thank Editage (www.editate.jp) for English language editing.
This study was supported by the Ministry of Agriculture, Forestry and Fisheries, MAFF, Tokyo, Japan (grant no. 25033AB).
Y. T., N. F., B. S. and M. S. drafted the manuscript. Y. T., N. F., T. K., B. S. and M. S. designed the research. Y. T., K. T., J. K. and A. S. participated in the experimental work and collected data. Y. T., K. T., J. K., A. S., T. A., Y. S., B. S. and M. S. analysed data. All authors have read and approved the final version of the manuscript.
The authors declare that there are no conflicts of interest.


