

The incidence of obesity–diabetes and related metabolic abnormalities associated with insulin resistance are increasing at an exponential rate. Thus, new pharmacological approaches for the treatment of these conditions are essential(Reference Choussein, Makri and Frangos1). Deposition of TAG in body tissues, including liver, muscle and adipocytes has a negative impact on cellular insulin sensitivity(Reference Rizza and Butler2). In this regard, accumulating evidence suggests a role for gastric inhibitory polypeptide (GIP) in obesity-related insulin resistance. For example, GIP receptors are present on adipocytes(Reference Yip and Wolfe3) and GIP was recently shown to promote adipocyte growth and development in combination with insulin(Reference Kim, Nian and McIntosh4). Moreover, GIP and insulin levels are increased in human obesity(Reference Salera, Giacomoni and Pironi5) and consumption of high-fat diets induces K-cell hyperplasia and increased GIP expression(Reference Bailey, Flatt and Kwasowski6, Reference Gniuli, Calcagno and Dalla Libera7). GIP also enhances fatty acid re-esterification in abdominal adipose tissue in humans, resulting in increased TAG deposition(Reference Asmar, Simonsen and Madsbad8). Other established effects of GIP on adipocytes include increase of lipoprotein lipase activity, stimulation of lipogenesis, enhancement of fatty acid uptake, augmentation of insulin-induced fatty acid incorporation and inhibition of both glucagon- and adrenergic receptor-mediated lipolysis(Reference Gault, O'Harte and Flatt9). Thus, blockade of GIP signalling is proposed as a potentially attractive target for therapeutic development(Reference Irwin and Flatt10, Reference Irwin, Gault and Flatt11).
In keeping with this, genetic knockout of the GIP receptor in normal or ob/ob mice fed a high-fat diet protects against obesity and related metabolic abnormalities(Reference Miyawaki, Yamada and Ban12). In addition, chemical knockout of GIP receptor-mediated effects using the stable and specific antagonist, (proline3)GIP, generates remarkably similar outcomes(Reference Irwin and Flatt10, Reference Gault, Irwin and Green13). Furthermore, specific K-cell destruction, in transgenic mice with regulatory elements of the GIP promoter/gene expressing an attenuated diphtheria toxin A, was shown to protect against diet-induced obesity and ameliorate insulin resistance(Reference Althage, Ford and Wang14). Finally, a high-fat diet rich in chemically modified starches reduced circulating GIP levels and was associated with decreased body adiposity in mice(Reference Shimotoyodome, Suzuki and Fukuoka15). Hence, disrupting GIP receptor signalling represents a promising novel therapeutic strategy for the alleviation of obesity-related diabetes.
The active induction of GIP-neutralising antibodies is an appealing approach to disrupt GIP receptor signalling in vivo, given the potential for an infrequent dosing regimen and freedom from pharmacokinetic issues associated with other peptide-based therapeutics(Reference Katsila, Siskos and Tamvakopoulos16). As such, this strategy has already been shown to improve glucose tolerance and circulating glucose levels in obese-diabetic (ob/ob) and high-fat-fed mice(Reference Irwin, McClean and Patterson17, Reference Montgomery, Irwin and Flatt18). Importantly, the induction of GIP-neutralising antibodies did not affect feeding and was not associated with any adverse side-effects. These immunological studies used different mouse models and either native GIP or (Pro3)GIP as the conjugated immunogen. Importantly, it was not assessed whether the immunogens imparted bioactivity other than that deriving from antibody production or whether potential value of this approach is complicated by negative effects on cognition or energy metabolism. Therefore, we have conducted head-to-head studies on the long-term effects of GIP and (Pro3)GIP–ovalbumin conjugates in a single high-fat-fed mouse model. This includes the assessment of metabolic control, cognitive function and indirect calorimetry; and evaluating both in vitro and in vivo whether these GIP-based immunogens could function as long-acting GIP receptor modulators in their own right.
Materials and methods
Animals
Outbred male Swiss National Institutes of Health (NIH) mice obtained from Harlan Limited, Blackthorn, UK were used at 12–15 weeks of age. Many previous studies(Reference Gault, O'Harte and Flatt9–Reference Irwin, Gault and Flatt11, Reference Gault, Irwin and Green13, Reference Montgomery, Irwin and Flatt18, Reference Gault, Porter and Irwin19) have examined the effect of GIP, GIP mimetics and GIP antagonists in these mice. The animals were divided into groups and housed individually in an air-conditioned room at 22 ± 2°C with a 12 h light–12 h dark cycle (08.00–20.00 hours). Drinking-water and a standard rodent maintenance diet (10 % fat, 30 % protein and 60 % carbohydrate, Trouw Nutrition, Cheshire, UK) were freely available before the commencement of experiments. All studies were carried out in accordance with the UK Animals (Scientific Procedures) Act 1986.
Experimental protocols for immunisation studies
Sufficient quantity of GIP– and (Pro3)GIP–ovalbumin (coupled using the cross-linking glutaraldehyde method(Reference Irwin, McClean and Patterson17)) was dialysed overnight against PBS at 4°C. The dialysate was aliquoted and stored at − 20 °C before injection. In the main experimental series, groups of mice (n 10 for immunised groups, n 8 for all other groups) were injected subcutaneously with a 1/1 mixture of complete Freund's adjuvant and 80 μg complexed peptides. Following this, seven further subcutaneous booster injections were performed with the same quantity of antigen, mixed 1/1 with incomplete Freund's adjuvant after 14, 28, 42, 56, 70, 84 and 98 d. Control non-immunised mice received an equivalent amount of ovalbumin in Freund's adjuvant. Food intake, body weight, non-fasting blood glucose and plasma insulin concentrations were monitored at 5–7 d intervals. On day 21, immunised and control non-immunised mice were transferred to a high-fat diet (45 % fat, 35 % carbohydrate and 20 % protein; percentage total energy of 26·15 kJ/g; Special Diet Services, Essex, UK). A group of lean control mice (n 6) was maintained on standard rodent maintenance diet (10 % fat, 30 % protein and 60 % carbohydrate; percentage total energy of 12·99 kJ/g; Trouw Nutrition) and used for comparative purposes as appropriate.
Intraperitoneal glucose tolerance (18 mmol/kg body weight) and insulin sensitivity tests (20 U/kg body weight) were performed at the end of the study period in non-fasted animals. In addition, the glycaemic and insulinotropic responses to 15 min re-feeding (standard chow, 10 % fat, 30 % protein and 60 % carbohydrate) were assessed at the end of the study period in overnight fasted animals. All acute experiments commenced at 10.00 hours. Measurements of indirect calorimetry, energy expenditure and locomotor activity were performed on day 98 using the Complete Laboratory Animal Monitoring System metabolic chambers (Columbus Instruments, OH, USA), as described previously(Reference Gault, Porter and Irwin19). At the end of the study, pancreatic tissues were excised, weighed and processed for the measurement of insulin following extraction with 5 ml/g of ice-cold acid ethanol (750 ml ethanol, 235 ml water, 15 ml concentrated HCl). Gastrocnemius muscle and epididymal fat pads were also excised and TAG content determined as described previously(Reference Montgomery, Irwin and Flatt18).
Object recognition test
Animals were subjected to an object recognition test to assess cognition at the end of the study as outlined previously(Reference Abbas, Faivre and Hölscher20). Briefly, two identical objects (two marbles, 2·5 cm diameter; or two dice, 1·2 cm side length) randomised between groups were placed in the centre of an exploratory arena (58 cm diameter, 38 cm high). Then, 4 h after initial exposure (the acquisition phase), one of the two objects was replaced by a novel object (a marble or die) and the time spent exploring both objects during a 5-min trial phase determined. A computerised tracking system (Biosignals, New York, NY, USA) analysed visits within an area of 2·5 cm radius about each object. Time spent exploring the novel object (B) was expressed as the recognition index (RI) which represents time (t) spent exploring the novel object divided by time spent exploring both objects (A+B) × 10(Reference Dere, Huston and De Souza Silva21). RIB = tB/t(A+B) × 100 normalises all data to enable statistical comparison using normally distributed statistics as required.
Antibody detection
Detection of GIP-specific antibodies was carried out as described previously(Reference Montgomery, Irwin and Flatt18), using a Microlumi XS Microplate Luminometer (Harta Instruments, Gaithersburg, MD, USA) and Lumiterm IIi software (Harta Instruments).
Cell culture and acute in vivo studies
Further in vitro and in vivo studies assessed the acute biological activity of the GIP and (Pro3)GIP ovalbumin-bound peptides in comparison to their native counterparts GIP and (Pro3)GIP, respectively. Clonal pancreatic BRIN-BD11 cells were used for in vitro studies(Reference McClenaghan, Barnett and Ah-Sing22). Briefly, BRIN-BD11 cells were grown in an atmosphere of 5 % CO2 and 95 % air using Roswell Park Memorial Institute (RPMI)-1640 containing 11·1 mmol/l glucose, 0·3 g/l l-glutamine, 10 % (v/v) fetal calf serum, 100 U/ml penicillin and 0·1 g/l streptomycin at 37°C. Cells were seeded into twenty-four-multi-well plates at 1·5 × 105 cells per well and cultured for 18 h at 37°C. Thereafter, culture medium was replaced with 1 ml of a Krebs Ringer bicarbonate buffer (pH 7·4) supplemented with 0·1 % (w/v) bovine serum albumin and 1·1 mmol/l glucose. After 40 min pre-incubation at 37°C, the buffer was replaced with 1 ml of Krebs Ringer bicarbonate test buffer containing glucose and test agents, as detailed in the legends to figures. This was followed by a 20 min incubation at 37°C; aliquots were removed and stored at − 20°C for insulin determination.
For acute in vivo studies, male Swiss NIH mice previously maintained on high-fat diet for 100 d (n 8) were utilised. The glycaemic response to intraperitoneal injection of glucose (18 mmol/kg) alone was examined immediately or 48 h after administration of native GIP, GIP–ovalbumin (both at 80 μg/mouse) or saline vehicle. In another series, the metabolic response to intraperitoneal injection of glucose (18 mmol/kg) in combination with native GIP (25 nmol/kg) was examined immediately or 48 h after administration of (Pro3)GIP, (Pro3)GIP–ovalbumin (both at 80 μg/mouse) or saline vehicle.
Biochemical analysis
Blood samples taken from the cut tip of the tail vein of conscious mice at the times indicated in the figures were immediately centrifuged using a Beckman microcentrifuge (Beckman Instruments, High Wycombe, UK) for 30 s at 13 000 g. Plasma was aliquoted and stored at − 20 °C before analysis. Blood glucose was measured using the Ascensia Contour® Blood Glucose Meter (Bayer AG, Leverkusen, Germany). Plasma and tissue TAG and cholesterol levels were measured as described previously(Reference Montgomery, Irwin and Flatt18) using a Hitachi Automated Analyser 912 (Boehringer, Mannheim, Germany). Insulin was determined by a dextran-charcoal RIA(Reference Flatt and Bailey23).
Statistics
Results are expressed as means with their standard errors. Data were compared using ANOVA, followed by a Student–Newman–Keuls post hoc test. Area-under-the-curve (AUC) analyses were calculated using the trapezoidal rule with baseline subtraction. P < 0·05 was considered to be statistically significant.
Results
Effects of active gastric inhibitory polypeptide and (Pro3)GIP immunisation on gastric inhibitory polypeptide antibody production
GIP antibodies were detected in the plasma of GIP or (Pro3)GIP immunised mice on day 28, and were consistently present throughout the remainder of the study period (data not shown). Binding capacity of plasma on day 98 was calculated to be in the region of 18·2 μg GIP/ml for GIP immunised mice, and 11·6 μg GIP/ml for (Pro3)GIP immunised mice.
Sub-chronic effects of active gastric inhibitory polypeptide and (Pro3)GIP immunisation on body weight, energy intake and non-fasting glucose and insulin levels in high-fat-fed mice
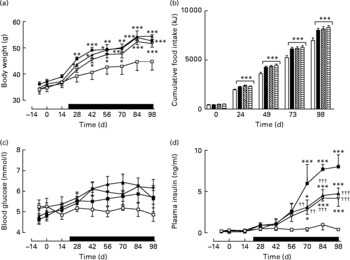
Active immunisation against GIP or (Pro3)GIP did not result in significant changes in body weight or energy intake compared to non-immunised controls (Fig. 1(a) and (b)). However, shortly after the commencement of high-fat feeding (day 21), all high-fat-fed groups had significantly increased body weight and energy intake compared to lean controls which remained elevated throughout the study period (Fig. 1(a)). GIP and (Pro3)GIP immunisation had no significant effect on non-fasting blood glucose levels (Fig. 1(c)), although it should be noted that glucose levels were not significantly different between lean and high-fat controls at any of the time points. However, non-fasting plasma insulin levels of GIP and (Pro3)GIP immunised were significantly (P < 0·01 to P < 0·001) reduced compared to non-immunised control mice from day 70 onwards, but remained elevated (P < 0·05 to P < 0·001) compared to lean control mice (Fig. 1(d)).
Sub-chronic effects of active immunisation against gastric inhibitory polypeptide (GIP; ![]() , ▧) and (Pro3)GIP (
, ▧) and (Pro3)GIP (![]() ,
, ![]() ) on (a) body weight, (b) food intake, (c) non-fasting glucose and (d) insulin in high-fat-fed mice. Complexed GIP, (Pro3)GIP or ovalbumin (control) were administered subcutaneously once every 14 d for 98 d. Animals were transferred to a high-fat-diet on day 21 as indicated by the black bar. Lean control (
) on (a) body weight, (b) food intake, (c) non-fasting glucose and (d) insulin in high-fat-fed mice. Complexed GIP, (Pro3)GIP or ovalbumin (control) were administered subcutaneously once every 14 d for 98 d. Animals were transferred to a high-fat-diet on day 21 as indicated by the black bar. Lean control (![]() , □) animals on normal standard chow were used for comparisons throughout. Values are means with their standard errors represented by vertical bars (n 6–10 mice). Mean values were significantly different from those of lean controls: *P < 0·05, **P < 0·01, ***P < 0·001. Mean values were significantly different from those of the non-immunised (
, □) animals on normal standard chow were used for comparisons throughout. Values are means with their standard errors represented by vertical bars (n 6–10 mice). Mean values were significantly different from those of lean controls: *P < 0·05, **P < 0·01, ***P < 0·001. Mean values were significantly different from those of the non-immunised (![]() , ■) group: ††P < 0·01, †††P < 0·01.
, ■) group: ††P < 0·01, †††P < 0·01.
Sub-chronic effects of active gastric inhibitory polypeptide and (Pro3)GIP immunisation on glucose tolerance in high-fat-fed mice
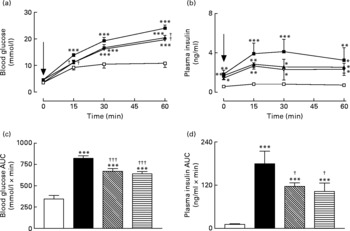
Active immunisation against GIP or (Pro3)GIP resulted in a significant (P < 0·01) decrease in blood glucose levels at 15 and 60 min post glucose injection when compared to non-immunised high-fat control mice (Fig. 2(a)). However, blood glucose levels in the immunised mice were still significantly elevated at all post-injection time points compared to lean controls (Fig. 2(a)). This was corroborated in the 0–60 min AUC values with GIP and (Pro3)GIP immunised mice having a significantly (P < 0·001) reduced overall glycaemic excursion compared to non-immunised high-fat control mice, but still elevated (P < 0·001) compared to lean controls (Fig. 2(b)). In similar fashion, overall glucose stimulated plasma insulin levels were significantly (P < 0·05) decreased in GIP and (Pro3)GIP immunised mice compared to non-immunised high-fat controls, but still significantly raised (P < 0·001) compared to lean controls (Fig. 2(c) and (d)).
Sub-chronic effects of active immunisation against gastric inhibitory polypeptide (GIP; ![]() , ▧) and (Pro3)GIP (
, ▧) and (Pro3)GIP (![]() ;
; ![]() ) on intraperitoneal (i.p.; a, b) glucose tolerance and plasma insulin response to glucose in high-fat-fed mice. Tests were conducted in non-fasted mice after 98 d active GIP or (Pro3)GIP immunisation. Glucose (18 mmol/kg body weight, i.p.) was administered at the time indicated by the arrow. (c, d) Plasma glucose and insulin area under the curve (AUC) values for 0–60 min are also shown. Values are means with their standard errors represented by vertical bars (n 8–10 mice). Mean values were significantly different from those of lean controls (
) on intraperitoneal (i.p.; a, b) glucose tolerance and plasma insulin response to glucose in high-fat-fed mice. Tests were conducted in non-fasted mice after 98 d active GIP or (Pro3)GIP immunisation. Glucose (18 mmol/kg body weight, i.p.) was administered at the time indicated by the arrow. (c, d) Plasma glucose and insulin area under the curve (AUC) values for 0–60 min are also shown. Values are means with their standard errors represented by vertical bars (n 8–10 mice). Mean values were significantly different from those of lean controls (![]() , □): *P < 0·05, **P < 0·01, ***P < 0·001. Mean values were significantly different from those of the non-immunised (
, □): *P < 0·05, **P < 0·01, ***P < 0·001. Mean values were significantly different from those of the non-immunised (![]() , ■) group: †P < 0·05, †††P < 0·001.
, ■) group: †P < 0·05, †††P < 0·001.
Sub-chronic effects of active gastric inhibitory polypeptide and (Pro3)GIP immunisation on metabolic response to re-feeding in high-fat-fed mice
Overnight fasting did not reveal significant differences in basal blood glucose or plasma insulin levels in the various groups of mice (Fig. 3). A 15 min re-feeding period increased blood glucose concentrations in all animals; however, these levels were significantly (P < 0·05) lower in GIP and (Pro3)GIP immunised mice compared to non-immunised high-fat controls at 60 min post feeding (Fig. 3(a)). This was supported by the 0–60 min AUC values, where non-immunised high-fat control, but not GIP or (Pro3)GIP immunised, mice had significantly (P < 0·05) elevated overall glycaemic excursion compared to lean controls (Fig. 3(b)). Plasma insulin responses to re-feeding were similar in all high-fat-fed mice, with no differences in AUC values between high-fat control and immunised mice (Fig. 3(c) and (d)). However, overall plasma insulin levels were still significantly (P < 0·01 to P < 0·001) elevated in all high-fat mice compared to lean controls (Fig. 3(d)). All groups consumed similar amounts of food (0·4–0·5 g/mouse per 15 min) during the 15 min re-feeding period.
Sub-chronic effects of active immunisation against gastric inhibitory polypeptide (GIP; ![]() , ▧) and (Pro3)GIP (
, ▧) and (Pro3)GIP (![]() ,
, ![]() ) on (a) glycaemic and (b) insulinotropic responses to 15 min re-feeding in high-fat-fed mice. Tests were conducted in overnight fasted mice after 98 d active GIP or (Pro3)GIP immunisation. The re-feeding period is indicated by the black horizontal bar. Plasma (c) glucose and (d) insulin area under the curve (AUC) values for 0–120 min are also shown. Values are means with their standard errors represented by vertical bars (n 6–10 mice). Mean values were significantly different from those of lean controls (
) on (a) glycaemic and (b) insulinotropic responses to 15 min re-feeding in high-fat-fed mice. Tests were conducted in overnight fasted mice after 98 d active GIP or (Pro3)GIP immunisation. The re-feeding period is indicated by the black horizontal bar. Plasma (c) glucose and (d) insulin area under the curve (AUC) values for 0–120 min are also shown. Values are means with their standard errors represented by vertical bars (n 6–10 mice). Mean values were significantly different from those of lean controls (![]() , □): *P < 0·05, **P < 0·01, ***P < 0·001. † Mean values were significantly different from those of the non-immunised (
, □): *P < 0·05, **P < 0·01, ***P < 0·001. † Mean values were significantly different from those of the non-immunised (![]() , ■) group (P < 0·05).
, ■) group (P < 0·05).
Sub-chronic effects of active gastric inhibitory polypeptide and (Pro3)GIP immunisation on insulin sensitivity and pancreatic insulin content in high-fat-fed mice
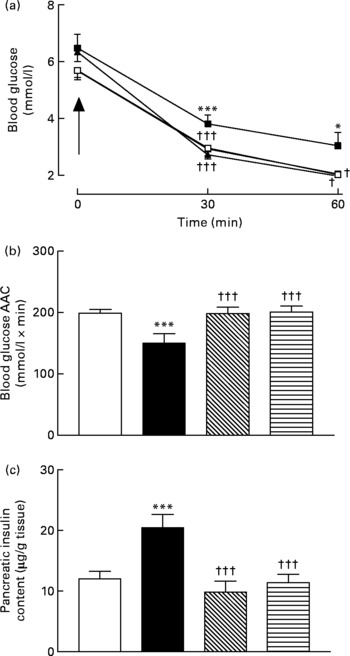
Active immunisation against GIP or (Pro3)GIP was associated with significantly (P < 0·05 to P < 0·001) decreased blood glucose levels 30 and 60 min after insulin injection when compared to non-immunised high-fat control mice (Fig. 4(a)). In addition, the overall AUC values of GIP and (Pro3)GIP immunised mice were significantly (P < 0·001) improved compared to high-fat controls, with no significant difference compared to lean control mice (Fig. 4(b)). Similarly, pancreatic insulin content was significantly (P < 0·001) decreased in all immunised mice compared to non-immunised high-fat controls, with no significant difference compared to lean mice (Fig. 4(c)).
Sub-chronic effects of active immunisation against gastric inhibitory polypeptide (GIP; ![]() , ▧) and (Pro3)GIP (
, ▧) and (Pro3)GIP (![]() ,
, ![]() ) on insulin sensitivity and (c) pancreatic insulin content in high-fat-fed mice. Tests were conducted in non-fasted mice after 98 d active GIP or (Pro3)GIP immunisation in non-fasted mice. (a) Insulin (15 U/kg body weight, intraperitoneal) was administered at the time indicated by the arrow. (b) Plasma glucose area above the curve (AAC) values for 0–60 min are also shown. Values are means with their standard errors represented by vertical bars (n 6–10 mice). Mean values were significantly different from those of lean controls (
) on insulin sensitivity and (c) pancreatic insulin content in high-fat-fed mice. Tests were conducted in non-fasted mice after 98 d active GIP or (Pro3)GIP immunisation in non-fasted mice. (a) Insulin (15 U/kg body weight, intraperitoneal) was administered at the time indicated by the arrow. (b) Plasma glucose area above the curve (AAC) values for 0–60 min are also shown. Values are means with their standard errors represented by vertical bars (n 6–10 mice). Mean values were significantly different from those of lean controls (![]() , □): *P < 0·05, ***P < 0·001. Mean values were significantly different from those of the non-immunised (
, □): *P < 0·05, ***P < 0·001. Mean values were significantly different from those of the non-immunised (![]() , ■) group: †P < 0·05, †††P < 0·001.
, ■) group: †P < 0·05, †††P < 0·001.
Sub-chronic effects of active gastric inhibitory polypeptide and (Pro3)GIP immunisation on blood lipid profile and TAG content of gastrocnemius muscle and epididymal adipose tissue in high-fat-fed mice
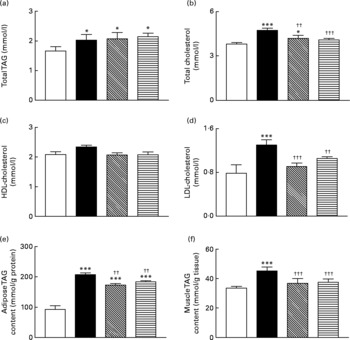
Total blood TAG levels were significantly (P < 0·05) elevated in high-fat control, GIP and (Pro3)GIP immunised mice compared to lean controls (Fig. 5(a)). However, active immunisation against GIP and (Pro3)GIP was associated with significantly (P < 0·01 and P < 0·001, respectively) reduced plasma total cholesterol levels when compared to non-immunised high-fat control mice (Fig. 5(b)). In keeping with this, plasma LDL-cholesterol levels were decreased (P < 0·001 and P < 0·01, respectively) in GIP and (Pro3)GIP immunised mice compared to high-fat controls attaining levels similar to normal control mice (Fig. 5(d)). There was no significant difference in HDL-cholesterol levels between any of the groups (Fig. 5(c)). The TAG contents of both gastrocnemius muscle and epididymal adipose tissue were significantly (P < 0·01 to P < 0·001) reduced in all immunised mice compared to non-immunised high-fat controls (Fig. 5(e) and (f)).
Sub-chronic effects of active immunisation against gastric inhibitory polypeptide (GIP, ▧) and (Pro3)GIP (![]() ) on (a–d) blood lipid profile and TAG content of epididymal (e) adipose tissue and gastrocnemius (f) muscle in high-fat-fed mice. Parameters were measured after 98 d active GIP or (Pro3)GIP immunisation. Values are means with their standard errors represented by vertical bars (n 6–10 mice). Mean values were significantly different from those of lean controls (□): *P < 0·05, ***P < 0·001. Mean values were significantly different from those of the non-immunised (■) group: ††P < 0·01, †††P < 0·001.
) on (a–d) blood lipid profile and TAG content of epididymal (e) adipose tissue and gastrocnemius (f) muscle in high-fat-fed mice. Parameters were measured after 98 d active GIP or (Pro3)GIP immunisation. Values are means with their standard errors represented by vertical bars (n 6–10 mice). Mean values were significantly different from those of lean controls (□): *P < 0·05, ***P < 0·001. Mean values were significantly different from those of the non-immunised (■) group: ††P < 0·01, †††P < 0·001.
Sub-chronic effects of active gastric inhibitory polypeptide and (Pro3)GIP immunisation on cognitive function, energy expenditure, indirect calorimetry and locomotor activity in high-fat-fed mice
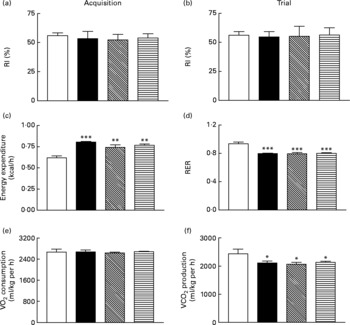
All groups of mice explored the two identical objects during the acquisition phase with no significant difference in RI (Fig. 6(a)). During the test trial 4 h later all mice, independent of diet or treatment, displayed similar RI values (Fig. 6(b)). As shown in Fig. 6(c) and (d), respiratory exchange ratio and energy expenditure were not significantly altered during the 22 h observation period in immunised mice when compared to non-immunised controls. Similarly, active immunisation against GIP or (Pro3)GIP had no significant effect on VO2 or CO2 production when compared to non-immunised controls (Fig. 6(e) and (f)). However, energy expenditure was significantly increased (P < 0·01 to P < 0·001), with respiratory exchange ratio and VCO2 production significantly decreased (P < 0·001 and P < 0·05, respectively), in all high-fat-fed mice compared to lean controls (Fig. 6). These trends were maintained independent of dark or light phase (data not shown). Locomotor activity was not significantly altered by either the dietary, GIP or (Pro3)GIP immunisation interventions (data not shown).
Sub-chronic effects of active immunisation against gastric inhibitory polypeptide (GIP, ▧) and (Pro3)GIP (![]() ) on (a, b) cognitive function, (c) energy expenditure, (d) respiratory exchange ratio (RER), (e) O2 consumption and (f) CO2 production in high-fat-fed mice. All parameters were measured after 98 d active (Pro3)GIP immunisation. The object recognition test (5 min) was performed using two familiar objects during an (a) acquisition phase and following introduction of a novel object (b) 4 h later. Displayed is the recognition index (RI), which is the percentage (%) time spent exploring novel v. familiar object. (c–f) Mice were placed in CLAMS metabolic chambers and O2 consumption or CO2 production were measured for 30 s at 15 min intervals. RER was calculated by dividing VCO2 by VO2. Energy expenditure was calculated using RER with the following equation (3·815+1·232 × RER) × VO2. Values are means with their standard errors represented by vertical bars (n 6–10 mice). Mean values were significantly different from those of lean controls (□): *P < 0·05, **P < 0·01, ***P < 0·001. ■, Non-immunised.
) on (a, b) cognitive function, (c) energy expenditure, (d) respiratory exchange ratio (RER), (e) O2 consumption and (f) CO2 production in high-fat-fed mice. All parameters were measured after 98 d active (Pro3)GIP immunisation. The object recognition test (5 min) was performed using two familiar objects during an (a) acquisition phase and following introduction of a novel object (b) 4 h later. Displayed is the recognition index (RI), which is the percentage (%) time spent exploring novel v. familiar object. (c–f) Mice were placed in CLAMS metabolic chambers and O2 consumption or CO2 production were measured for 30 s at 15 min intervals. RER was calculated by dividing VCO2 by VO2. Energy expenditure was calculated using RER with the following equation (3·815+1·232 × RER) × VO2. Values are means with their standard errors represented by vertical bars (n 6–10 mice). Mean values were significantly different from those of lean controls (□): *P < 0·05, **P < 0·01, ***P < 0·001. ■, Non-immunised.
Acute effects of gastric inhibitory polypeptide- and (Pro3)GIP–ovalbumin complex in vitro and in vivo
As expected, GIP induced a concentration-dependent increase in insulin secretion, while (Pro3)GIP effectively annulled GIP-induced insulin release from BRIN BD11 cells (Fig. 7(a) and (b)). However, the ovalbumin-bound GIP and (Pro3)GIP did not possess any such biological activity in vitro (Fig. 7(a) and (b)). In agreement with this, acute administration of native GIP and (Pro3)GIP in high-fat-fed mice was associated with prominent glucose-lowering activity or complete annulment of the glucose-lowering effect of native GIP, respectively (Fig. 7(c) and (d)). The ovalbumin-bound peptides did not exert any apparent biological effects when administered acutely to mice (Fig. 7(c) and (d)). At 48 h after administration, the effects of native GIP and (Pro3)GIP were lost, while the GIP and (Pro3)GIP ovalbumin-treated mice continued to display no metabolic alterations compared to the respective control mice (Fig. 7(e) and (f)).
Acute biological effects of native gastric inhibitory polypeptide (GIP), (Pro3)GIP, GIP–ovalbumin complex and (Pro3)GIP–ovalbumin complex in (a, b) BRIN BD11 cells and (c–f) high-fat-fed mice. (a) Following 40 min pre-incubation with a buffer containing 1·1 mm-glucose, insulin-releasing activity of native GIP and GIP–ovalbumin complex (10− 13 to 10− 7 m) was tested during a 20-min incubation period. □, 5·6 mm-glucose control; ■, GIP; ▧, GIP conjugate. (b) In a similar fashion, the antagonistic effects of (Pro3)GIP and (Pro3)GIP–ovalbumin complex on GIP-stimulated (10− 7 m) insulin secretion was assessed in BRIN BD11 cells during a 20 min incubation period. □, 5·6 mm-glucose control; ■, GIP (10− 7 m); ![]() , GIP (10− 7 m)+(Pro3)GIP; ▧, GIP (10− 7 m)+(Pro3)GIP conjugate. (c, e) In vivo tests were conducted (c) 0 h and (e) 48 h after a single injection of saline vehicle (0·9 % (w/v), NaCl), native GIP or GIP–ovalbumin complex (both at 80 μg/mouse) in mice previously fed a high-fat diet for 100 d. Glucose (18 mmol/kg) alone was administered by intraperitoneal injection at time 0 min. Plasma glucose area under the curve (AUC) values for 0–60 min post injection are shown in insets.
, GIP (10− 7 m)+(Pro3)GIP; ▧, GIP (10− 7 m)+(Pro3)GIP conjugate. (c, e) In vivo tests were conducted (c) 0 h and (e) 48 h after a single injection of saline vehicle (0·9 % (w/v), NaCl), native GIP or GIP–ovalbumin complex (both at 80 μg/mouse) in mice previously fed a high-fat diet for 100 d. Glucose (18 mmol/kg) alone was administered by intraperitoneal injection at time 0 min. Plasma glucose area under the curve (AUC) values for 0–60 min post injection are shown in insets. ![]() , Glucose alone;
, Glucose alone; ![]() , glucose+GIP;
, glucose+GIP; ![]() , glucose+GIP conjugate. Inset: ■, glucose alone; □, glucose+GIP;
, glucose+GIP conjugate. Inset: ■, glucose alone; □, glucose+GIP; ![]() , glucose+GIP conjugate. (d, f) In a second series, tests were conducted (d) 0 h and (f) 48 h after a single injection of saline vehicle (0·9 % (w/v), NaCl), (Pro3)GIP or (Pro3)GIP–ovalbumin complex (both at 80 μg/mouse) in mice previously fed a high-fat diet for 100 d. GIP (25 nmol/kg) in combination with glucose (18 mmol/kg) was administered by intraperitoneal injection at time 0 min. Plasma glucose AUC values for 0–60 min post injection are shown in insets.
, glucose+GIP conjugate. (d, f) In a second series, tests were conducted (d) 0 h and (f) 48 h after a single injection of saline vehicle (0·9 % (w/v), NaCl), (Pro3)GIP or (Pro3)GIP–ovalbumin complex (both at 80 μg/mouse) in mice previously fed a high-fat diet for 100 d. GIP (25 nmol/kg) in combination with glucose (18 mmol/kg) was administered by intraperitoneal injection at time 0 min. Plasma glucose AUC values for 0–60 min post injection are shown in insets. ![]() , Glucose alone;
, Glucose alone; ![]() , glucose+GIP;
, glucose+GIP; ![]() , glucose+GIP+(Pro3)GIP;
, glucose+GIP+(Pro3)GIP; ![]() , glucose+GIP+(Pro3)GIP conjugate. Inset: □, glucose alone; ■, glucose+GIP; ▧, glucose+GIP+(Pro3)GIP;
, glucose+GIP+(Pro3)GIP conjugate. Inset: □, glucose alone; ■, glucose+GIP; ▧, glucose+GIP+(Pro3)GIP; ![]() , glucose+GIP+(Pro3)GIP conjugate. Values are means with their standard errors represented by vertical bars. Mean values were significantly different from those of the respective control: *P < 0·05, **P < 0·01, ***P < 0·001. Mean values were significantly different from those of native GIP: ††P < 0·01, †††P < 0·001. Mean values were significantly different from those of (Pro3)GIP: ‡‡P < 0·01, ‡‡‡P < 0·001.
, glucose+GIP+(Pro3)GIP conjugate. Values are means with their standard errors represented by vertical bars. Mean values were significantly different from those of the respective control: *P < 0·05, **P < 0·01, ***P < 0·001. Mean values were significantly different from those of native GIP: ††P < 0·01, †††P < 0·001. Mean values were significantly different from those of (Pro3)GIP: ‡‡P < 0·01, ‡‡‡P < 0·001.
Discussion
Active immunisation against GIP or (Pro3)GIP for 98 d was not associated with changes in body weight or energy intake, in agreement with previous reports(Reference Irwin, McClean and Patterson17, Reference Montgomery, Irwin and Flatt18). In addition, non-fasting blood glucose levels were also unchanged in the present study. Lack of effect on body weight is interesting, given that GIP has been postulated as a potential ‘thrifty’ hormone(Reference Irwin and Flatt10, Reference Kieffer24), but taking into account previous studies(Reference Irwin, McClean and Patterson17, Reference Montgomery, Irwin and Flatt18) and the high levels of overlap in pathways involved in energy intake and deposition, this is perhaps unsurprising. Moreover, the role of GIP in the surgical treatment of obesity has been extensively studied(Reference Flatt25). To date, some studies involving human subjects have clearly shown a decrease in GIP post-malabsorptive bariatric surgery; however, information generated from animal models remains inconclusive(Reference Rao and Kini26).
Despite no clear alterations in non-fasting glucose levels, circulating insulin levels were significantly decreased in all immunised mice compared to non-immunised high-fat controls, suggestive of improved insulin sensitivity. This was confirmed at the end of the study by substantial insulin-induced reductions in blood glucose levels in all immunised mice, similar to lean controls. Further, oral and intraperitoneal nutrient challenge resulted in significantly decreased glucose levels in all immunised mice compared to high-fat controls, despite markedly lowered insulin concentrations. There was only a modest increase in blood glucose levels in normal mice following intraperitoneal glucose challenge when compared to high-fat-fed mice, undoubtedly a reflection of their prominent gluco-regulatory mechanisms in addition to the well-characterised detrimental effect of high-fat feeding on glucose handling. Pancreatic insulin contents of GIP and (Pro3)GIP immunised mice were also identical to lean control animals consistent with decreased insulin demand. Neither intestinal nor circulating GIP levels were measured in the present study. However, analogous to mice with chemical or genetic knockout of GIP or glucagon signalling(Reference Mu, Jiang and Brady27, Reference Miyawaki, Yamada and Ban28), compensatory increases in both may occur following active GIP immunisation. Although unlikely based on present data(Reference Miyawaki, Yamada and Ban28, Reference Gault, McClean and Cassidy29), immunisation against GIP may also affect circulating glucagon and pancreatic α-cell function. Thus, additional studies into these potential metabolic adaptations are required.
However, these data show that blockade of GIP action by GIP and (Pro3)GIP immunisation was linked to improved insulin sensitivity of peripheral tissue. This confirms the view that GIP promotes both hyperinsulinaemia and insulin resistance, as previously shown by the effects of genetic or chemical ablation of GIP receptor in mice with obesity–diabetes(Reference Miyawaki, Yamada and Ban12, Reference Irwin, McClean and O'Harte30, Reference McClean, Irwin and Cassidy31). The similarities between both immunisation groups in the present study are consistent with rapid binding of endogenously released GIP by circulating antibodies. Thus, despite active immunisation against GIP or (Pro3)GIP, the antibodies generated in both cases were capable of binding native GIP, as confirmed by ELISA assay. Moreover, in vitro and in vivo studies conclusively demonstrated that the ovalbumin-bound peptides did not possess any biological activity akin to their native counterparts, presumably due to stearic interference from the ovalbumin moiety with GIP receptor binding. Furthermore, given previous studies adopting essentially similar immunisation techniques in the same animal model, it is clearly evident that antibodies generated both bind and importantly neutralise the biological action of native GIP. Thus, the observed biological effects in both immunisation groups can be attributed directly to GIP-neutralising antibodies.
GIP is known to increase lipoprotein lipase activity and breakdown of circulating TAG, resulting in fatty acid uptake and intracellular TAG deposition in adipocytes(Reference Kim, Nian and McIntosh32). Blockade of GIP receptor effects by GIP or (Pro3)GIP immunisation should stimulate fatty acid uptake and rapid oxidation by muscle that lack GIP receptors(Reference Zhou, Yamada and Tsukiyama33). Thus, GIP and (Pro3)GIP immunised mice exhibited reduced circulating LDL-cholesterol levels compared to high-fat controls, with significantly lowered TAG levels in muscle and adipocyte tissue. These observations are largely reinforced by studies conducted using GIP receptor knockout mice(Reference Miyawaki, Yamada and Ban12, Reference Hansotia, Maida and Flock34) and previous GIP immunisation studies(Reference Irwin, McClean and Patterson17, Reference Montgomery, Irwin and Flatt18).
Active immunisation against GIP has previously been suggested to influence brain function and behaviour in rats(Reference Tian, Wang and Lin35). Moreover, a recent report suggests that genetic knockout of GIP receptors results in impaired cognition and learning in mice(Reference Faivre, Gault and Thorens36). These observations raise concern about possible adverse effects in the present study. However, we found no evidence for impairment of cognitive function, as illustrated from object recognition tests, in mice immunised against GIP or (Pro3)GIP. These differences could be due to the animal model employed, immunisation technique, age of animals, duration of study or other confounding factors such as the opportunity for life-long adaptations. Nonetheless, it should be noted that in the present study, high-fat feeding alone had no adverse effect on this aspect of cognitive function. However, given that GIP receptors are highly expressed in the brain, the possibility that GIP antibodies may lead to changes in brain function and behaviour necessitates further study(Reference Figueiredo, Pamplona and Mazzuco37). In addition, neuroendocrine mechanisms appear to exist that may contribute to a central regulation of GIP action and secretion(Reference Yavropoulou and Yovos38).
In the present study, active immunisation against GIP or (Pro3)GIP for 98 d was not accompanied by any changes in locomotor activity or energy expenditure. To date, a modest increase in motor activity has been reported in mice treated sub-chronically with the specific GIP receptor antagonist (Pro3)GIP(Reference McClean, Irwin and Cassidy31) and in GIP receptor knockout mice(Reference Hansotia, Maida and Flock34). GIP receptor knockout mice also exhibited a significant reduction of respiratory quotient without alterations in O2 consumption or CO2 production(Reference Miyawaki, Yamada and Ban12). These highlight the differences between life-long, as opposed to the current sub-chronic (98 d), ablation of GIP receptor signalling. Moreover, 42 d (d-Ala2)GIP(1–42) therapy was not associated with alterations in energy expenditure or respiratory exchange ratio(Reference Gault, Porter and Irwin19).
In conclusion, the present study has shown that active induction of GIP-neutralising antibodies was associated with significant improvements in metabolic status in high-fat-fed mice. Immunisation protocols were devoid of adverse effects and there was no alteration in body weight, energy expenditure or a marker of cognitive function. The similar beneficial consequences of active GIP and (Pro3)GIP immunisation, coupled with complete lack of intrinsic biological activity of both ovalbumin-bound peptide complexes, point towards the potential of antibodies directed against GIP as a therapeutic option for obesity-related insulin resistance and diabetes.
Acknowledgements
N. I. contributed to the design, data collection, analysis and writing of this manuscript. I. A. M. contributed to data collection, analysis and writing of the manuscript. P. R. F. contributed to the design, analysis and writing of this manuscript. N. I. and P. R. F. hold shares with Diabetica Limited. These studies were supported by the Department of Education and Learning, Northern Ireland, the SAAD Trading and Contracting Company and Innovation Ulster Limited.


