Major hurricanes (Category 3 to 5 on the Saffir-Simpson wind scale), previously rare in North America, are expected to become increasingly regular occurrences because of anthropogenic climate change (Knutson et al. Reference Knutson, McBride, Chan, Emanuel, Holland, Landsea, Held, Kossin, Srivastava and Sugi2010; Mann et al. Reference Mann, Rahmstorf, Kornhuber, Steinman, Miller and Coumou2017). Like any short-term weather event, these largest hurricanes are difficult to predict, but their effects are readily apparent in terms of damage from flooding and high winds. The 2017 hurricane season included a series of these powerful hurricanes that hit the western Atlantic and Caribbean in quick succession: Hurricanes Harvey (August 24–29), Irma (August 31–September 11), and Maria (September 17–28).
Hurricane Harvey made landfall on the Texas coast near Corpus Christi, moved eastward along the coast, and dumped an average of 1.02 m of rain on the city of Houston (Harris County Flood Control District; Figure 1). More than 100 people died as a result of the storm, and the scale of the property damage is estimated to be second only to the devastation brought by Hurricane Katrina to New Orleans in 2005 (Blake and Zelinsky Reference Blake and Zelinsky2018). Warmer oceans caused by increased greenhouse gasses translated directly to more rainfall during Hurricane Harvey and will likely do so for future storms as well (Trenberth et al. Reference Trenberth, Cheng, Jacobs, Zhang and Fasullo2018). Early analyses show that a warmer climate increased rainfall between 8% and 19% and that such events will be around three times more likely to occur during the next hundred years than during the previous hundred years (van Oldenborgh et al. Reference van Oldenborgh, van der Wiel, Sebastian, Singh, Arrighi, Otto, Haustein, Li, Vecchi and Cullen2017). Other estimates suggest an even higher frequency of massive storms. Extremely high rainfall events along the Texas coast (500+ mm) in the past could be expected once in about 100 years but may be expected every 3.5 to 16 years during the twenty-first century (Emanuel Reference Emanuel2017).
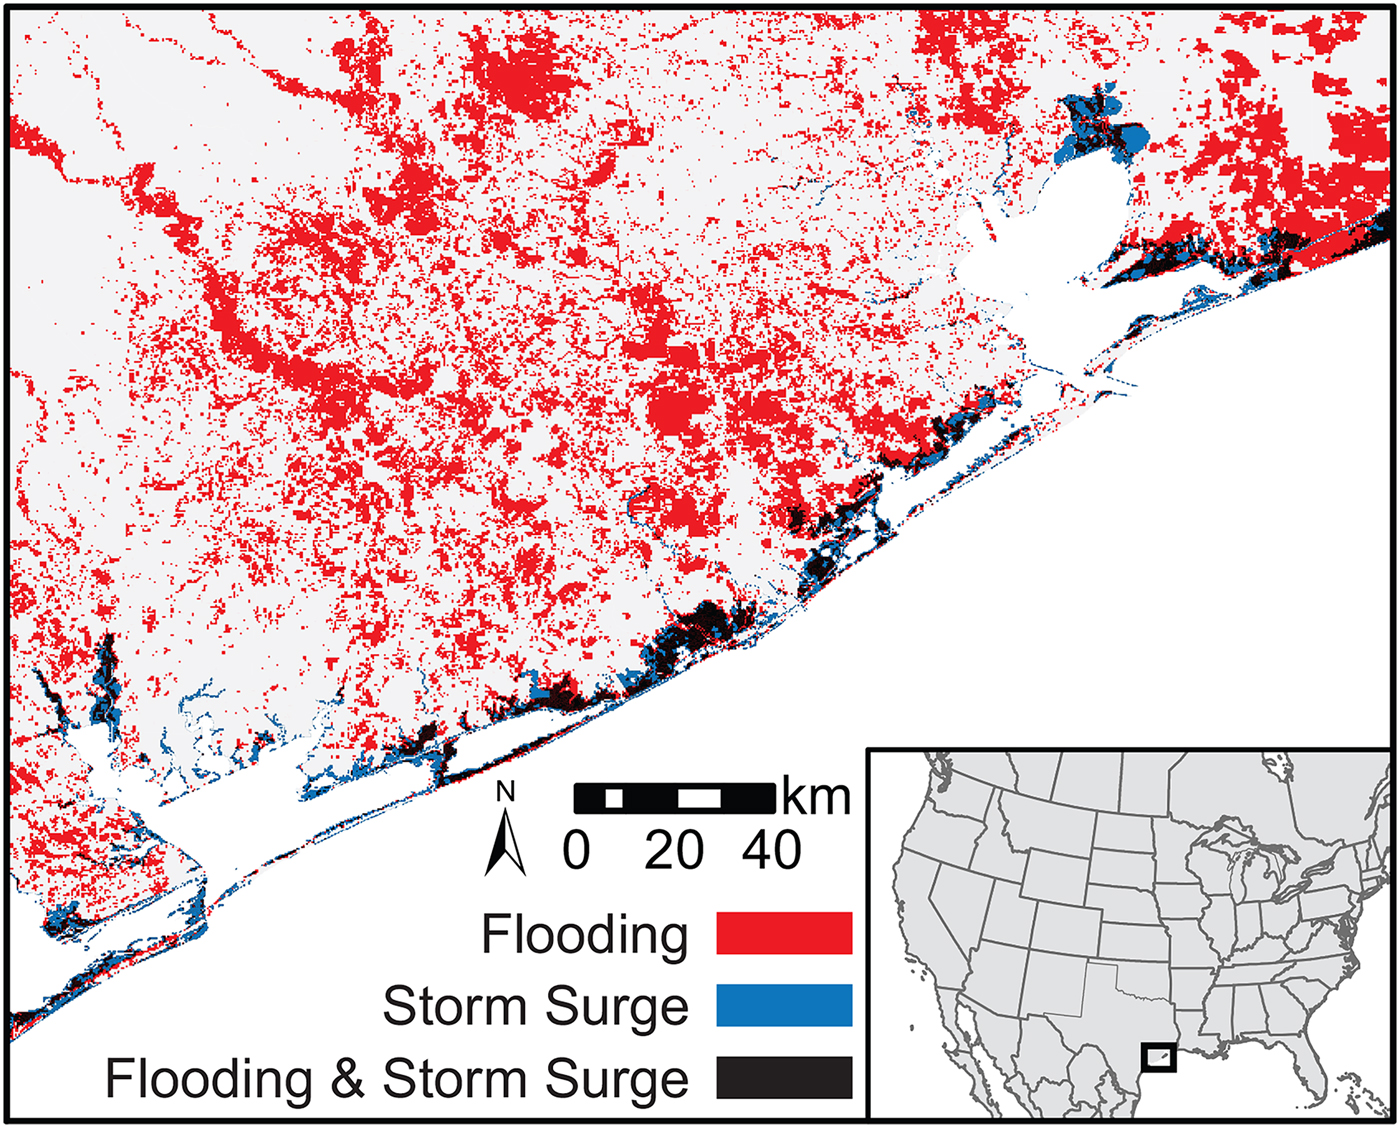
Track of Hurricane Harvey as mapped by the National Hurricane Center, storm surge in the Gulf of Mexico as modeled by the Coastal Emergency Risk Assessment and measured as maximum water height above mean sea level (left), and rainfall measurements made August 24–September 4, 2017, for the National Hurricane Center (right).

The past decade has seen a significant increase in the number of archaeologists concerned about the vulnerability of cultural heritage to climate change (e.g., Anderson et al. Reference Anderson, Bissett, Yerka, Wells, Kansa, Kansa, Myers, Carl DeMuth and White2017; Bickler et al. Reference Bickler, Clough and Macready2013; Cassar et al. Reference Cassar, Young, Weighell, Sheppard, Bomhard and Rosabal2006; Fatorić and Seekamp Reference Fatorić and Seekamp2017a, Reference Fatorić and Seekamp2017b; Fitton et al. Reference Fitton, Hansom and Rennie2016; Hambrecht and Rockman Reference Hambrecht and Rockman2017; Hutchings Reference Hutchings2016; McCoy Reference McCoy2018; Mourtzas and Marinos Reference Mourtzas and Marinos1994; Reeder-Myers Reference Reeder-Myers2015; Sabbioni et al. Reference Sabbioni, Brimblecombe and Cassar2010, among many others). Anderson and colleagues (Reference Anderson, Bissett, Yerka, Wells, Kansa, Kansa, Myers, Carl DeMuth and White2017), for example, used a simple method to evaluate archaeological site vulnerability to long-term climate change across the southeastern United States: elevation above mean sea level as a direct proxy for vulnerability to sea level rise. At just 1 m of sea level rise, more than 14,000 known sites along the coastline are predicted to be affected; that estimate grows to 32,567 sites with 5 m of sea level rise (Anderson et al. Reference Anderson, Bissett, Yerka, Wells, Kansa, Kansa, Myers, Carl DeMuth and White2017). Reeder-Myers (Reference Reeder-Myers2015) developed a more complex model to evaluate a wider range of climate and land-use risks to archaeological sites and applied it to three study areas, including parts of the Texas coast that were affected by Hurricane Harvey. This study predicted that 95 of 259 archaeological sites in a small part of the Texas coastal zone were vulnerable to sea level rise and associated aspects of twenty-first-century climate change (Reeder-Myers Reference Reeder-Myers2015).
These two studies, and most models of climate impacts, focus on gradual, long-term change, and so it remains unclear how well these same models identify archaeological sites vulnerable to serial impacts from major storm events, which by their nature are short-lived and geographically distinct (see also Bird Reference Bird1992; Ives et al. Reference Ives, McBride and Waller2017; O'Rourke Reference O'Rourke2017). Using Hurricane Harvey as an example, we test whether the two methods briefly outlined above—the simple model applied by Anderson and colleagues (Reference Anderson, Bissett, Yerka, Wells, Kansa, Kansa, Myers, Carl DeMuth and White2017) and the complex model applied by Reeder-Myers (Reference Reeder-Myers2015)—can be used to predict storm vulnerability. Although neither method was designed to predict storm impact, we expected that many of the same variables would determine vulnerability to short-term climate change and therefore that one or both would be effective in predicting the effects of Hurricane Harvey. We found that both long-term risk models do a surprisingly poor job of predicting which archaeological sites were flooded during Hurricane Harvey. We also individually assessed a number of variables that we expected to be associated with flooding, including elevation, distance to water and coastline, age of the site, and land use. These were largely ineffective as well, except that sites within more developed areas were less likely to be flooded. We discuss these findings and some of the barriers to post-storm assessment of damage to cultural heritage through remote sensing and make some modest proposals for better predicting and preparing for such damage in the future.
Data and Methods
The Dartmouth Flood Observatory provided maximum flood extent maps for southeast Texas based on satellite imagery (DFO Flood Event 4510), including the National Aeronautics and Space Administration's Moderate Resolution Imaging Spectroradiometer, ESA Sentinel-1, ASI COSMO-SkyMed, and RADARSAT-2 (Brakenridge and Kettner Reference Brakenridge and Kettner2018). We supplemented these with higher-resolution (35–50 cm ground sample distance) data from the National Oceanic and Atmospheric Administration, which collected aerial imagery of the coastal zone, the Houston metropolitan area, and major rivers from August 28 to September 3, 2017. These datasets are freely available to the public and were published within days or weeks of the event. To assess what role storm surge had, we used data provided by the Coastal Emergency Risk Assessment ADCRIC storm surge model, which provides models of water height above sea level throughout major storms.
Archaeological site data within the study area were provided by the Texas Archaeological Research Laboratory. These data include site descriptions and ages, which we used to place each site into simple temporal categories—prehistoric, historic, both, and unknown. Each site was also assigned a value for elevation (from the National Elevation Dataset), land cover (National Land Cover Dataset), the straight-line distance to the nearest coast, and the straight-line distance to the nearest stream or lake (Texas Commission on Environmental Quality). When archaeological sites were suspected to be underwater (i.e., they returned a null value for elevation, returned a negative value for distance to shoreline, or were placed in open water or emergent wetland land cover categories), they were checked against high-resolution orthorectified aerial imagery (National Agriculture Imagery Program) to see whether they were, in fact, underwater or offshore.
Because the storm made landfall just to the west of the study area, the overwhelming majority of flooding was due to rainfall. Nonetheless, the storm surge reached up to 3 m in Matagorda Bay and Galveston Bay (Figure 1). A number of known sites are within the modeled storm surge zone, which sometimes overlaps with flooding caused by rainfall. Although sites were therefore classified as flooded by rainfall, storm surge, or both, the combined flooding category is the most important. Finally, sites were classified according to whether or not they were located within a Federal Emergency Management Agency (FEMA) Special Flood Hazard Area.
Results
The study area (Figure 2) was defined by a minimum bounding polygon that encompassed both reported archaeological sites and observed flooding within the most heavily affected Texas counties: Brazoria, Calhoun, Chambers, Fort Bend, Galveston, Harris, Jackson, Jefferson, Liberty, Matagorda, Victoria, and Wharton. The area comprised 19,918 km2 of land and about 6,528 km2 of water, including major bays such as Galveston Bay and Matagorda Bay. Satellite image analyses indicated that just over one-third of the land was flooded (6,918 km2, 34.7%) by storm surge or rainfall during Hurricane Harvey. A slightly higher proportion of archaeological sites were affected—out of 2,336 known sites, 920 (39.4%) were flooded during the storm by a combination of storm surge and rainfall (Table 1). A small proportion, 10.1% (237 out of 2,336), was already submerged at the time. Prehistoric sites, which are more likely to be immediately adjacent to the coast and subject to storm surge, were flooded at a higher rate (45.7%) than historic (29.5%) or multicomponent (35.6%) sites (Table 1; Figure 3a).
Study area, showing the maximum extent of observed flooding as mapped by the Dartmouth Flooding Observatory and the storm surge as modeled by the Coastal Emergency Risk Assessment.
(a–f) Graphs showing the relative frequency of sites that were flooded by Hurricane Harvey, based on several different variables discussed in the text. Note that the 237 submerged sites were removed from these graphs to make flooding patterns more evident.

Summary of Flooding of Land and Archaeological Sites in the Study Area, Including Sites Divided by Period of Occupation.

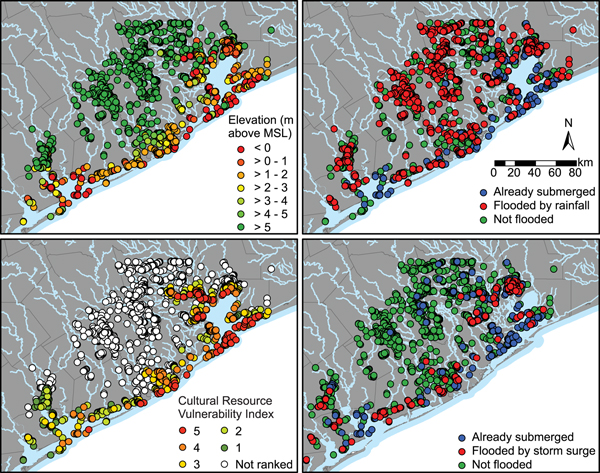
Site elevation was not closely correlated with flooding (Table 2; Figure 3b). Although sites at less than 1 m in elevation were extremely likely to be flooded (130 out of 240 sites, or 66.0%), sites at greater than 20 m elevation were also frequently flooded (355 out of 814 sites, 43.6%). Of the 920 sites flooded by Hurricane Harvey, only 385 were located at or below 5 m elevation—the other 535 may have been considered relatively safe, if using only elevation to predict vulnerability (e.g., Anderson et al. Reference Anderson, Bissett, Yerka, Wells, Kansa, Kansa, Myers, Carl DeMuth and White2017). On the other hand, elevation was an excellent predictor of flooding caused specifically by storm surge, with only five sites more than 5 m above mean sea level affected by storm surge (Table 2; Figure 4). Reeder-Myers's (Reference Reeder-Myers2015) Cultural Resource Vulnerability Index, which considers sites in developed land, closer to shorelines, and at lower elevations to be more vulnerable, performs even more poorly (Table 2; Figure 4). Of the 920 flooded sites, 586 would not have been classified at all by this measure, because they were more than 5 km from the coastline, and another 182 would have been categorized as falling in the low or lowest vulnerability category.
Archaeological sites classified according to elevation (top left; following Anderson et al. Reference Anderson, Bissett, Yerka, Wells, Kansa, Kansa, Myers, Carl DeMuth and White2017), Cultural Resource Vulnerability Index (bottom left; following Reeder-Myers Reference Reeder-Myers2015), Hurricane Harvey rainfall flooding status (top right), and storm surge flooding status (bottom right).
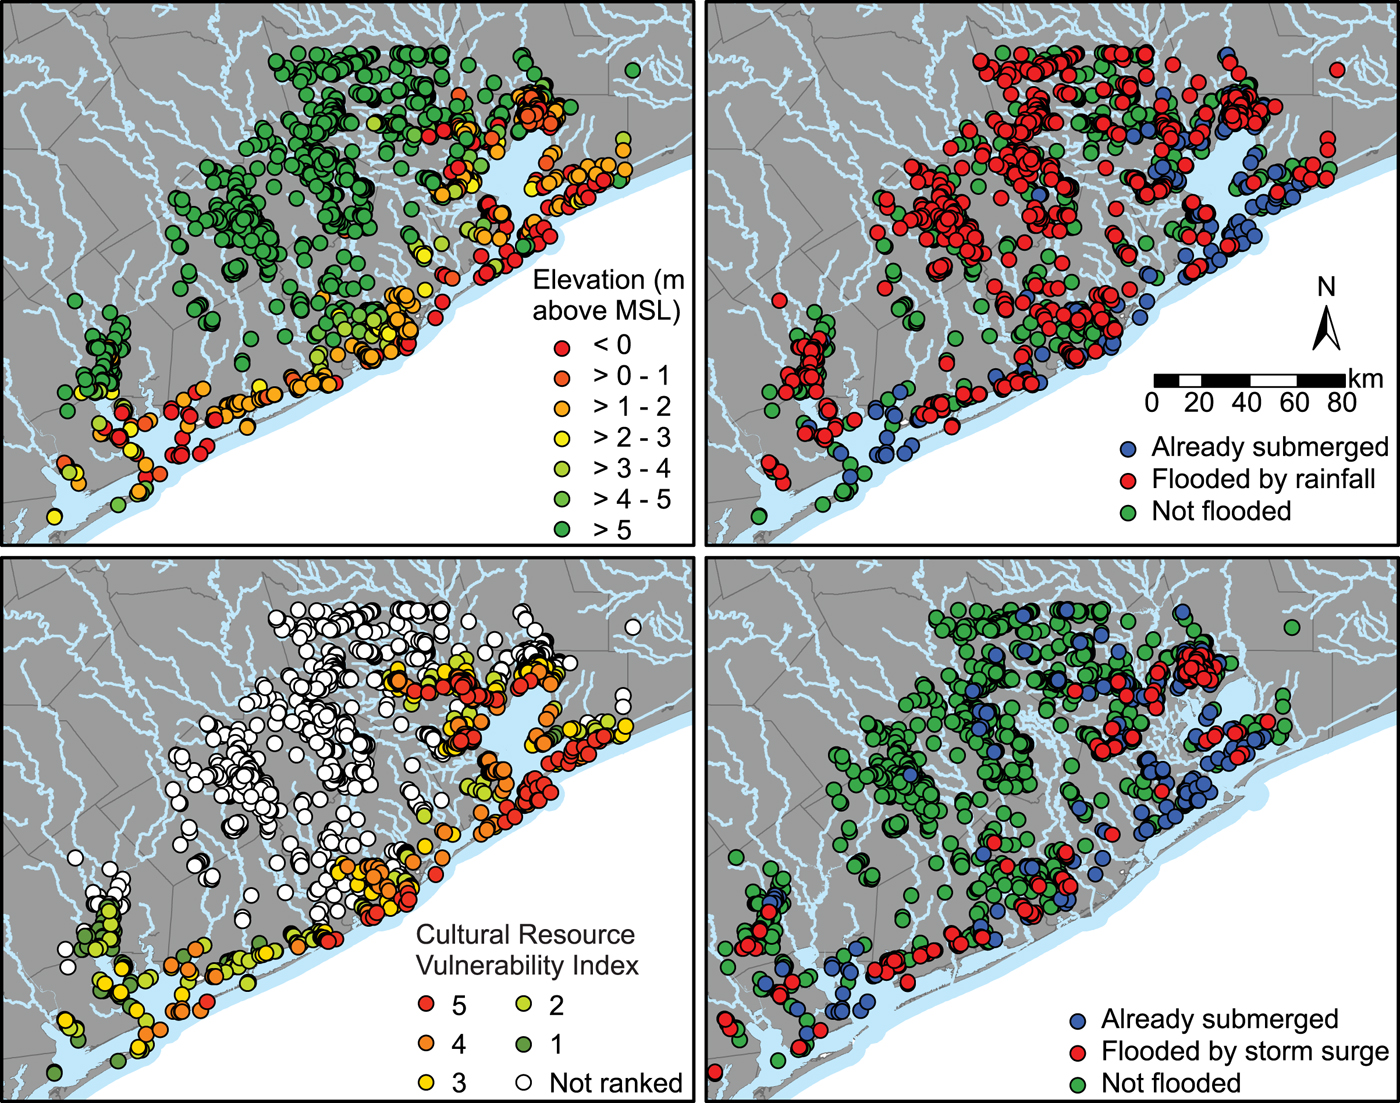
Summary of Flooding Based on Existing Studies of Archaeological Site Vulnerability, Including Elevation of Sites and the Cultural Resource Vulnerability Index.

a Following Anderson et al. Reference Anderson, Bissett, Yerka, Wells, Kansa, Kansa, Myers, Carl DeMuth and White2017.
b Following Reeder-Myers Reference Reeder-Myers2015.
More surprising, neither distance to the nearest coast nor distance to the nearest stream was strongly associated with flooding. Sites were equally likely to be flooded whether they were within 100 m of the coast or more than 5,000 m from the coast (Table 3; Figure 3c). Similarly, sites within 50 m of or more than 1,000 m from streams were flooded at almost the same rate (Table 3; Figure 3d). We expected FEMA's floodplain designation to be a more effective predictor. FEMA floodplain maps were not available for Matagorda, Brazoria, or Galveston Counties (except for Galveston Island), which excluded 510 sites. Of the remaining 1,826 sites, 1,133 were located in the floodplain, and 693 were not, but there was almost no difference in the frequency of flooding between these two groups. Of the sites located in a designated floodplain, 413 (36.5%) were flooded, while 289 (41.7%) of the sites outside the floodplain were also flooded (Table 4; Figure 3e).
Summary of Flooding by Distance of Sites to the Coastline and to the Nearest Freshwater or Tidal Stream.

Summary of Flooding by Government Agency Land Use Classifications, Including the National Land Cover Dataset and Federal Emergency Management Agency Special Flood Hazard Areas.

Land use is the only variable that we found to be associated with flooding. Generally, sites on land defined by the National Land Cover Dataset as “Developed” fared the best (only 146 of 549 sites, or 26.6%, flooded), compared with “Wildlands” (601 of 1,299 sites, or 46.3%, flooded), and the worst were on “Agricultural” land (157 of 279 sites, or 56.3%, flooded; Table 4; Figure 3f). If we look more closely at land designated as “Developed,” there is evidence to support the hypothesis that a combination of efforts to protect developed areas from flooding, and/or avoidance of areas known to flood, accounts for this finding. The most heavily developed areas were the least affected, with only 8.3% of sites flooded (6 out of 72 sites; Table 4). As the level of development decreased, the rate of flooding increased, from 17.7% to 28.3% to 38.3%. From the perspective of the actual number of sites flooded, the developed land is rather small, and in fact the higher occurrence of sites in wildlands means that almost twice as many total sites (n = 601) were flooded in these lands than in developed and agricultural areas combined. In fact, 65.3% of all flooded sites were in wildlands (601 out of 920 sites). Sites located in wetlands were especially vulnerable, with 226 of 347 sites (65.1%) in emergent wetlands flooded.
Discussion and Conclusion
Many archaeologists, including us, have placed a heavy emphasis on the threat that sea level rise and coastal erosion may destroy the cultural heritage of coastal regions around the world. This danger is both real and important, but it is neither the only nor perhaps the most immediate threat. Severe coastal storms affect sites tens or even hundreds of kilometers from the coast itself and can significantly damage archaeological sites over the course of just a few days (see also Bird Reference Bird1992; Ives et al. Reference Ives, McBride and Waller2017; O'Rourke Reference O'Rourke2017).
Remote sensing provides powerful tools to rapidly assess the impacts of major storms, but even as recently as Hurricanes Katrina and Sandy, these tools were not deployed in the immediate aftermath of the storms. After Hurricane Sandy in 2012, Ives and colleagues (Reference Ives, McBride and Waller2017) evaluated two stretches of Rhode Island coastline that were affected by the storm, using an approach similar to that used on the northeast coast of Australia 25 years earlier (Bird Reference Bird1992). They used funds from the National Park Service's Historic Preservation Fund program to perform intensive pedestrian survey and site testing, salvaging remarkable amounts of information about the cultural heritage of the Narragansett people. They also recommended that models such as Reeder-Myers's (Reference Reeder-Myers2015) study of three areas within the United States could be used to produce a unified, national strategy for responding to climate change. Our current research, however, suggests that the impacts of storms such as Hurricane Harvey are difficult to predict and therefore calls into question the value of modeling as an effective strategy when it comes to megastorms.
We expected several variables to be associated with higher rates of flooding along the Texas coast, especially distance to the nearest water, elevation, and location on the floodplain. Sites at extremely low elevations (<2 m) and sites in agricultural lands were the most likely to be flooded, while sites in developed areas were somewhat protected by urban flood control measures designed to protect people and property. Probably as a result of this protection, historic sites were less likely to be flooded than prehistoric sites. Offsetting this protection, historic sites that include standing houses or other structures may be more quickly and severely damaged by flooding when compared with prehistoric sites that have already survived many major storms. Distance to shoreline and distance to water were not well correlated with flooding, and sites on the floodplain were no more likely to flood than sites off the floodplain.
While it is important to develop plans for mitigating the impacts of superstorms, those plans must remain flexible and, like emergency relief plans for people and property, use all of the tools at hand. Funds available to state and tribal historic preservation offices in these situations are limited, and computer-based analyses using publicly available data can increase efficiency and help target areas that were hardest hit by storms. The use of remote sensing data will enhance the ability of archaeologists and cultural resource managers to respond to coastal disasters. In the case of Hurricane Harvey, ongoing projects using unmanned aerial vehicles and aerial lidar will be available in the near future and may become available more quickly after future storms.
Although the scalar models proposed by Reeder-Myers (Reference Reeder-Myers2015) and Anderson and colleagues (Reference Anderson, Bissett, Yerka, Wells, Kansa, Kansa, Myers, Carl DeMuth and White2017) may not be useful in these circumstances, regional-scale digital datasets such as the Digital Index of North American Archaeology are, in fact, of essential importance for both preparation and response (Anderson et al. Reference Anderson, Bissett, Yerka, Wells, Kansa, Kansa, Myers, Carl DeMuth and White2017). Although Hurricane Harvey's largest impact was in Texas, other Gulf Coast states were also affected, and many storms will cause damage across multiple administrative units, making a centralized repository essential for preparations and responses. We suggest a simple three-step approach to storm preparedness. First, prepare for future storms by gathering high-quality digital site data with the best geospatial information available and by identifying qualified people who can respond quickly (see McCoy Reference McCoy2017 for a recent discussion of the role of geospatial data in decision making in archaeology). Second, in the immediate aftermath of the storm, perform rapid analysis using remote sensing data, such as those described in this study, to identify areas that were hardest hit by the storm. Third, as soon as feasible, perform field research targeted on those areas, with the goal of assessing damage, collecting data, and aiding affected communities.
The burden of responding to these events often falls on cultural resource managers who rely on limited funding from government agencies that have many other priorities. It is essential that archaeologists in university and museum settings assist with this endeavor by providing expertise, labor, and, wherever possible, funding. Moreover, following the work done by Ives and colleagues (Reference Ives, McBride and Waller2017), descendant communities must be included in both preparing for and responding to storms and other disasters that affect their own cultural heritage.
Acknowledgments
We would like to acknowledge all the efforts, especially those by volunteers, to aid the people of Houston during Hurricane Harvey. Thank you to the Texas Archaeological Research Lab, especially Jonathan H. Jarvis, for help accessing site data. This study was greatly improved by reviewers’ comments.
Data Availability Statement
All data used in this report are publicly available through the appropriate government agency. At the time of publication, datasets were available at the following websites:
• Dartmouth Flood Observatory for satellite-based flood data: https://floodobservatory.colorado.edu/Events/2017USA4510/2017USA4510.html
• National Oceanic and Atmospheric Administration Aerial Imagery for additional flood data: https://storms.ngs.noaa.gov/storms/harvey/index.html#7/28.400/-96.690
• National Oceanic and Atmospheric Administration National Hurricane Center for rainfall and storm track information: ftp://ftp.nhc.noaa.gov/atcf
• Coastal Emergency Risk Assessment for storm surge data: https://cera.coastalrisk.live
• National Elevation Dataset, National Land Cover Dataset, and National Agriculture Imagery Program, all available through the US Geological Survey National Map: http://www.nationalmap.gov
• Texas Commission on Environmental Quality for geospatial stream and coastline data: https://www.tceq.texas.gov/gis/download-tceq-gis-data/
• Federal Emergency Management Agency's National Flood Hazard Layer data: https://www.fema.gov/national-flood-hazard-layer-nfhl