

Hepatic steatosis is the initial stage of chronic non-alcoholic fatty liver disease (NAFLD), and it is characterised by a single large fat droplet that displaces the nucleus or smaller intracytoplasmic droplets(Reference Mulhall, Ong and Younossi1). The steatosis may be attributed to (1) excessive dietary fat intake; (2) hepatocellular abnormal de novo lipogenesis; (3) a surplus supply of NEFA or proinflammatory cytokines released from the adipose tissue.
Recent studies have demonstrated that NAFLD and its necroinflammatory form, non-alcoholic steatohepatitis, are deeply associated with visceral adiposity, adipose tissue inflammation(Reference Targher, Bertolini and Scala2) and various adipocytokines(Reference Ikejima, Okumura and Kon3). The relationship between NAFLD and visceral fat is based partially on the mechanism by which the obesity-induced infiltration of macrophages into adipose tissue stimulates the release of proinflammatory cytokines including TNFα, IL-6 and IL-1β, thereby impairing insulin signalling, stimulating lipolysis and eventually increasing the secretion of NEFA from adipose tissue(Reference Weisberg, McCann and Desai4, Reference Zhang, Halbleib and Ahmad5). NEFA are then taken up by the liver, which activates nuclear factor χB (NFχB) that functions as the master regulator of proinflammatory cytokines and/or increases oxidative stress via NEFA oxidation whereby insulin receptor substrate-2 serine phosphorylation instead of tyrosine phosphorylation occurs, and subsequently induces hepatic insulin resistance, a risk factor of NAFLD(Reference Cai, Yuan and Frantz6, Reference Feldstein, Werneburg and Canbay7).
Additionally, anti-steatotic leptin and anti-inflammatory adiponectin have been shown to be involved in NAFLD. In animal models, leptin and adiponectin prevent lipid accumulation in non-adipose tissue. Particularly in the liver, this effect is achieved by increasing fatty acid β-oxidation(Reference Huang, Dedousis and Bandi8, Reference You, Considine and Leone9) and lowering the expression of sterol-regulatory element-binding protein (SREBP)-1, a key regulator of fatty acid synthesis(Reference You, Considine and Leone9, Reference Gallardo, Bonzon-Kulichenko and Fernandez-Agullo10). Furthermore, adiponectin has a protective role in liver inflammation and fibrosis. Using mouse model with endotoxin-induced acute liver injury or CCl4-induced liver fibrosis, it was shown that adiponectin attenuates hepatic injury or hepatic stellate cells formation by inhibiting the synthesis and/or release of TNFα(Reference Xu, Wang and Keshaw11).
Phytoestrogen genistein is a bioactive molecule which exists as a nutritional constituent of commonly consumed soyabeans. Genistein has been proposed to maintain health status against fat deposition(Reference Penza, Montani and Romani12), CVD, cancer and osteoporosis(Reference Tham, Gardner and Haskell13) via an oestrogenic/anti-oestrogenic response in target tissues.
We reported previously that genistein prevented NAFLD by accelerating hepatic lipid catabolism via the up-regulation of uncoupling protein-2, PPARγ coactivator-1 and l medium-chain acyl-CoA dehyrogenase, and by enhancing the activity of GSH peroxidase, a major antioxidant enzyme(Reference Lee, Choi and Kim14). However, this molecular approach focused on hepatic metabolism, and has not been conducted with regard to fat metabolism. It remains unknown as to whether genistein influences hepatic steatosis via the regulation of visceral fat. Thus, we attempted to determine whether the inhibitory effect of genistein on NAFLD is associated with visceral adipocyte metabolism using mice with high fat-induced NAFLD.
Experimental methods
Experimental animals and diets
C57BL/6J mice, a good model for investigating metabolic syndrome(Reference Surwit, Feinglos and Rodin15–Reference Mills, Kuhn and Feinglos17), were obtained from the Seoul National University Animal laboratories (Seoul, South Korea), and were individually housed in animal facilities maintained at 22 ± 2°C under a 12 h light:dark cycle (light period: 06.00–18.00 hours). Three-week-old C57BL/6J male mice (approximate body weight (BW) 20·1 g) were assigned randomly to five dietary groups (eighteen animals per group): the normal-fat (NF) diet, high-fat (HF) diet and an HF diet supplemented with genistein (1, 2 and 4 g/kg diet). The diets were based on a modification of the AIN 93-G Composition(Reference Reeves, Nielsen and Fahey18). The HF diet contained 36 % fat of the total energy than the NF diet which contained lower fat (16 % fat of the total energy). Genistein (BioSpectrum Limited, Seoul, South Korea) was substituted for equivalent maize starch in the HF diet (Supplemental Table S1, available online at http://www.journals.cambridge.org/bjn).
The dosage utilised in the present study was selected on the basis of our preliminary quantification of plasma genistein via HPLC–MS detection. This dosage generated a plasma genistein level of approximately 4·1 μm, similar to that observed in human subjects consuming a diet containing soya products(Reference Adlercreutz, Markkanen and Watanabe19–Reference Setchell, Zimmer-Nechemias and Cai21); this is a level that has been demonstrated to exert biological effects in vivo and in vitro (Reference Wanger, Cafalu and Anthony22, Reference Dang, Audinot and Papapoulos23).
Mice had free access to food and distilled water. Food intake and BW were recorded every other day.
Sample collection and biochemical analysis
After overnight food deprivation, all the mice were weighed and anesthetised with ketamine hydrochloride (60 mg/kg BW). Blood was collected via orbital venous plexus, after which mice were immediately killed.
Livers and adipose tissues were perfused in situ with ice-cold saline, and then weighed. Two portions (1 g each) from the liver and adipose tissues were frozen immediately in liquid N2 and stored at − 80°C until used for the analysis of lipid profiles and RNA, respectively. Another portion was stored in 10 % formalin for histological study. Serum was prepared via 20 min of centrifugation of blood samples at 3000 rpm at 4°C, and stored at − 80°C until analysis.
Serum total cholesterol, TAG, NEFA, alanine aminotransferase (ALT) and aspartate aminotransferase (AST) were determined via enzymatic and colorimetric methods using the manual of the commercially available kits: total cholesterol, A570 nm (BioVision, Mountain View, NC, USA); TAG, A540 nm (Sigma, St Louis, MO, USA); NEFA, A540 nm (Zen-Bio, Research Triangle Park, NC, USA); ALT, A340 nm, (Sigma); and AST A340 nm (Sigma). HDL-cholesterol and LDL-cholesterol were measured using an automatic dry chemistry analyser, Spotchem (Daiichi Kagaku, Tokyo, Japan).
For hepatic lipid analysis, the hepatic total lipids were extracted with a mixture of chloroform–methanol (2:1, v/v)(Reference Bligh and Dyer24), after which TAG and total cholesterol were measured with the extract of total lipids using the enzymatic and colorimetric methods described earlier.
Histological analysis of liver and adipose tissue
Liver and visceral fat pads were fixed in 10 % phosphate-buffered formalin, embedded in paraffin and sliced into 3 μm sections. The sections were stained with haematoxylin for negatively charged nucleic acids, counterstained with eosin for protein staining and then coverslipped with DPX (BDH, Poole, UK). The images were captured on a confocal microscope (Nikon, Eclipse TE 200, Tokyo, Japan).
Hepatic steatosis was graded as 0 (no fat), 1 (fatty hepatocytes occupying < 33 %), 2 (fatty hepatocytes occupying 33–66 %) and 3 (fatty hepatocytes occupying>66 %) according to the percentage of hepatic fat droplets(Reference Bruno, Dugan and Smyth25, Reference Tsochatzis, Papatheodoridis and Manesis26). Adipocyte numbers were calculated by counting the nuclei in a fixed field area (0·9 mm2) at 100 × magnification. Adipocyte sizes were calculated via the following formula(Reference Ashwell, Priest and Bondoux27):
where A is the defined area, m is the final magnification of photograph and n is the number of cells counted. In all the samples, at least five different fields of four different tissue sections were evaluated.
Total RNA extraction and real-time PCR
Total RNA of visceral fat was extracted using TRIzol reagent (Invitrogen, Carlsbad, CA, USA) and RNeasy Mini Kit (Qiagen, Valencia, CA, USA). Total RNA (2 μg) was reverse transcribed in 20 μl of reaction mixture (Invitrogen) containing Moloney Murine Leukemia Virus RT (200 U/μl), RNAase inhibitor (2 U/μl), 0·5 mm-MgCl2, 0·01 mm-dithiothreitol, 2·5 μm-oligo(dT)20 and 0·5 mm-dNTP. The RNA in the reaction mixture was denatured for 5 min at 65°C and annealed at 25°C for 10 min, and then complementary DNA was synthesised for 50 min at 85°C.
For the relative quantification of gene expression, real-time PCR was performed using a Biosystem 7500 (ABI, Carlsbad, CA, USA) real-time PCR system. Five hundred nanograms of complementary DNA were amplified using a 25 μl SYBR Green PCR master mix (ABI) containing SYBR Green 1 dye, AmpliTaq Gold DNA polymerase, dNTP and 2 pmol primer for target genes. Thermal cycling parameters were as follows: one cycle for 2 min at 50°C (for the prevention of primer–dimer generation), one cycle for 10 min at 95°C (for the activation of DNA polymerase) and forty cycles for 15 s at 95°C (for denaturation) and for 1 min at 60°C (for annealing/extension), and a final one cycle for 15 s at 95°C, 20 s at 60°C and 15 s at 95°C (for dissociation curve). The primers for oestrogen receptor (ER)α/β, PPARα/γ, leptin, adiponectin, 5′-AMP-activated protein kinase, ACC2, liver X receptors (LXR)α, retinoid X receptor (RXR)α, SREBP-1c, CCAAT/enhancer-binding proteins (C/EBP)β and very long-chain acyl CoA dehydrogenase are listed in (Supplemental Table S2, available online at http://www.journals.cambridge.org/bjn).
The comparative method of relative quantification(2− ΔΔCt) was utilised in order to calculate the relative expression levels of each target gene (normalised to β-actin). ΔΔC t represents ΔCthigh-fat or genistein diet group − ΔCtnormal-fat diet group, and all primer sets were designed using the Primer Express Software included in the 7500 system.
Statistical analysis
General data are expressed as the means with their standard errors, and were analysed via one-way ANOVA followed by Duncan's multiple range test. Real-time RT-PCR data were analysed via one-way ANOVA with Dunnett's multiple range test. In order to determine the degree of the correlation between NAFLD-related parameters and hepatic steatosis, general linear regression analysis and Pearson's product–moment correlation were performed.
The statistical analysis was conducted using Statistical Analysis Software Proprietary Software Release 8.2 (SAS Institute, Inc., Cary, NC, USA), and P < 0·05 were considered statistically significant.
Ethical approval
The procedures involving animals and their care were conducted in accordance with the guidelines of the Institutional Animal Care and Use Committee of the Seoul National University, which are in compliance with the national and international laws and policies (National Institutes of Health Guide for Care and Use of Laboratory Animals, 1996 (7th edition)).
Results
Body weight, fat mass and food intake
As shown in Table 1, C57BL/6J mice fed on an HF diet for 12 weeks gained more BW (14 %, P < 0·05) than mice fed on an NF diet, but mice fed on a genistein-supplemented diet evidenced a reduction in the BW gain in a dose-dependent manner (P < 0·05). We noted no significant differences in food intake. Mice fed on the HF diet evidenced a marked increase in visceral (163 %, P < 0·05) and perirenal (93 %, P < 0·05) fat mass than mice fed on the NF diet, and this was reversed by genistein supplementation in a dose-dependent manner (P < 0·05). BW-adjusted visceral ( ≥ 108 %, P < 0·05) and perirenal ( ≥ 96 %, P < 0·05) fat mass also evidenced a pattern that was similar to that of the fat mass described earlier.
(Mean values with their standard errors, n 18)
HF, high fat; NF, normal fat.
a,b,c,d Mean values within a row with unlike superscript letters were significantly different (Duncan's test; P < 0·05).
* The change in BW, food intake and fat mass in mice fed on NF diet, HF diet and HF diet supplemented with genistein (1, 2 and 4 g/kg diet) is given.
Interestingly, genistein supplementation (2 and 4 g/kg diet) caused BW losses that were higher than those observed with the NF diet. However, the alteration of skeletal muscle or testis weight by feeding genistein supplementation (2 and 4 g/kg diet) was not observed in the present study (data not shown).
Serum and liver lipid profiles
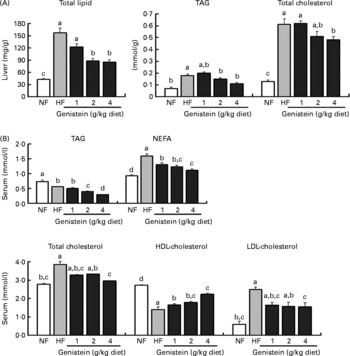
As shown in Fig. 1, mice fed on the HF diets evidenced higher serum total cholesterol (39 %, P < 0·05), NEFA (71 %, P < 0·05) and LDL-cholesterol (313 %, P < 0·05) levels than mice fed on an NF diet, whereas they evidenced lower TAG (38 %, P < 0·05) and HDL-cholesterol (49 %, P < 0·05) levels than mice fed on the NF diet. These results were reversed principally by genistein supplementation (4 g/kg diet) (P < 0·05). Hepatic total lipid, TAG and cholesterol were increased by 275, 157 and 369 % in the HF diet-fed mice, respectively, than in the NF diet-fed mice (P < 0·05). These increments were lowered primarily by genistein supplementation (4 g/kg diet) (P < 0·05).
Serum and liver lipid profiles altered by genistein supplementation. Lipid profiles in (A) liver and (B) serum of mice fed on normal-fat (NF) diet, high-fat (HF) diet and HF diet supplemented with genistein (1, 2 and 4 g/kg diet). All data are indicated as means with their standard errors (n 18 per diet group). a,b,c Mean values with unlike letters were significantly different (Duncan's test; P < 0·05).
Histological analysis and injury markers in liver
As shown in Fig. 2(A), the liver histology degree assay revealed that the HF diet increased hepatocellular macrovesicular vacuolation as a result of lipid accumulation, swollen hepatocytes and stimulated hydropic degeneration. These changes were ameliorated by genistein supplementations in a dose-dependent manner.
Histological analysis of liver and adipose tissue. The liver and adipose tissues of mice fed on normal-fat (NF) diet, high-fat (HF) diet and HF diet supplemented with genistein (1, 2 and 4 g/kg diet) were stained via haematoxylin–eosin staining (four or five animals per diet group) for histological analysis. (A) Microscopic picture of liver (original magnification, 200 × ; scale bar, 50 μm) and adipose tissue (original magnification, 100 × ; scale bar, 100 μm); (B) adipocyte numbers and sizes (n 4) based on histological examination; (C) aspartate aminotransferase (AST) and alanine aminotransferase (ALT) for determining liver dysfunction (n 6 per diet group). All data are indicated as means with their standard errors. a,b,c Mean values with unlike letters were significantly different (Duncan's test; P < 0·05).
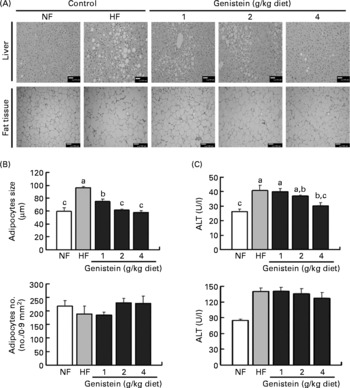
When liver specimens were graded as 0, 1, 2 and 3 according to the percentage of hepatic fat droplets(Reference Bruno, Dugan and Smyth25, Reference Tsochatzis, Papatheodoridis and Manesis26), the liver of genistein supplementation (4 g/kg diet)-fed mice displayed a score that was similar to that displayed by the liver of the NF diet-fed mice. These results showed a similar pattern in serum ALT levels, but not in AST levels, which is associated with the evidence that ALT, but not AST, has a positive relationship with hepatic lipid accumulation(Reference Schindhelm, Diamant and Dekker28). Actually, ALT (56 %, P < 0·05) was elevated in mice fed on the HF diet, and this elevation was again restored in mice fed on a genistein supplementation diet (4 g/kg diet) to the degree observed in mice fed on the NF diet (P < 0·05). However, AST was not altered by both the HF diet and genistein supplementation (Fig. 2(C)).
Histological analysis of adipose tissue
Our stereological examination of adipocytes showed that HF diet-induced hypertrophy (61 %, P < 0·05), i.e. enlargement of adipocytes, was a major contributor to the striking increase in visceral fat mass that was observed in mice fed on the HF diet (Fig. 2(A)), and this morphology was normalised by genistein supplementation in a dose-dependent manner (Fig. 2(B)) (P < 0·05). However, the HF diet and genistein supplementation did not influence the hyperplasia of adipocytes, i.e. increase in adipocyte number (Fig. 2(B)).
Genes involved in fatty acid β-oxidation and adipogenesis in adipose tissue
The morphological change in visceral fat may be associated with the imbalanced harmony of genes involved in fatty acid β-oxidation and adipogenesis.
As shown in Fig. 3(A), mice fed on the HF diet evidenced lower levels of expression of genes that activate fatty acid β-oxidation, including ERα and 5′-AMP-activated protein kinase (P < 0·05). However, genistein supplementation (2 and 4 g/kg diet) reversed these alterations and augmented the expressions of these genes, which led to the normalisation of the expression of ACC2, an inhibitor of fatty acid β-oxidation(Reference Abu-Elheiga, Matzuk and Abo-Hashema29). Other activators of fatty acid β-oxidation, PPARα and its target gene very long-chain acyl CoA dehydrogenase(Reference Reddy and Hashimoto30), were also augmented in mice fed on the genistein supplementation diet (2 and 4 g/kg diet), but not on an HF diet, than in those fed on the NF diet (P < 0·05). Interestingly, ERβ was increased in mice fed on the HF diet, which may be associated with compensatory action regarding the reduction of ERα observed in ERα-null mice(Reference Naaz, Zakroczymski and Heine31).
Alteration of adipocyte metabolism by genistein supplementation. (A) mRNA levels of genes involved in fatty acid β-oxidation, oestrogen receptor(ER)α, ERβ, PPARα, 5′-AMP-activated protein kinase (AMPK), very long-chain acyl CoA dehydrogenase (VLACAD) and acetyl CoA carboxylase (ACC)2. (B) mRNA levels of genes involved in adipogenesis, liver X receptor (LXR)α, sterol-regulatory element-binding protein (SREBP)-1c, CCAAT/enhancer-binding protein (C/EBP)β, PPARγ and retinoid X receptor (RXR)α. Data are expressed as means with their standard errors (n 3–5). mRNA levels were determined via real-time RT-PCR, and normalised to mRNA expression of β-actin, where the values for the normal-fat (NF) diet were set at 1·0. a,b,c Mean values with unlike letters were significantly different (Duncan's test; P < 0·05). * Mean values were significantly different from those of the control (NF) group (Dunnett's test; P < 0·05). HF, high fat.
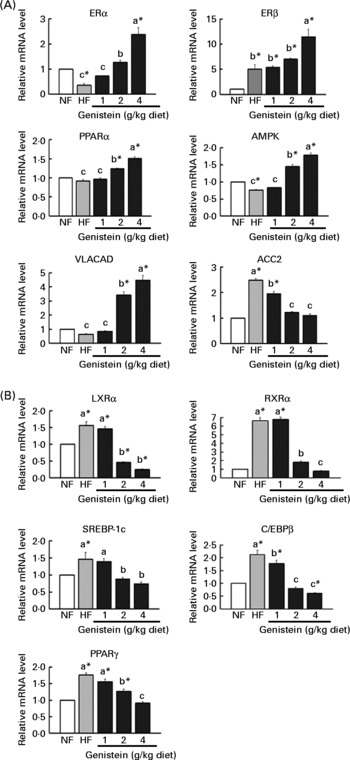
On the other hand, mice fed on the HF diet evidenced 1·5–6·6-fold higher levels of expression of lipogenic or adipogenic transcription factors, including RXRα, LXRα, SREBP-1c, C/EBPβ and PPARγ, than those fed on the NF diet (P < 0·05). However, genistein supplementation (2 and 4 g/kg diet) normalised or further down-regulated these alternations (P < 0·05) (Fig. 3(B)).
Considering these results, genistein supplementation (2 and 4 g/kg diet) appears to reduce fat deposition, via the activation of fatty acid β-oxidation or the inhibition of adipogenesis and lipogenesis.
TNF-α, leptin and adiponectin
Adipose tissues release a variety of adipocytokines, including TNFα, leptin and adiponectin, which are associated with hepatic insulin resistance, inflammation and fibrogenesis.
Among them, TNFα, a stimulator of hepatic fibrogenesis, inflammation(Reference Ikejima, Okumura and Kon3) and insulin resistance(Reference Cai, Yuan and Frantz6), was augmented by a 3·9-fold level of expression in mice fed on the HF diet than in mice fed on the NF diet, but was again reduced by genistein supplementation in a dose-dependent manner (P < 0·05) (Fig. 4). This reduction may be attributable to the increase in the expression of adiponectin, which functions as an anti-fibrogenic and anti-inflammatory cytokine. Adiponectin expression was reduced by 1·2-fold in mice fed on the HF diet than in those fed on the NF diet, but was increased by genistein supplementation (2 and 4 g/kg diet) than by the NF diet (P < 0·05) (Fig. 4).
Regulation of (a) adiponectin, (b) leptin and (c) TNFα by genistein supplementation. mRNA levels of adiponectin, leptin, TNFα in the adipose tissues of mice fed on normal-fat (NF) diet, high-fat (HF) diet and HF diet supplemented with genistein (1, 2 and 4 g/kg diet). Data are expressed as means with their standard errors (n 3–5). mRNA levels were determined with real-time RT-PCR, and normalised to mRNA expression of β-actin, where the values for the NF diet were set at 1·0. a,b,c Mean values with unlike letters were significantly different (Duncan's test; P < 0·05). * Mean values are significantly different from those of the control (NF) group (Dunnett's test; P < 0·05).
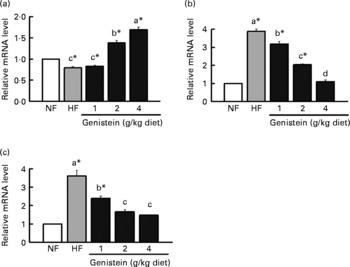
Unexpectedly, the expression of leptin, a inhibitor of hepatic TAG synthesis(Reference Huang, Dedousis and Bandi8, Reference Gallardo, Bonzon-Kulichenko and Fernandez-Agullo10), was down-regulated via genistein supplementation ( ≥ 1 g/kg diet) than by the HF diet (Fig. 4), which may be related to the reduction of fat mass or the impairment of insulin signalling by genistein supplementation, considering that genistein operates as a tyrosine kinase inhibitor(Reference Szkudelski, Nogowski and Pruszynska-Oszmalek32).
Collectively, the progress of simple steatosis into non-alcoholic steatohepatitis may be blocked through the suppression of TNFα and the augmentation of adiponectin by genistein supplementation.
Correlation between hepatic steatosis and non-alcoholic fatty liver disease risk factors
In the linear regression analysis (Table 2), BW, fat mass, adipocyte size, LDL-cholesterol, leptin and TNFα were correlated positively with hepatic steatosis, whereas HDL-cholesterol was correlated negatively with hepatic steatosis.
Correlation between hepatic steatosis and non-alcoholic fatty liver disease-related parameters
* P < 0·05, ** P < 0·01 and *** P < 0·001 indicate significant correlation with hepatic steatosis.
Among them, the visceral fat (Pearson's correlation coefficient R 0·77) and proinflammatory cytokine TNFα (Pearson's correlation coefficient R 0·62) were the strongest risk factors in NAFLD development, and these findings suggest that the inhibitory effects of genistein on NAFLD may originate principally from the diminution of visceral fat mass and the reduction of inflammation.
Discussion
In the present study, C57BL/6J mice fed on the HF diet gained BW, increased fat mass, and evidenced elevated levels of serum and liver lipids (P < 0·05). The increase in fat mass is attributable to the acceleration of lipogenic or adipogenic processes via ACC2, LXRα, SREBP-1c, PPARγ and RXRα, or the inhibition of the catabolic process via ERα and 5′-AMP-activated protein kinase. Moreover, the consumption of an HF diet up-regulated the expression of proinflammatory TNFα and down-regulated the expression of anti-inflammatory adiponectin.
These physiological and molecular changes induced features of NAFLD (Fig. 2(A)), including macrovesicular hepatocellular vacuolation, hepatocyte swelling and hydropic degeneration, along with a significant elevation of the liver disease marker, ALT (Fig. 2(C)). The HF diet-induced alterations run parallel with the evidence that high fat contributes to the progression of NAFLD in either obese rats with preexisting steatosis or normal human subjects without steatosis(Reference Carmiel-Haggai, Cederbaum and Nieto33).
However, these unfortunate features were reversed by supplementing genistein-containing diet, 2 and 4 g/kg diet, but not 1 g/kg diet (P < 0·05). Especially, genistein supplementation (2 and 4 g/kg diet) led to BW losses that were higher than those observed with the NF diet. This result was similar to those observed in female and male C57BL/6J mice that had received daily oral doses of genistein (200 000 μg/kg BW)(Reference Penza, Montani and Romani12), even if the dose (approximately 330 000–400 000 μg/kg BW) of genistein utilised in the present study was slightly higher. This loss of BW resulted from a remarkable reduction of fat mass, but not from toxicity of genistein, because genistein did not change skeletal muscle weight or affect testis development at any concentration(Reference Penza, Montani and Romani12). In the present study, skeletal muscle or testis weight was not altered by genistein supplementation.
In addition, our findings coincided with the outputs of plenty of studies: a 0·1 % isoflavone mixture including genistein, daidzein and glycetin has been shown to reduce BW in lean and obese male spontaneously hypertensive/N rats(Reference Ali, Velasquez and Hansen34); the consumption of a casein-based diet supplemented with pure genistein for 21 d reduced the contents of blood and liver TAG in rats(Reference Demonty, Lamarche and Deshaies35); and genistein (2/kg diet) inhibited hepatic fat accumulation in obese C57BL/6J mice(Reference Lee, Choi and Kim14). These anti-steatotic or hypolipidaemic effects of genistein may be attributed to the increase in hepatic LDL receptor activity(Reference Kirk, Sutherland and Wang36), the inhibition of hepatic glucose conversion to lipids(Reference Nogowski, Mackowiak and Kandulska37) or the up-regulation of hepatic catabolic genes including uncoupling protein-2, PPARγ coactivator-1 and medium-chain acyl-CoA dehyrogenase, as shown in our previous study(Reference Lee, Choi and Kim14).
However, recent studies have shown that NAFLD and its necroinflammatory form, non-alcoholic steatohepatitis, are closely associated with abnormal visceral adiposity, adipose tissue inflammation(Reference Targher, Bertolini and Scala2) and a variety of adipocytokines (leptin, adiponectin and TNFα)(Reference Ikejima, Okumura and Kon3). An epidemiological research indicated that Asians have a prevalence of NAFLD (16–42 % by imaging modalities and 15–39 % of liver biopsies) that is similar to that exhibited by North Americans and Europeans, despite the smaller BMI values than are observed in North Americans and Europeans. The reason is that Asians have a high proportion of central obesity than Europeans(Reference Fan, Saibara and Chitturi38).
Indeed, in our regression analysis between NAFLD-related parameters and NAFLD, visceral fat mass was the first risk factor of NAFLD. By the way, in the present study, phytoestrogen genistein supplementation (2 and 4 g/kg diet) reduced visceral fat mass (mg/100 g BW) (Table 1), which is consistent with the results of other studies; genistein reduced fat mass in ovariectomised female mice and inhibited adipocyte differentiation in 3T3-L1 cells(Reference Hwang, Park and Shin39).
This reduction of visceral fat mass resulted from the activation of fatty acid β-oxidation and the inhibition of adipogenesis or lipogenesis (Fig. 3). Genistein (2 and 4 g/kg diet)-augmented ERα and ERβ, a major target gene of genistein, increased its target gene PPARα expression, which stimulates mitochondrial fatty acid β-oxidation(Reference Reddy and Hashimoto30) through acyl CoA synthetase, carnitine palmitoyltransferase-I and VLCAD. Indeed, the expression of very long-chain acyl CoA dehydrogenase was augmented by genistein supplementation (2 and 4 g/kg diet) (P < 0·05). Moreover, genistein supplementation (2 and 4 g/kg diet) enhanced the expression of 5′-AMP-activated protein kinase responsible for the inactivation of ACC(Reference Carlson and Kim40, Reference Ruderman and Prentki41). ACC provides malonyl CoA for fatty acid synthesis and inhibits carnitine palmitoyltransferase-1 that transports fatty acids into mitochondria for β-oxidation(Reference Ruderman and Prentki41). Interestingly, the consumption of the HF diet up-regulated the expression of ERβ, unlike ERα, which appears to be a compensatory mechanism for the down-regulation of ERα. This compensatory mechanism has also been shown in ERα-knockout mice(Reference Naaz, Zakroczymski and Heine31).
Genistein (2 and 4 g/kg diet) also inhibited a host of adipogenic genes, including LXRα, SREBP1c, C/EBPβ and PPARγ. Among them, LXRα is a central regulator of cholesterol and lipid homeostasis via activation of SREBP-1c, which has the binding sites of RXR/LXR in its promoter(Reference Repa, Liang and Ou42). Activated SREBP-1c is translocated into the nucleus and binds to specific response elements on the promoter of lipogenic and adipogenic genes, such as ACC, fatty acid synthetase, stearoyl CoA desaturase-I, LDL receptor and C/EBPβ(Reference Le Lay, Lefrere and Trautwein43, Reference Shimano, Yahagi and Amemiya-Kudo44).
Until now, the effects of genistein on LXRα and SREBP-1c remain controversial. For instance, 10 μm genistein inhibited SREBP-1c processing and SREBP-1c downstream genes including fatty acid synthetase, stearoyl CoA desaturase-1, ACC1 and ACC2(Reference Shin, Lee and Cho45), whereas 20 μm genistein enhanced SREBP maturation in HepG2 cells(Reference Mullen, Brown and Osborne46). Thus, our findings will be a useful direction in questioning the effects of isoflavones on LXR-SREBP-1c. Additionally, the expressions of C/EBPβ, as a consequence of the down-regulation of SREBP-1c, were reduced, and consequently, the expression of PPARγ was also down-regulated (Fig. 3). It may be associated with the evidence that C/EBPβ can bind to C/EBP-regulatory elements in PPARγ2(Reference Elberg, Gimble and Tsai47) or dislodge histone deacetylase-1 from the promoter of C/EBPα, a potent PPARγ inducer(Reference Zuo, Qiang and Farmer48). These results were analogous to other evidence showing that 100 μm genistein blocked the DNA binding of C/EBPβ through the increase in the C/EBP homologous protein, and subsequently prevented C/EBPα and PPARγ protein expression in 3T3-L1 cells(Reference Harmon, Patel and Harp49). Furthermore, genistein-reduced RXRα may hamper the transactivation of LXRα and PPARγ, because LXR and PPAR can recruit RNA polymerase II after forming heterodimers with RXRα(Reference Chawla, Repa and Evans50).
On the other hand, the reduction of TNFα expression, the second strong predictor of NAFLD in our regression analysis, is likely to result from the enhancement of anti-inflammatory adiponectin expression by genistein supplementation (2 and 4 g/kg diet). TNFα has been shown to interfere with insulin signalling in the liver and adipose tissue(Reference Cai, Yuan and Frantz6), thereby favouring hepatic steatosis, inflammation and hepatic mitochondrial swelling(Reference Higuchi, Proske and Yeh51). By the way, adiponectin has been shown to prevent NFχB(Reference Ouchi, Kihara and Arita52) or macrophages(Reference Yokota, Oritani and Takahashi53) from generating TNFα. Our findings were consistent with the evidences that non-alcoholic steatohepatitis model rats or mice receiving genistein evidenced reductions in plasma TNFα levels(Reference Yalniz, Bahcecioglu and Kuzu54, Reference Hasumuma, Kawaguchi and Kikuchi55).
Unexpectedly, in the present study, the HF diet-increased leptin was normalised by genistein supplementation ( ≥ 1 g/kg diet) (Fig. 3). This may be attributable to the reduction of fat mass or impairment of insulin signalling(Reference Szkudelski, Nogowski and Pruszynska-Oszmalek32). In many studies, the secretion and synthesis of leptin were stimulated by insulin-mediated GLUT and glucose(Reference Mueller, Gregoire and Stanhope56, Reference Levy and Stevens57). Thus, genistein, which functions as a tyrosine kinase inhibitor, appears to inhibit the leptin expression by interfering with insulin signalling. Indeed, adult male rats receiving genistein (5 mg/kg BW) evidenced the reduction of blood leptin concentrations(Reference Szkudelski, Nogowski and Pruszynska-Oszmalek32).
Taken together, these data suggest that genistein (2 and 4 g/kg diet) might prevent NAFLD via the diminution of visceral fat mass and the regulation of adipocytokines. Additionally, our findings suggest a novel mechanism that gives the answer about the manner in which genistein inhibits NAFLD via the regulation of visceral fat metabolism, such as the inhibition of LXRα-RXRα-SREBP-1c or the activation of adiponectin, because there is little information about the action of genistein on LXRα, RXRα and adiponectin. Furthermore, the interpretation of our findings may be clinically applicable to human NAFLD, as C57BL/6J mice have a phenotype similar to that of human subjects. For example, they readily exhibit obesity, hyperinsulinaemia, hyperglycaemia and hypertension under ad libitum access to a HF diet, but maintain lean or normal conditions under restriction to a low-fat chow diet(Reference Surwit, Feinglos and Rodin15–Reference Mills, Kuhn and Feinglos17), as is the case in human subjects.
Acknowledgements
There are no conflicts of interest. The present study was conducted with the collaboration and financial support of the Department of Food and Nutrition and the Department of the Veterinary Public Health in Seoul National University. M.-H. K. contributed to the conception and design, data analysis and interpretation, and manuscript writing; K.-S. K. contributed to the financial support, provision of the study material, administrative support and final approval of the manuscript; Y.-S. L. contributed to the conception and design, financial support, provision of the study material, administrative support and final approval of the manuscript.


