


1. Introduction
Wind tunnel and flight tests have proved the feasibility of laminar flow control (LFC) technology for laminar–turbulent transition delay in aerospace applications (Henke Reference Henke1999; Malik et al. Reference Malik, Crouch, Saric, Lin, Whalen, Brockley, Agarwal, Collier, Shaefer and Seabridge2015). However, preserving laminar flow over large swept surfaces such as the wings of subsonic transport aircraft, whose skin friction drag can contribute up to  $18\,\%$ of the total drag (Schrauf Reference Schrauf2005), remains a challenge. Despite successful laboratory testing, generally it remains challenging to maintain laminar flow in operational environments (Tufts et al. Reference Tufts, Reed, Crawford, Duncan and Saric2017; Eppink Reference Eppink2020). In many cases, this was ascribed to surface roughness such as debris, insect contamination or imperfect joints, which can promote laminar–turbulent transition and hinder the effectiveness of LFC techniques. In recent years, numerous experimental and numerical studies have been conducted to investigate the impact of surface roughness on premature boundary-layer transition. Considering swept-wing flows, special emphasis has been put on roughness in the form of spanwise-distributed steps and gaps, which arise at the junction between wing panels and are especially detrimental in the leading-edge region. The focus of this paper is placed specifically on forward-facing steps.
1.1. The crossflow instability
Three-dimensional subsonic laminar flow over a smooth swept wing supports four types of instabilities: attachment line, Tollmien–Schlichting (TS), Görtler and crossflow (Saric, Reed & White Reference Saric, Reed and White2003). Considering a low-disturbance background, representative of free-flight conditions, laminar–turbulent transition is initiated typically by modal instability growth. In this scenario, the early stage of transition can be analysed based on the evolution of small-amplitude perturbations superimposed on the laminar base flow (Mack Reference Mack1984; Arnal Reference Arnal1993; Reed & Saric Reference Reed and Saric1996; Schmid & Henningson Reference Schmid and Henningson2001; Theofilis Reference Theofilis2003). The vector of state variables  $\boldsymbol {q}$ representing the flow field is decomposed as
 \begin{equation} \boldsymbol{q} = \boldsymbol{q}_{{B}} + \boldsymbol{q}^{\prime}, \end{equation}
where  $\boldsymbol {q}_{{B}}$ is a steady laminar solution of the Navier–Stokes equations, the so-called base flow, and $\boldsymbol {q}^{\prime }$ is the perturbation field. If the base flow is of unstable nature, then it supports the exponential amplification of arbitrarily small perturbations.
The scope of this paper is restricted to crossflow-dominated boundary layers. Strong crossflow instability growth is expected in regions of large favourable pressure gradient, as for instance near the leading edge (Arnal Reference Arnal1993). In a swept-wing boundary layer, the crossflow instability arises due to the combined effect of pressure gradient and sweep angle. In the potential flow region, the inviscid streamlines follow a curved trajectory, such that pressure and centrifugal forces are in equilibrium. This is not the case in the boundary-layer region due to the reduced momentum of the fluid particles near the wall. Pressure force excess creates a secondary flow that develops approximately normal to the external inviscid streamlines, the so-called crossflow, while the resulting viscous shear stress completes the balance.
Inherently, the (crossflow) velocity profile in the direction orthogonal to the trajectory of the inviscid streamlines contains an inflection point. As such, it becomes inviscidly unstable and susceptible to primary eigenmode amplification (Mack Reference Mack1984; Saric et al. Reference Saric, Reed and White2003). The associated instability, the crossflow instability, can manifest in the form of either travelling or stationary (i.e. zero temporal frequency) wave-like perturbations. Nevertheless, receptivity dictates the eventual dominance of stationary or travelling crossflow. On smooth swept surfaces and high-turbulence environments, the travelling crossflow instability dominates over the stationary one (Deyhle & Bippes Reference Deyhle and Bippes1996). In contrast, elevated random or distributed surface roughness in combination with low free-stream turbulence favours the development of stationary crossflow modes. In the present work, we focus on stationary-crossflow effects, inasmuch as they play a more relevant role in low-turbulence free-flight environments (Saric et al. Reference Saric, Reed and White2003). The wavefronts of the stationary wave-like perturbations are aligned approximately with the local direction of the flow, which is in turn very close to the direction of the inviscid streamlines (Bippes Reference Bippes1999). Structurally, a crossflow instability developing on the laminar base flow manifests as co-rotating vortices.
After an initial stage of exponential perturbation growth, the main transition route towards turbulence involves nonlinear effects and primary mode saturation (Haynes & Reed Reference Haynes and Reed2000). Due to their stationary nature, crossflow vortices deform significantly the base flow and introduce shear layers that can support the growth of secondary instabilities. In the last two decades, several numerical, theoretical and experimental studies have characterised three main secondary instability kinds (Fischer & Dallmann Reference Fischer and Dallmann1991; Malik, Li & Chang Reference Malik, Li and Chang1994; Malik et al. Reference Malik, Li, Choudhari and Chang1999; Wassermann & Kloker Reference Wassermann and Kloker2002; Bonfigli & Kloker Reference Bonfigli and Kloker2007; Serpieri & Kotsonis Reference Serpieri and Kotsonis2016). The type-I (or type- $z$) mechanism grows by extracting energy from the spanwise shear in the outer part of the upwelling region (the shoulder) of the primary crossflow vortex. The type-II (or type- $y$) mechanism is driven by the wall-normal shear of the flow and develops on top of the crossflow vortex. Finally, the type-III mechanism is associated with the nonlinear interaction between primary travelling and stationary crossflow instabilities. The growth of secondary instabilities triggers laminar breakdown ultimately.
1.2. Effect of two-dimensional roughness on boundary-layer stability and transition
Early studies on the effect of two-dimensional roughness on laminar–turbulent transition considered two-dimensional (i.e. unswept) flows with zero-pressure gradient. Tests performed on a flat surface with a cylindrical wire mounted on it showed that an increase of the wire's height or the free-stream velocity caused a forward shift of the transition front (Fage & Preston Reference Fage and Preston1941; Tani Reference Tani1969). In the case of an aerofoil with realistic spanwise roughness, such as hollows or bulges, the exact impact of roughness on transition depends on the perturbation introduced by the surface imperfection and the stability of the boundary layer downstream of the latter (Fage Reference Fage1943).
The ability to predict the minimum roughness height that influences transition observably is paramount to establish suitable manufacturing tolerances. As such, many efforts have been made to determine critical heights for distributed as well as isolated roughness. The roughness Reynolds number was reported initially as the most successful correlation parameter for tests performed with two-dimensional wires (Smith & Clutter Reference Smith and Clutter1959). It is defined as
 \begin{equation} {{Re}}_{hh} = \frac{u_h h}{\nu}, \end{equation}
where  $h$ is the roughness height, $\nu$ is the kinematic viscosity, and $u_h$ is the velocity of the undisturbed boundary layer at the element's height. The critical ${Re}_{hh}$, i.e. the value above which the presence of the roughness element starts to affect transition noticeably, is found generally to be lower for two-dimensional roughness than for three-dimensional roughness (Braslow Reference Braslow1960).
While a majority of early work was based on transition-correlation analyses, more recent investigations have provided deeper insight into the relevant flow features introduced by the roughness element. For instance, coupling between TS instabilities and the acoustic disturbances scattered by small sudden geometry changes has been proposed as a mechanism that can impact largely the subsequent unsteady flow evolution (Goldstein Reference Goldstein1985). The effect of two-dimensional roughness on two-dimensional boundary layers is now attributed generally to the generation of TS disturbances (Ergin & White Reference Ergin and White2006).
The scope of the present work, however, lies on the impact of roughness upon an already pre-existing boundary layer instability. For a TS disturbance interacting with a localised surface distortion, Wu & Hogg (Reference Wu and Hogg2006) report that the incoming TS wave is scattered at the roughness element. As a result, it experiences a change of amplitude. This effect is quantified by Wu & Hogg (Reference Wu and Hogg2006) through a transmission coefficient that expresses the relative change in amplitude of the TS disturbance before and after the scattering process. When evaluated for the separated flow over a two-dimensional hump, Xu et al. (Reference Xu, Sherwin, Hall and Wu2016) report a strong increase of the transmission coefficient, as compared to an element of smaller height. For an analogous scenario encompassing an incoming TS disturbance and a hump, Park & Park (Reference Park and Park2013) conclude that their interaction is ruled by viscous and inviscid instability mechanisms. The former is associated with the original TS mechanism, whereas the latter is linked to the inflectional nature of the base-flow profiles in the vicinity of the hump. Furthermore, Park & Park (Reference Park and Park2013) find discrepancies between disturbance growth rate predictions when comparing the results of two classic stability methods: the parabolised stability equations (PSE) (Bertolotti, Herbert & Spalart Reference Bertolotti, Herbert and Spalart1992; Herbert Reference Herbert1997) and linear stability theory (LST).
For the case of a swept laminar separation bubble interacting with an incoming oblique TS instability or a crossflow perturbation, a superior performance of PSE over LST in terms of accuracy is pointed out by Hetsch & Rist (Reference Hetsch and Rist2009). Edelmann & Rist (Reference Edelmann and Rist2014) report good agreement between direct numerical simulations (DNS) and LST in terms of the perturbation amplification factor in two-dimensional forward-facing-step flows. Following the work of Perraud et al. (Reference Perraud, Arnal, Séraudie and Tran2004) and Crouch, Kosorygin & Ng (Reference Crouch, Kosorygin and Ng2006), Edelmann & Rist (Reference Edelmann and Rist2014) characterise the effect of the step by quantifying the correspondingly modified perturbation amplification factor, relative to the reference no-step case. The transitional-flow features downstream of a forward-facing step in unswept conditions have been examined further by Rizzetta & Visbal (Reference Rizzetta and Visbal2014) using numerical simulations.
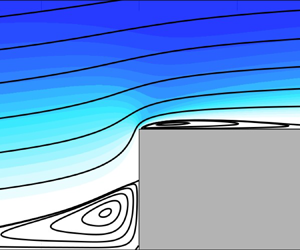
Surface roughness in the form of forward-facing steps is ubiquitous in a broad range of engineering applications. As such, there is extensive past work examining the topology and behaviour of flow over forward-facing steps, mainly in the presence of an incoming two-dimensional boundary layer. The computational analysis of Wilhelm, Härtel & Kleiser (Reference Wilhelm, Härtel and Kleiser2003) shows that the two-dimensional base flow can contain separation bubbles upstream and downstream of the step. Emphasis is placed on detailing the mechanisms through which the initially two-dimensional base flow eventually evolves towards a highly three-dimensional one. Wilhelm et al. (Reference Wilhelm, Härtel and Kleiser2003) and later Marino & Luchini (Reference Marino and Luchini2009) attribute this transition to a sensitive response of the flow to disturbances present in the incoming flow; the existence of an absolute instability in the separated-flow region is discarded by the former. A Görtler type of instability (associated with the curvature of the near-wall streamlines passing over the step) has also been proposed as a possible mechanism for the loss of two-dimensionality in developed forward-facing-step flows (Chiba, Ishida & Nakamura Reference Chiba, Ishida and Nakamura1995).
Downstream of a step in unswept conditions, experimental (Stüer, Gyr & Kinzelbach Reference Stüer, Gyr and Kinzelbach1999) and numerical (Lanzerstorfer & Kuhlmann Reference Lanzerstorfer and Kuhlmann2012) studies have reported the existence of streaky structures. This has been ascribed by the latter to the lift-up effect (Landahl Reference Landahl1975, Reference Landahl1980). In swept boundary layers without steps, velocity streaks have been identified in scenarios involving non-modal growth (Breuer & Kuraishi Reference Breuer and Kuraishi1994; Corbett & Bottaro Reference Corbett and Bottaro2001; Tempelmann, Hanifi & Henningson Reference Tempelmann, Hanifi and Henningson2010). Three-dimensional flows with a strong crossflow component can sustain significant non-modal growth, which may complement growth due to a modal crossflow instability since these two mechanisms excite perturbations of similar structure (Breuer & Kuraishi Reference Breuer and Kuraishi1994; Corbett & Bottaro Reference Corbett and Bottaro2001; Tempelmann et al. Reference Tempelmann, Hanifi and Henningson2010).
Among the vast literature on the effect of two-dimensional roughness on the laminar–turbulent transition path, pressure-gradient effects have been neglected historically. The sparse literature on this topic motivated a series of experiments involving forward-facing steps mounted on unswept flat plates with a prescribed favourable pressure gradient (Drake, Bender & Westphal Reference Drake, Bender and Westphal2008; Drake et al. Reference Drake, Bender, Korntheuer, Westphal, McKeon, Gerashchenko, Rohe and Dale2010). Duncan et al. (Reference Duncan, Crawford, Tufts, Saric and Reed2013) extended the work of Drake et al. (Reference Drake, Bender, Korntheuer, Westphal, McKeon, Gerashchenko, Rohe and Dale2010) by adding sweep angle to account for the instability mechanisms present in three-dimensional flows. In a stationary-crossflow-dominated scenario, Duncan et al. (Reference Duncan, Crawford, Tufts, Saric and Reed2013) report a reduction of the critical roughness Reynolds number, when compared to the equivalent two-dimensional case of Drake et al. (Reference Drake, Bender, Korntheuer, Westphal, McKeon, Gerashchenko, Rohe and Dale2010).
Following the aforementioned experiments, Tufts et al. (Reference Tufts, Reed, Crawford, Duncan and Saric2017) investigate numerically the interaction between a stationary crossflow instability and forward-facing steps of several heights under the same flow conditions as Duncan et al. (Reference Duncan, Crawford, Tufts, Saric and Reed2014) and Crawford et al. (Reference Crawford, Duncan, Tufts, Saric and Reed2015). The critical height at which steps start to affect transition notably is associated by Tufts et al. (Reference Tufts, Reed, Crawford, Duncan and Saric2017) with a strong and sudden amplification of the incoming stationary crossflow perturbation at the step. In particular, the proposed mechanism responsible for this amplification stage is linked to the constructive interaction between the incoming crossflow vortices and step-induced recirculating flow. Nonetheless, lack of evidence supporting this mechanism of interaction was reported in following investigations (Eppink Reference Eppink2018, Reference Eppink2020; Eppink & Casper Reference Eppink and Casper2019). At the same time, the universal validity of the model proposed by Tufts et al. (Reference Tufts, Reed, Crawford, Duncan and Saric2017) to determine critical step heights has been questioned by Rius-Vidales & Kotsonis (Reference Rius-Vidales and Kotsonis2020).
Despite the scientific controversy with regard to the mechanism proposed by Tufts et al. (Reference Tufts, Reed, Crawford, Duncan and Saric2017), similarities in terms of perturbation organisation at the step have been reported widely. The crossflow perturbation lifts up as it approaches the step, and the perturbation profile, i.e. the perturbation shape in the wall-normal direction, develops a distinctive secondary peak close to the wall (Tufts et al. Reference Tufts, Reed, Crawford, Duncan and Saric2017; Eppink Reference Eppink2018, Reference Eppink2020; Cooke et al. Reference Cooke, Mughal, Sherwin, Ashworth and Rolston2019; Casacuberta, Hickel & Kotsonis Reference Casacuberta, Hickel and Kotsonis2021). A new set of secondary vortices induced locally at the step has been identified by Eppink (Reference Eppink2018, Reference Eppink2020), Rius-Vidales & Kotsonis (Reference Rius-Vidales and Kotsonis2021) and Casacuberta et al. (Reference Casacuberta, Hickel and Kotsonis2021).
There is a growing consensus that the incoming crossflow instability becomes amplified at the step (Tufts et al. Reference Tufts, Reed, Crawford, Duncan and Saric2017; Eppink Reference Eppink2020; Rius-Vidales & Kotsonis Reference Rius-Vidales and Kotsonis2021). However, as opposed to Tufts et al. (Reference Tufts, Reed, Crawford, Duncan and Saric2017), Eppink (Reference Eppink2020) ascribes this to the destabilising effect of the inflectional profiles accompanying the regions of flow separation and reversal of the crossflow component in the near-step regime. Rius-Vidales & Kotsonis (Reference Rius-Vidales and Kotsonis2021) report a strong spanwise modulation of the trajectory of the crossflow vortices, induced potentially by the local step-flow motion. Moreover, a second stage of stationary crossflow amplification is captured by Eppink (Reference Eppink2020) further downstream of the step, at the end of the flow-separation region. This is linked to nonlinear growth mechanisms triggered by the interaction of the harmonic perturbation components; the deformation of the separation bubble under the action of the crossflow vortices introduces multiple streamwise-oriented vortices with harmonic wavelengths (Eppink Reference Eppink2020). Enhancement of the harmonic activity in this regime has been identified by Rius-Vidales & Kotsonis (Reference Rius-Vidales and Kotsonis2021) as well, who, on the contrary, suggest amplification of the harmonic crossflow components via nonlinear forcing of the fundamental component.
The aforementioned discrepancies on the role played by step-induced flow features in modifying the properties of the crossflow perturbation have motivated the present study. We perform DNS to compute the three-dimensional flow configuration that arises from the interaction between a three-dimensional boundary layer with a critical stationary crossflow perturbation prescribed at the inlet and forward-facing steps of several heights. The analysis is restricted to the near-step regime and to mechanisms of interaction of a stationary nature by enforcing a steady-state DNS solution. Unsteady perturbation structures, including the secondary instabilities responsible ultimately for laminar breakdown, are undesired here and thus not triggered in order to isolate pertinent stationary mechanisms. We identify and analyse the main step-flow features responsible for altering the behaviour of the pre-existing crossflow perturbation, and characterise qualitatively and quantitatively the evolution of the stationary perturbation field at the step.
This article is structured as follows. Section 2 introduces the flow problem, geometry and notation, and describes the free-stream evolution and the DNS set-up. Furthermore, it gives an overview of the perturbation evolution in the reference no-step case, and presents analytical formulas to decompose the perturbation field relative to the base-flow orientation. Section 3 describes the topology of the laminar base flow. Section 4 analyses the evolution of the perturbation field upstream of and at the step. The focus is placed on the fundamental perturbation component, i.e. the primary mode of the spanwise-Fourier-decomposed perturbation field. Section 5 extends the analysis of § 4 and characterises the perturbation behaviour downstream of the step. A summary and concluding discussion are provided in § 6.
2. Methodology
2.1. Definition of flow problem
The incompressible Navier–Stokes equations are solved to study the interaction between forward-facing steps and a stationary crossflow disturbance in a swept-wing boundary layer. A sketch of the flow problem is depicted in figure 1. The swept-wing flow is modelled as flat-plate flow (i.e. neglecting wall curvature) with a prescribed external pressure distribution in the chordwise direction,  $x$. The effect of sweep angle is accounted for by expressing the incoming free-stream velocity into components normal, $u_{\infty }$, and parallel, $w_{\infty }$, to the leading-edge direction (or spanwise direction), $z$. The wall-normal coordinate is denoted by $y$. The computational domain is aligned with the swept main coordinate system, $\boldsymbol {x} = [x\;y\;z]^{\rm {T}}$.
Sketch of the flow problem and the computational domain.

The aerofoil-like external pressure distribution imposed at  $y = y_{{max}}$ is obtained from independent experiments carried out at TU Delft on a $45^{\circ }$ swept wing; see Rius-Vidales & Kotsonis (Reference Rius-Vidales and Kotsonis2021) for further details on the experimental set-up. The wing model was designed specifically and used extensively for the study of the crossflow instability; see Serpieri & Kotsonis (Reference Serpieri and Kotsonis2016) and Serpieri, Venkata & Kotsonis (Reference Serpieri, Venkata and Kotsonis2017), for instance. The inlet of the computational domain is placed at a chordwise position $x$ corresponding to $5\,\%$ of the wing chord in the leading-edge-orthogonal direction. At this location, $x = 0$ and $w_{\infty } / u_{\infty } = -1.24$. A three-dimensional laminar boundary layer obtained as solution to the self-similar Falkner–Skan–Cooke equations is used as inflow boundary condition for the base-flow calculation. The boundary layer develops in $x$ and encounters a nominal forward-facing step of height $h$, kept invariant along the spanwise direction. The inflow boundary layer thickness, $\delta _{0} = 7.71 \times 10^{-4}$ m, and the chordwise inflow free-stream velocity, $u_{\infty } = 15.10\,{\rm m}\,{\rm s}^{-1}$, are the characteristic length and velocity scales used to non-dimensionalise all variables, and ${Re} = u_{\infty } \delta _{0} / \nu = 791.37$. It is noted that $\delta _{0}$ corresponds to the wall-normal location at which the boundary layer reaches $99\,\%$ of the chordwise inflow free-stream velocity.
First, DNS of the unperturbed laminar base flow  $\boldsymbol {q}_{{B}}$ are performed. The base-flow computations are carried out under the infinite-span assumption, which justifies neglecting any spanwise variations in state variables, i.e. $\partial \boldsymbol {q}_{{B}} / \partial z = 0$. The base flow is then used as initial condition for computing the steady-state solution that arises from the interaction between a stationary crossflow instability and the step, $\boldsymbol {q} = \boldsymbol {q}_{{B}} + \boldsymbol {q}^{\prime }$. In this second stage, hereafter referred to as the developed flow field, a stationary crossflow mode, pre-calculated using LST on the DNS base flow, is imposed for $\boldsymbol {q}^{\prime }$ at the inflow. The crossflow perturbation is constrained to grow only in $x$ through the application of periodic boundary conditions in the transverse boundaries. The spanwise domain length is set equal to the spanwise wavelength of the fundamental crossflow perturbation, $\lambda _{z} = 2 {\rm \pi}/ \beta _{0}$, where $\beta _{0}$ denotes the fundamental spanwise wavenumber. The present approach is largely similar to the one followed by Wassermann & Kloker (Reference Wassermann and Kloker2002).
Forward-facing steps of several heights are tested to investigate the effect of  $h$ on the modified perturbation mechanisms. The DNS are performed for a smooth flat-plate reference case and three different step configurations. Table 1 summarises the main boundary layer parameters per step case. The parameter $\delta _{99,h}$ denotes the unperturbed boundary-layer thickness at the $x$-location of the step, and
 \begin{equation} {Re}_{h} = \frac{u_{\infty} h}{\nu} \end{equation}
is the step-height-based Reynolds number. The steps tested in our simulations attain approximately between  $30\,\%$ and $50\,\%$ of the undisturbed boundary-layer thickness. All steps are located at the streamwise location $x / \delta _{0} = 177.62$, which corresponds to $20\,\%$ of the chord of the wing model used to characterise the free-stream properties. For the sake of simplicity, we introduce the coordinate $x_{{st}} = x - 177.62\,\delta _{0}$ expressing a position relative to the step.
Boundary-layer parameters per step case.

The choice of the spanwise wavelength of the fundamental stationary crossflow mode prescribed in the DNS,  $\lambda _{z} = 7.5$ mm, is grounded on a critical mode with respect to the amplification factor achieved at the end of the computational domain. For this purpose, a linear local Orr–Sommerfeld analysis was performed on the DNS base flow for a broad range of spanwise wavelength $\lambda _{z}$ values. Linear local stability methods can predict sufficiently the most amplified wavelength of stationary crossflow disturbances, despite their inherent parallel-flow assumption (Bippes Reference Bippes1999). The results are summarised in figure 2, where the colour map represents the local perturbation chordwise growth rate, $-\alpha _{i}^{{OS}}$, and isolines characterise the associated amplification factor in $x$.
$x$.
Stability diagram of the DNS base flow obtained from a linear local stability method. The colour map expresses the perturbation chordwise growth rate  $-\alpha ^{{OS}}_{i}$, solid white lines are isolines of the amplification factor in $x$, dash-dotted black lines are the neutral curve, the dashed yellow line indicates $\lambda _{z} = 7.5$ mm, and the vertical black line illustrates the virtual step location.

2.2. Governing equations and notation
Letting  $f$ be the incompressible Navier–Stokes operator applied to a vector of state variables $\boldsymbol {\xi }$, with adequate boundary and initial conditions, the momentum conservation equations can be expressed as
 \begin{equation} \dot{\boldsymbol{\xi}} = f(\boldsymbol{\xi}), \end{equation}
where the dot indicates the time derivative. The unperturbed base-flow velocity field is denoted by  $\boldsymbol {\upsilon }_{{B}} = [u_{{B}}\;v_{{B}}\;w_{{B}}]^{\rm {T}}$, with $u_{{B}}$, $v_{{B}}$, $w_{{B}}$ expressing velocity components in the chordwise, wall-normal, and spanwise directions, respectively. The base-flow static pressure is denoted by $p_{{B}}$. The vector of state variables $\boldsymbol {q}_{{B}} = [\boldsymbol {\upsilon }_{{B}}\;p_{{B}}]^{\rm {T}}$ is the solution of $f(\boldsymbol {\xi }) = 0$ under the inflow boundary condition
 \begin{equation} \boldsymbol{\upsilon}_{{in}} = \boldsymbol{\upsilon}^{{FSC}}, \end{equation}
where  $\boldsymbol {\upsilon }_{{in}}$ is the velocity vector prescribed at the inlet, and $\boldsymbol {\upsilon }^{{FSC}}$ is a solution to the Falkner–Skan–Cooke (FSC) equations. The system of equations $f(\boldsymbol {q}_{{B}}) = 0$ reads
 \begin{gather} -u_{{B}}\,\frac{\partial u_{{B}}}{\partial x} - v_{{B}}\,\frac{\partial u_{{B}}}{\partial y} - \frac{1}{\rho}\,\frac{\partial p_{{B}}}{\partial x} + \nu \left( \frac{\partial^2 u_{{B}}}{\partial x^2} + \frac{\partial^2 u_{{B}}}{\partial y^2} \right) = 0, \end{gather}
 \begin{gather}-u_{{B}}\,\frac{\partial v_{{B}}}{\partial x} - v_{{B}}\,\frac{\partial v_{{B}}}{\partial y} - \frac{1}{\rho}\,\frac{\partial p_{{B}}}{\partial y} + \nu \left( \frac{\partial^2 v_{{B}}}{\partial x^2} + \frac{\partial^2 v_{{B}}}{\partial y^2} \right) = 0, \end{gather}
 \begin{gather}-u_{{B}}\,\frac{\partial w_{{B}}}{\partial x} - v_{{B}}\,\frac{\partial w_{{B}}}{\partial y} + \nu \left( \frac{\partial^2 w_{{B}}}{\partial x^2} + \frac{\partial^2 w_{{B}}}{\partial y^2} \right) = 0, \end{gather}
where  $\rho$ denotes density, and base-flow continuity is expressed as
 \begin{equation} \frac{\partial u_{{B}}}{\partial x} + \frac{\partial v_{{B}}}{\partial y} = 0. \end{equation}
 We denote by  $\boldsymbol {\upsilon } = [u\;v\;w]^{\rm {T}}$ the developed velocity field, and by $p$ the corresponding static pressure. The vector of state variables $\boldsymbol {q} = [\boldsymbol {\upsilon }\;p]^{\rm {T}}$ is the solution of $f(\boldsymbol {\xi }) = 0$ subject to the inflow boundary condition
 \begin{equation} \boldsymbol{\upsilon}_{{in}} = \boldsymbol{\upsilon}^{{FSC}} + [u^{\prime}_{{in}}\;v^{\prime}_{{in}}\;w^{\prime}_{{in}}]^{{\rm T}}, \end{equation}
where  $[u^{\prime }_{{in}}\;v^{\prime }_{{in}}\;w^{\prime }_{{in}}]^{{\rm T}}$ expresses a stationary crossflow disturbance computed from a linear local stability analysis on the DNS base flow. Further details on the numerical implementation of the boundary conditions are given in § 2.4.
The velocity-perturbation field is denoted by  $\boldsymbol {\upsilon }^{\prime } = [u^{\prime }\;v^{\prime }\;w^{\prime }]^{\rm {T}}$ and $\boldsymbol {q}^{\prime } = \boldsymbol {q} - \boldsymbol {q}_{{B}} = [\boldsymbol {\upsilon }^{\prime }\;p^{\prime }]^{\rm {T}}$. The velocity-perturbation field is expressed as a sum of spanwise Fourier modes, i.e.
 \begin{equation} \boldsymbol{\upsilon}^{\prime}(x,y,z) = \sum_{j ={-}N}^{N} \underbrace{\tilde{\boldsymbol{\upsilon}}_{(0,j)}(x,y) \, \exp({ {\rm i} j \beta_{0} z})}_{\boldsymbol{\upsilon}^{\prime}_{(0,j)}}, \end{equation}
where  $\tilde {\boldsymbol {\upsilon }}_{(0,j)} \in \mathbb {C}$ are the Fourier coefficients, $N$ is the number of modes considered, and ${\rm i}^2 = -1$. The symmetric term $\boldsymbol {\upsilon }^{\prime }_{(0,-j)}$ is the complex conjugate of $\boldsymbol {\upsilon }^{\prime }_{(0,j)}$, which is hereafter denoted by $\{\cdot \}^{{\dagger} }$, and $\boldsymbol {\upsilon }^{\prime }_{(0,0)}$ is the mean-flow distortion. The moduli of the components of $\tilde {\boldsymbol {\upsilon }}_{(0,j)}$ are expressed as $|\tilde {u}|_{(0,j)}$, $|\tilde {v}|_{(0,j)}$, $|\tilde {w}|_{(0,j)}$ and referred to as amplitude functions; the associated phases are $\varphi ^{u}_{(0,j)}$, $\varphi ^{v}_{(0,j)}$, $\varphi ^{w}_{(0,j)}$. We use the nomenclature $\{\cdot \}_{(0,j)}$ to refer to perturbation quantities of spanwise wavenumber $j \beta _{0}$ of stationary nature, i.e. with zero temporal frequency.
Considering the profile along  $y$ of a particular perturbation amplitude function, its global maximum is typically associated with the perturbation amplitude. In the cases discussed in this work, profiles of the amplitude functions may attain multiple local maxima in the region close to the step. Therefore, at every $x$, we distinguish between amplitude function values measured at the global maxima, $|\tilde {q}|^{{max}}_{(0,j)}$, and at a second local maxima, $|\tilde {q}|^{{top}}_{(0,j)}$, where $q = \{ u, v, w \}$ expresses a perturbation component. It will be shown below that the second local maxima at the step can be associated with the original (i.e. baseline) main peak, which develops far upstream of the step. It will become apparent later that near the step, the former amplitude definition (i.e. $|\tilde {q}|^{{max}}_{(0,j)}$) may not characterise properly stationary crossflow growth. We denote the wall-normal position and amplitude values associated with $|\tilde {q}|^{{top}}_{(0,j)} + |\tilde {q}^{{\dagger} }|^{{top}}_{(0,j)}$ by $\tilde {y}^{q}_{(0,j)} = \tilde {y}^{q}_{(0,j)}(x)$ and $A^{q}_{(0,j)} = A^{q}_{(0,j)}(x)$, respectively. Finally, a corresponding chordwise perturbation growth rate is defined as
 \begin{equation} \alpha^{q}_{i,(0,j)} ={-} \frac{1}{A^{q}_{(0,j)}}\,\frac{{\rm d} (A^{q}_{(0,j)})}{{\rm d}\kern0.06em x}. \end{equation}
2.3. Definition of the external inviscid streamline
The external chordwise velocity far from the wall,  $u_{e}$, increases along $x$ since the free stream is subject to a favourable pressure gradient. The external pressure is denoted by $p_{e}$, whilst $p_{\infty }$ expresses the inflow free-stream pressure. Under classic boundary layer approximations, invariance of pressure and free-stream velocity along $y$ is assumed. However, in the present full Navier–Stokes representation with a realistic pressure distribution, $u_{e} = u_{e}(x,y)$ with $\partial u_{e} / \partial x \gg \partial u_{e} / \partial y$. As is common in studies of swept-wing boundary layers, rigorous determination of the crossflow component requires a proper definition of the orientation of a characteristic inviscid streamline. The velocity non-uniformity in $y$ poses the challenge of establishing such definition. To overcome possible ambiguities, we characterise pseudo-free-stream properties, i.e. properties that are representative of the inviscid-flow evolution and are functions of $x$ only. For this purpose, a numerically computed base-flow streamline is seeded initially at $y / \delta _{0} \approx 5$ at the inflow. This value yields matching boundary-layer properties between the present DNS and independent numerical solutions of the boundary-layer equations. The free-stream properties measured along the streamline are assigned as pseudo-free-stream properties. In particular, the pseudo-free-stream chordwise velocity $\hat {u}_{e} = \hat {u}_{e}(x)$ is used to define the horizontal deflection of the computed inviscid streamline,
 \begin{equation} \phi_{s}(x) = {\rm arctan} \left( \frac{w_{\infty}}{\hat{u}_{e}} \right), \end{equation}
that is, the angle that a unit vector, which is tangent to the inviscid streamline projected in the  $x$–
$x$– $z$ plane, forms with $x$. The chordwise evolution of $\phi _{s}$ is illustrated in figure 3. The base-flow crossflow component $w_{{B},s}$, and the velocity component parallel to the inviscid streamline direction $u_{{B},s}$, are accordingly defined as
 \begin{equation} \left. \begin{aligned} u_{{B},s} & = u_{{B}} \cos(\phi_{s}) + w_{{B}} \sin(\phi_{s}), \\ w_{{B},s} & = w_{{B}} \cos(\phi_{s}) - u_{{B}} \sin(\phi_{s}). \end{aligned} \right\} \end{equation}
Horizontal deflection of the characteristic inviscid streamline along (a) the domain, and (b) zoomed in at the step, in the smooth case (thick solid black), step case I (dotted orange), step case II (dash-dotted blue), and step case III (thin solid red).

2.4. Numerical set-up of DNS
The incompressible three-dimensional Navier–Stokes equations are solved numerically with INCA, a conservative finite-volume solver (Hickel & Adams Reference Hickel and Adams2008; Hickel, Egerer & Larsson Reference Hickel, Egerer and Larsson2014). The present solver is well established in studies of flow instability and perturbation dynamics; see, for instance, the transitional-flow mechanisms behind a micro-ramp immersed in a quasi-incompressible boundary layer (Casacuberta et al. Reference Casacuberta, Groot, Ye and Hickel2020).
DNS of both the base flow and the developed flow are carried out in a similar spatial and numerical set-up, which is described next. The dimensions of the computational domain are  $0 \leq x / \delta _{0} \leq 517$, $0 \leq y / \delta _{0} \leq 26$, $-4.86 \leq z / \delta _{0} \leq 4.86$. Four computational grids, including the reference (i.e. no-step) case and three step configurations, are designed. The structure of the grids is common among all cases; a smooth hyperbolic refinement is applied in the chordwise direction, close to the location of the step, such that the region encompassing the step is highly refined. For consistency, the reference case is treated similarly. Hyperbolic refinement in the wall-normal direction is applied in the near-wall region as well. The spanwise arrangement of the grid is treated differently for base-flow and developed-flow calculations. Capitalising on the spanwise invariance of the base flow, only two spanwise grid points ( $N_{z} = 2$) are considered for its calculation, effectively solving for a single $x$–
$x$– $y$ plane of the flow. In contrast, the developed flow is solved on a grid of 72 points in the $z$-direction. The converged two-dimensional base flow is used as the initial condition for the three-dimensional flow simulations. Table 2 summarises the main parameters of the employed computational grid in the reference configuration for the developed-flow computations. The grid spacing expressed in wall units is based on the local friction velocity.
Grid parameters of the developed-flow computations in the smooth configuration: number of grid partitions ( $Nx$,
$Nx$,  $Ny$,
$Ny$,  $Nz$); grid spacing at the virtual location of the step ( $|_{{st}}$) and near the outflow ( $|_{{out}}$) expressed in wall units (top) and relative to the fundamental spanwise wavelength (bottom).

An explicit third-order Runge–Kutta method is used to march the Navier–Stokes equations in time. The  $L_{2}$-norm of the temporal derivatives, $\epsilon$, is used as convergence criterion for the base-flow computations. We choose $\epsilon = 10^{-8}$. In the developed-flow computations, the stationary nature of the numerical solution is enforced through the application of the selective frequency damping (SFD) method (Åkervik et al. Reference Åkervik, Brandt, Henningson, Hoepffner, Marxen and Schlatter2006; Casacuberta et al. Reference Casacuberta, Groot, Tol and Hickel2018). The $L_{2}$-norm of the difference between the instantaneous solution and the low-pass filtered solution associated with the SFD formulation, $\epsilon _{{SFD}}$, is used as a convergence criterion for the developed-flow computations. We choose $\epsilon _{{SFD}} = 10^{-6}$; $\epsilon _{{SFD}} > \epsilon$ since the developed-flow computations are significantly more expensive than the base-flow runs. We use a fifth-order upwind scheme to discretise the convective terms, and a second-order central difference scheme for the treatment of the viscous terms. The velocity components are defined on a staggered mesh and the BiCGstab method is used for the solution of the pressure Poisson equation, with an $L_{2}$-norm convergence criterion $\epsilon _{{DIV}} = 10^{-9}$.
Three layers of ghost cells are added at the domain boundaries for the application of boundary conditions, which are detailed next. As mentioned above, the inflow velocity profile in the developed-flow computations is perturbed to trigger stationary crossflow growth (2.8). The perturbation superimposed on the inflow FSC profile is a stationary crossflow disturbance; consider the chordwise-velocity component
 \begin{equation} u^{\prime}_{{in}} = A_{0} \left( \tilde{u}^{{in}}_{r} \left\{ \cos(\alpha^{{in}}_{r} x + \beta_{0} z) \right\} - \tilde{u}^{{in}}_{i} \left\{ \sin(\alpha^{{in}}_{r} x + \beta_{0} z) \right\} \right), \end{equation}
where  $A_{0} \in \mathbb {R}$ is the initial amplitude, and $\tilde {u}^{{in}} = \tilde {u}^{{in}}_{r} + {\rm i} \tilde {u}^{{in}}_{i}$ with $\max \{ {\rm abs}(\tilde {u}^{{in}}) \} = 1$ and $\alpha ^{{in}}_{r} \in \mathbb {R}$ the normalised amplitude function and chordwise wavenumber of the crossflow mode obtained as a solution to a linear local stability analysis on the inflow base-flow profile. A treatment identical to (2.13) is considered for the perturbation components $v^{\prime }_{{in}}$ and $w^{\prime }_{{in}}$ in (2.8). An initial amplitude $A_{0} = 3.5 \times 10^{-3} u_{\infty }$ for all cases is assigned, based on preliminary analyses (§ 2.5).
To approximate the aforementioned experimental outer-flow evolution (§ 2.1), a Dirichlet type of boundary condition for static pressure is prescribed at the top boundary, based on a polynomial fit of logarithmic basis of the chordwise external velocity obtained from the experiments of Rius-Vidales & Kotsonis (Reference Rius-Vidales and Kotsonis2021):
 $$\begin{gather} u^{{exp}}_{e} / u_{\infty} = 0.0023\ln^{4}(x+c) + 0.0377\ln^{3}(x+c) + 0.1752\ln^{2}(x+c)\nonumber\\ {}+ 0.5303\ln(x+c) + 1.8574, \end{gather}$$
with  $c = 0.0468$ m. The static pressure distribution that is imposed ultimately at $y = y_{{max}}$ is computed using (2.14) and the irrotational-flow assumption. The condition for velocity at the top boundary allows both inflow and outflow, and ensures that fluctuations are quenched: the instantaneous velocity components are split into a spanwise mean and fluctuation components. A second-order Neumann-type condition is applied for the spanwise mean component, whereas the fluctuating part is damped out artificially; see Hickel & Adams (Reference Hickel and Adams2008) for further details on the technique employed. At the outlet, the static pressure is prescribed and a second-order Neumann-type condition is used for the velocity. Finally, the no-slip and no-penetration conditions are applied at the wall.
2.5. DNS–NPSE cross-validation of the reference case
Prior to the analysis of the step results, it is instructive to establish the ability of the present simulations to capture accurately the stability of the flow. As such, the chordwise evolution of the stationary-crossflow amplitude obtained from DNS is compared to the results of an independent stability analysis using the nonlinear parabolised stability equations (NPSE) approach (Bertolotti et al. Reference Bertolotti, Herbert and Spalart1992; Haynes & Reed Reference Haynes and Reed2000) applied on the DNS base flow. We refer to Westerbeek (Reference Westerbeek2020) for details on the NPSE implementation used in this work. While the DNS and NPSE solutions are both subject to truncation and discretisation errors, such cross-validation provides confidence in both approaches.
The incompressible NPSE are solved on a grid containing  $500$ equispaced streamwise stations and $80$ Chebyshev collocation points in the wall-normal direction. The streamwise derivatives are discretised using a first-order backward Euler scheme, and $11$ stationary spanwise Fourier modes (including the mean-flow distortion) have been considered for the simulations. The initial condition for the fundamental crossflow mode is obtained from LST evaluated on the local base-flow velocity profile from DNS. The high-order harmonics are triggered automatically by the action of the nonlinear forcing terms and introduced successively in the chordwise-marching scheme once their strength surpasses the threshold of $10^{-8}$ in units of $u_{\infty }$; the measure of strength is based on the order of magnitude of the associated nonlinear forcing term. When a new harmonic component is added, its amplitude is assumed to be zero upstream of its point of introduction. Strong initial growth is therefore perceived immediately downstream of it. Finally, inherent to the PSE approximations, the complex streamwise wavenumber of each mode is updated iteratively at each streamwise station to a threshold of $10^{-6} / Re$, ensuring slow streamwise changes in perturbation shape function. The comparison between DNS and NPSE amplitudes for the no-step case is shown in figure 4. By considering only a single fundamental mode and disabling nonlinear interactions, the procedure provides solutions to the linear parabolised stability equations (LPSE). In this case, the solutions are independent of the initial-mode amplitude, which is matched arbitrarily to the NPSE and DNS amplitude at the inflow.
Chordwise evolution of the amplitude of the crossflow perturbation in the smooth reference case from LPSE (blue symbols), NPSE (white symbols), and DNS (solid lines): Fourier modes  $j = 1- 5$ (thick-to-thin) and $j=0$ (dotted). The vertical red line indicates the virtual step location.

Although possibly relevant, incoming-crossflow-amplitude effects in the interaction with forward-facing steps are generally not a main subject of discussion in the existing literature. The choice of initial (inflow) amplitude considered in this study,  $A_{0} = 3.5 \times 10^{-3} u_{\infty }$ in (2.13), yields a largely linear evolution of the fundamental crossflow perturbation in the DNS until approximately the virtual location of the step. This is justified in that the trend from DNS matches the solution to LPSE at locations $x_{{st}} < 0$ (figure 4). At the same time, the amplitude evolutions from DNS and NPSE are in good agreement throughout the domain, including the stages of nonlinear crossflow saturation.
2.6. Decomposition of the perturbation field based on the local orientation of the base flow
The formulation of the perturbation field introduced in § 2.2 entails a decomposition of the total perturbation into components aligned to the flat-plate coordinate system (2.9). Nevertheless, to gain further insight into the nature of the disturbance mechanisms and the process by which the base flow feeds energy to perturbations, it is instructive to decompose the perturbation field relative to the base-flow orientation (Albensoeder, Kuhlmann & Rath Reference Albensoeder, Kuhlmann and Rath2001; Marxen et al. Reference Marxen, Lang, Rist, Levin and Henningson2009; Lanzerstorfer & Kuhlmann Reference Lanzerstorfer and Kuhlmann2011, Reference Lanzerstorfer and Kuhlmann2012; Loiseau, Robinet & Leriche Reference Loiseau, Robinet and Leriche2016; Picella et al. Reference Picella, Loiseau, Lusseyran, Robinet, Cherubini and Pastur2018). A formulation considering generic spanwise-invariant three-dimensional base flows and stationary spanwise-periodic perturbations is presented next.
In the flat-plate aligned coordinate system, the  $j$th Fourier component of the perturbation field, $\boldsymbol {\upsilon }^{\prime }_{(0,j)}$, is expressed initially as
 \begin{equation} \boldsymbol{\upsilon}^{\prime}_{(0,j)} = u^{\prime}_{(0,j)} \hat{\boldsymbol{\imath}} + v^{\prime}_{(0,j)} \hat{\boldsymbol{\jmath}} + w^{\prime}_{(0,j)} \hat{\boldsymbol{k}}, \end{equation}
where  $u^{\prime }_{(0,j)}, v^{\prime }_{(0,j)}, w^{\prime }_{(0,j)}$ are the complex-valued perturbation components in the $x$-,
$x$-,  $y$- and $z$-directions, respectively, and $\hat {\boldsymbol {\imath }} = [1\;0\;0]^{{\rm T}}$, $\hat {\boldsymbol {\jmath }} = [0\;1\;0]^{{\rm T}}$, $\hat {\boldsymbol {k}} = [0\;0\;1]^{{\rm T}}$. We now decompose $\boldsymbol {\upsilon }^{\prime }_{(0,j)}$ as the sum
 \begin{equation} \boldsymbol{\upsilon}^{\prime}_{(0,j)} = \boldsymbol{\upsilon}_{t,(0,j)}^{\prime} + \boldsymbol{\upsilon}_{n,(0,j)}^{\prime}, \end{equation}
of two vector fields that are complex orthogonal; see Appendix A. The field  $\boldsymbol {\upsilon }_{t,(0,j)}^{\prime }$ is defined as
 \begin{equation} \boldsymbol{\upsilon}_{t,(0,j)}^{\prime} = \tau_{(0,j)}^{\prime} \hat{\boldsymbol{t}}, \end{equation}
i.e. as a complex-valued perturbation component  $\tau _{(0,j)}^{\prime }$ in the direction of the vector $\hat {\boldsymbol {t}}$. The latter is the three-dimensional real-valued unit vector that points in the base-flow direction:
 \begin{equation} \hat{\boldsymbol{t}} = \frac{\boldsymbol{\upsilon}_{{B}}}{\|\boldsymbol{\upsilon}_{{B}}\|}, \end{equation}
where  $\|\boldsymbol {\upsilon }_{{B}}\|$ denotes the magnitude of $\boldsymbol {\upsilon }_{{B}}$. An expression for $\tau _{(0,j)}^{\prime }$ is obtained by evaluating the projection of $\boldsymbol {\upsilon }^{\prime }_{(0,j)}$ onto $\boldsymbol {\upsilon }_{{B}}$:
 \begin{equation} \mathrm{Re}(\tau_{(0,j)}^{\prime}) = \frac{\mathrm{Re}(\boldsymbol{\upsilon}^{\prime}_{(0,j)}) \boldsymbol{\cdot} \boldsymbol{\upsilon}_{{B}}}{\|\boldsymbol{\upsilon}_{{B}}\|},\quad \mathrm{Im}(\tau_{(0,j)}^{\prime}) = \frac{\mathrm{Im}(\boldsymbol{\upsilon}^{\prime}_{(0,j)}) \boldsymbol{\cdot} \boldsymbol{\upsilon}_{{B}}}{\|\boldsymbol{\upsilon}_{{B}}\|}, \end{equation}
where the dot denotes scalar product. Introducing ansatz (2.9) into (2.19a,b) yields
 \begin{equation} \left. \begin{aligned} \mathrm{Re}(\tau_{(0,j)}^{\prime}) & = \frac{1}{\|\boldsymbol{\upsilon}_{{B}}\|} \left( \gamma^{+}_{(0,j)} \cos(j \beta_{0} z) + \gamma^{-}_{(0,j)} \sin(j \beta_{0} z) \right),\\ \mathrm{Im}(\tau_{(0,j)}^{\prime}) & = \frac{1}{\|\boldsymbol{\upsilon}_{{B}}\|} \left( \gamma^{+}_{(0,j)} \sin(j \beta_{0} z) - \gamma^{-}_{(0,j)} \cos(j \beta_{0} z) \right), \end{aligned} \right\} \end{equation}
with
 \begin{equation} \gamma^{+}_{(0,j)}(x,y) = u_{{B}}\,|\tilde{u}|_{(0,j)} \cos(\varphi^{u}_{(0,j)}) + v_{{B}}\, |\tilde{v}|_{(0,j)} \cos(\varphi^{v}_{(0,j)}) + w_{{B}}\,|\tilde{w}|_{(0,j)} \cos(\varphi^{w}_{(0,j)}) \end{equation}
and
 \begin{equation} \gamma^{-}_{(0,j)}(x,y) ={-}u_{{B}}\,|\tilde{u}|_{(0,j)} \sin(\varphi^{u}_{(0,j)}) - v_{{B}}\, |\tilde{v}|_{(0,j)} \sin(\varphi^{v}_{(0,j)}) - w_{{B}}\,|\tilde{w}|_{(0,j)} \sin(\varphi^{w}_{(0,j)}). \end{equation}
Using the sum formulas for sine and cosine, (2.20) can be rewritten as
 \begin{equation} \left. \begin{aligned} \mathrm{Re}(\tau_{(0,j)}^{\prime}) & = \frac{1}{\|\boldsymbol{\upsilon}_{{B}}\|} \sqrt{(\gamma^{+}_{(0,j)})^2 + (\gamma^{-}_{(0,j)})^2}\cos(j \beta_{0} z + \varphi^{\tau}_{(0,j)}),\\ \mathrm{Im}(\tau_{(0,j)}^{\prime}) & = \frac{1}{\|\boldsymbol{\upsilon}_{{B}}\|} \sqrt{(\gamma^{+}_{(0,j)})^2 + (\gamma^{-}_{(0,j)})^2}\sin(j \beta_{0} z + \varphi^{\tau}_{(0,j)}), \end{aligned} \right\} \end{equation}
with the phase  $\varphi ^{\tau }_{(0,j)}$ associated with the perturbation component $\tau ^{\prime }_{(0,j)}$ obtained as
 \begin{equation} \tan(\varphi^{\tau}_{(0,j)}) ={-} \frac{\gamma^{-}_{(0,j)}}{\gamma^{+}_{(0,j)}}. \end{equation}
From (2.23), it follows that
 \begin{equation} \tau_{(0,j)}^{\prime} = \frac{1}{\|\boldsymbol{\upsilon}_{{B}}\|} \sqrt{(\gamma^{+}_{(0,j)})^2 + (\gamma^{-}_{(0,j)})^2}\exp\left({{\rm i}\left( j \beta_{0} z + \varphi^{\tau}_{(0,j)} \right)}\right), \end{equation}
thus
 \begin{equation} \boldsymbol{\upsilon}_{t,(0,j)}^{\prime} = \frac{1}{\|\boldsymbol{\upsilon}_{{B}}\|^2} \sqrt{(\gamma^{+}_{(0,j)})^2 + (\gamma^{-}_{(0,j)})^2}\exp\left({{\rm i} \left( j \beta_{0} z + \varphi^{\tau}_{(0,j)} \right)}\right) \begin{bmatrix} u_{{B}} \\ v_{{B}} \\ w_{{B}} \end{bmatrix}. \end{equation}
Following the nomenclature of the perturbation expressions in global coordinates, we denote the modulus (or amplitude function) of  $\tau _{(0,j)}^{\prime }$ by $|\tilde {\tau }|_{(0,j)}$. Since $\|\hat {\boldsymbol {t}}\|= 1$, $|\tilde {\tau }|_{(0,j)} = \|\boldsymbol {\upsilon }_{t,(0,j)}^{\prime }\|$ and therefore
 \begin{equation} |\tilde{\tau}|_{(0,j)} = \frac{\sqrt{(\gamma^{+}_{(0,j)})^2 + (\gamma^{-}_{(0,j)})^2}}{\|\boldsymbol{\upsilon}_{{B}}\|}. \end{equation}
The norm of the total perturbation vector  $\boldsymbol {\upsilon }^{\prime }_{(0,j)}$ is
 \begin{equation} |\tilde{\psi}|_{(0,j)} = \|\boldsymbol{\upsilon}^{\prime}_{(0,j)}\| = \sqrt{|\tilde{u}|^2_{(0,j)} + |\tilde{v}|^2_{(0,j)} + |\tilde{w}|^2_{(0,j)}}. \end{equation}
3. Topology of the base flow at the step
3.1. Evolution of the base-flow pressure and velocity
With the step present, the organisation of the incoming boundary layer is altered significantly, and a pressure field different from that observed in the smooth case is induced around the step. As detailed in § 2, the free stream features a favourable chordwise pressure gradient throughout the DNS domain. However, whereas  $\partial p_{{B}} / \partial x < 0$ everywhere in the smooth reference case, this does not hold close to the step.
Figure 5(a) depicts  $\partial p_{{B}} / \partial x$ in step case II, which is representative of the trend observed in all step cases. In line with the behaviour described by Duncan et al. (Reference Duncan, Crawford, Tufts, Saric and Reed2014) and Tufts et al. (Reference Tufts, Reed, Crawford, Duncan and Saric2017), regions of adverse pressure gradient are induced upstream and downstream of the step, whereas a strong region of favourable pressure gradient arises locally at the step corner. Sufficiently downstream of $x_{{st}} = 0$, the static pressure field gradually relaxes back to that of the smooth case. This is illustrated in figure 5(b), portraying the chordwise evolution of pressure along a streamline of the base flow. Furthermore, figure 5(b) highlights that a fluid particle moving close to the step corner experiences strong pressure variations in a short $x$-distance. It is also important to note that while the step height is smaller than the incoming boundary-layer thickness, evidently the strong pressure variations in the wall-normal direction extend beyond the boundary layer. This has strong consequences in the ability of classic boundary-layer approximations, in which pressure invariance along $y$ is usually assumed, to describe such flows.
(a) Base-flow chordwise pressure gradient (colour map)  $\partial p_{{B}} / \partial x = 0$ (black dashed line), projected base-flow streamline seeded at $x/\delta _{0} = 0$, $y/\delta _{0} \approx 0.2$ (grey solid line) in step case II. (b) Static pressure along the streamline in the smooth case (thick solid black), step case I (dotted orange), step case II (dash-dotted blue), and step case III (thin solid red).

Compared to the relatively straightforward influence on pressure, the three-dimensional organisation of the base flow at the step is more complex. Figure 6 displays profiles of the base-flow velocity components near the step. Upstream of the step,  $u_{{B}}$ and $w_{{B}}$ have decelerated with respect to the smooth case, and upwash (i.e. vertical fluid motion with $v_{{B}}$) is induced away from the wall. When passing over the step, $u_{{B}}$ and $w_{{B}}$ experience a local chordwise acceleration and deceleration within a short $x$-distance. When considering $u_{{B}}$, this trend is particularly prominent near the wall; the velocity profile first displays a secondary maximum close to the surface, which decays in strength rapidly in $x$. In a similar fashion, upwash induced upstream of the step is first enhanced and later suppressed downstream of the step in the near-wall region. This is not the case for $w_{{B}}$, whose profile does not display abrupt variations in $x$ close to the surface. The latter is attributed largely to the lack of spanwise variations in pressure, inasmuch as the step geometry is invariant in the $z$-direction. Nevertheless, the $w_{{B}}$ velocity component is affected implicitly by the step through the coupling of all three components in the momentum conservation equations.
(a–d) Chordwise, (e–h) spanwise, and (i–l) wall-normal base-flow velocity profiles at (a,e,i)  $x_{{st}} / \delta _{0} = -2.49$, (b,f,j) $x_{{st}} / \delta _{0} = 0.05$, (c,g,k) $x_{{st}} / \delta _{0} = 2.54$, and (d,h,l) $x_{{st}} / \delta _{0} = 5.02$. Lines are smooth case (thin solid black), step case I (dotted orange), step case II (dash-dotted blue), and step case III (thick solid red).

The notably different relative evolutions of  $u_{{B}}$ and $w_{{B}}$ near the wall, a feature that manifests in the experiments of Eppink (Reference Eppink2020) as well, carries a significant horizontal deflection (i.e. change of orientation in the $x$–
$x$– $z$ plane) of the base-flow streamlines, as illustrated in figure 7. In absence of the step, the streamlines in the boundary layer are practically aligned with the direction of the outer inviscid streamlines, as commonly reported in the classical literature on swept-wing boundary layers (Bippes Reference Bippes1999). However, when a step is present, the base-flow streamlines close to the wall deviate significantly from the direction of the inviscid flow and bend outboard, i.e. towards the negative $z$-direction, upstream of the step. Locally, in the vicinity of the step corner, the streamlines display an abrupt inboard turn, i.e. towards the positive $z$-direction. Further downstream, a relaxation towards the inviscid streamline direction is observed. The importance of these observations will be discussed in later sections.
Three-dimensional (a,b) and corresponding projected (c,d) base-flow streamlines with seeds placed at  $(x_{{st}},y,z) / \delta _{0} = (-6,(0,0.4],4.79)$ and $x$–
$x$– $y$ planes of chordwise velocity ( $z > 0$) and spanwise velocity ( $z < 0$) in step case I (a,c) and step case III (b,d). The dashed black line is an equivalent near-wall streamline in the smooth case seeded at the same $y$-position as the lower streamline in the corresponding step case.

The mechanisms responsible for the strong inboard/outboard motion of the base flow near the step are further analysed. The local base-flow direction in the  $x$–
$x$– $z$ plane is characterised by $\sigma _{{B}}$ corresponding to the angle that the unit vector locally tangent to a base-flow streamline projected in the $x$–
$x$– $z$ plane forms with $x$:
$x$:
 \begin{equation} \tan \left( \sigma_{{B}} \right)= \frac{ w_{{B}}} {u_{{B}}}. \end{equation}
The spatial rate of change of  $\sigma _{{B}}$ in $x$ is
 \begin{equation} \dfrac{\partial \sigma_{{B}}}{\partial x} = \dfrac{u_{{B}}\,\dfrac{\partial w_{{B}}}{\partial x} - w_{{B}}\,\dfrac{\partial u_{{B}}}{\partial x}}{u^2_{{B}} + w^2_{{B}}} \end{equation}
or, alternatively, by introducing (2.4) and (2.6) in (3.2),
 \begin{align} \frac{\partial \sigma_{{B}}}{\partial x} &= \frac{1}{u^2_{{B}} + w^2_{{B}}} \left\{ \underbrace{-v_{{B}}\,\frac{\partial w_{{B}}}{\partial y}}_{{\mathcal{A}}_{w}} + \underbrace{\nu \left( \frac{\partial^2 w_{{B}}}{\partial x^2} + \frac{\partial^2 w_{{B}}}{\partial y^2} \right)}_{\mathcal{D}_{w}} \right.\nonumber\\ &\quad \left. - \left( \frac{w_{{B}}}{u_{{B}}} \right) \left( \underbrace{-v_{{B}}\, \frac{\partial u_{{B}}}{\partial y}}_{\mathcal{A}_{u}} \underbrace{{}- \frac{1}{\rho}\, \vphantom{\frac{\partial ghost}{\partial y}}\frac{\partial p_{{B}}}{\partial x}}_{\mathcal{P}} + \underbrace{\nu \left( \frac{\partial^2 u_{{B}}}{\partial x^2} + \frac{\partial^2 u_{{B}}}{\partial y^2} \right)}_{\mathcal{D}_{u}} \right) \right\}. \end{align}
Equation (3.3) expresses the spatial rate of change of the angle  $\sigma _{{B}}$ in $x$ as a function of the momentum-transport mechanisms in the $x$- and $z$-base-flow momentum conservation equations. Since $w_{{B}} < 0$ everywhere, $\sigma _{{B}} < 0$ in the coordinate system used here. Considering that the current analysis is restricted to regions of non-separated flow, i.e. where $u_{{B}} > 0$, $\partial \sigma _{{B}} / \partial x > 0$ signifies inboard-turning base-flow motion, whereas $\partial \sigma _{{B}} / \partial x < 0$ signifies outboard-turning base-flow motion.
Figure 8(a) portrays the chordwise evolution of  $\partial \sigma _{{B}} / \partial x$ at $y = \tilde {y}^{u}_{(0,1)}$ (§ 2.2), the wall-normal location at which the core of the fundamental crossflow perturbation passes over the step, $(y-h) / \delta _{0} \approx 0.5$ at $x_{{st}} = 0$. Figure 8(a) highlights that at this wall-normal location, the base-flow motion at the step is inboard-dominated. Moreover, the inboard motion appears to be a function of the step height.
Rate of change in  $x$ of the horizontal deflection of base-flow streamlines, $\partial \sigma _{{B}} / \partial x$, at (a) the wall-normal location $y = \tilde {y}^{u}_{(0,1)}$, and (b) $y / \delta _{0} = h / \delta _{0} + 0.12$, in the smooth case (thin solid black), step case I (dotted orange), step case II (dash-dotted dark blue), and step case III (thick solid red). Rate of change decomposition for step case III (c,d corresponding to a,b, respectively) expressed as the contributions defined in (3.3). (c,d) Plots for $\partial \sigma _{{B}} / \partial x$ (thick solid red), ${\mathcal {A}}_{w}$ (magenta and crosses), $\mathcal {D}_{w}$ (grey and triangles), $\mathcal {A}_{u}$ (green and squares), $\mathcal {P}$ (yellow and circles), and $\mathcal {D}_{u}$ (light blue and diamonds).

Figures 8(c,d) represent additionally the decomposition of the rate of change in step case III as a sum of contributions of the different momentum-transport mechanisms defined in (3.3). On the one hand, the terms  $-v_{{B}}\,\partial u_{{B}} / \partial y$ and $-v_{{B}}\,\partial w_{{B}} / \partial y$ act by decelerating the $u_{{B}}$ and $w_{{B}}$ boundary-layer profiles; momentum advection in the wall-normal direction moves low-momentum fluid towards upper portions of the boundary layer. However, these terms yield a quasi-null total contribution in figure 8(c) since they act opposite to each other and streamline bending results from an excess of $u_{{B}}$ over $w_{{B}}$, or vice versa. On the other hand, the pressure force accelerates $u_{{B}}$ in $x$ since the region above the step corner displays large $\partial p_{{B}} / \partial x < 0$ (figure 5). This causes an imbalance between $u_{{B}}$ and $w_{{B}}$, which manifests as inboard bending of the base-flow streamlines at the step, far from the wall. As mentioned earlier, $w_{{B}}$ does not explicitly react to changes of pressure in the $z$-direction, as the base flow is spanwise-invariant.
Furthermore, the effect of the step on the streamline bending appears to depend strongly on the wall-normal location of interest. In the near-wall region, the motion of the base flow in the  $x$–
$x$– $z$ plane is more pronounced than in the region far from the wall. This is illustrated in figure 8(b), characterising $\partial \sigma _{{B}} / \partial x$ at $y / \delta _{0} = h / \delta _{0} + 0.12$, when compared to figure 8(a). Initially at $x_{{st}} = 0$, the base-flow motion is inboard-dominated. Changing rapidly in $x$, it displays a sharp outboard turn, whereas the streamlines far from the wall maintain a mild inboard motion. This creates a strong diverging pattern of base-flow streamlines within a short wall-normal distance.
The mechanisms leading to the sudden inboard–outboard streamline bending in the near-wall regime are highlighted in figure 8(d) representing step case III. In a fashion similar to the results of figure 8(c), the favourable pressure gradient induced at the step corner first contributes largely to the sharp inboard turn. When moving downstream of  $x_{{st}} = 0$, the effect of the pressure force reverses; the strong adverse pressure gradient close to the wall (figure 5) decelerates $u_{{B}}$ in $x$. This effect, in combination with the imbalance between the advection momentum transport mechanisms $-v_{{B}}\,\partial u_{{B}} / \partial y$ and $-v_{{B}}\, \partial w_{{B}} / \partial y$, cause the base-flow streamlines near the wall to bend outboard. Further downstream, the step-induced upwash decays, and eventually, the viscous forces associated with the gradients of $u_{{B}}$ take over as the dominant mechanism opposing the effect of pressure.
3.2. Local flow reversal and modification of the crossflow component
Next to the strong spanwise streamline modulation, flow separation (i.e. reversal of  $u_{{B}}$) is a main feature of the base flow near the step. The existence of step-induced regions of recirculating flow in the three-dimensional swept-wing boundary layer and the associated connection with the development of crossflow instabilities is a point of debate in recent studies. Whereas flow reversal upstream of the step is expected and widely reported (Tufts et al. Reference Tufts, Reed, Crawford, Duncan and Saric2017; Eppink Reference Eppink2020), discrepancies arise with regard to the downstream region. In the present DNS, flow reversal downstream of the step is identified in all step cases, as highlighted by the negative wall shear $({\rm d}u_{{B}} / {{\rm d} y})|_{{w}}$ measured in this region (figure 9). However, in step case I, the strength of the reverse flow is significantly lower than in step cases II and III; see table 3.
(a) Base-flow chordwise velocity (colour map) with lines of constant streamfunction (solid black). (b,c) Wall shear  $({\rm d}u_{{B}}/{{\rm d} y})|_{{w}}$: smooth case (thick solid black), step case I (dotted orange), step case II (dash-dotted blue), and step case III (thin solid red).

Properties of the flow recirculation regions at the step based on the dividing streamline. Here,  $a$ indicates below grid resolution.

The topology of the regions of recirculating flow is analysed further by the use of a streamfunction ( $\varPsi _B$) representation of the spanwise-invariant base flow in the $x$–
$x$– $y$ plane. Figure 9 portrays isolines of $\varPsi _{{B}}$ in step case III. Their organisation is in agreement with the widely reported behaviour of two-dimensional forward-facing-step flows; see Wilhelm et al. (Reference Wilhelm, Härtel and Kleiser2003) and Marino & Luchini (Reference Marino and Luchini2009), for instance. The region of recirculating flow upstream of the step reattaches at the vertical face of the wall. A second smaller region of flow separation arises immediately downstream of the step. It should be stressed that in the present three-dimensional boundary-layer flow, the recirculating regions extend infinitely in the spanwise direction, and the reattachment point in figure 9 ought to be conceived as an attachment line along $z$. As noted by Tufts et al. (Reference Tufts, Reed, Crawford, Duncan and Saric2017), the flow separation in three-dimensional space represents helical flow that arises from the combination of recirculation motion and spanwise velocity.
The geometrical properties of the separation regions upstream and downstream of the step are characterised quantitatively by means of the corresponding projected dividing streamline, i.e. the isoline of  $\varPsi _{{B}}$ that connects the separation and reattachment points. A summary of properties is given in table 3. An increase in step height leads to a significant elongation of the separation zones in $x$, especially in the downstream region. However, the cores of the reverse-flow regions are maintained rather close to $x_{{st}} = 0$. The peak reverse-flow velocity within the downstream recirculation regions is $1.4\,\%$ and $2.7\,\%$ in step cases II and III, respectively, relative to the local pseudo-free-stream velocity. These values are significantly lower than the threshold required for global or absolute instability mechanisms to develop in classic pressure-induced separation bubbles (Alam & Sandham Reference Alam and Sandham2000; Rodríguez, Gennaro & Juniper Reference Rodríguez, Gennaro and Juniper2013).
Previous investigations identify the regions of flow reversal as a key feature to explain the modified properties of the incoming crossflow disturbance at the step. Tufts et al. (Reference Tufts, Reed, Crawford, Duncan and Saric2017) suggest interaction between the step-induced recirculating flow and the crossflow vortices. As will be shown later, in §§ 4.3 and 4.4, there appears to be little evidence in the present results to support the model proposed by Tufts et al. (Reference Tufts, Reed, Crawford, Duncan and Saric2017). Stationary crossflow growth at the step is ascribed by Eppink (Reference Eppink2020) to the destabilising effect of the inflectional profiles that develop due to flow separation and/or reversal of the crossflow component. Crossflow reversal, i.e. change of sign of the crossflow velocity, is captured in the present DNS as well. This phenomenon is linked to the abrupt change of orientation of the near-wall streamlines discussed in the previous section.
The crossflow component,  $w_{{B},s}$, as defined in (2.12), originates from the imbalance between chordwise and spanwise momentum in the boundary layer, relative to the orientation of the inviscid streamline. In the no-step case, the crossflow velocity is positive in the coordinate system used here. In the vicinity of the step, the influence of the step-induced pressure gradient is weak in the free-stream region. Consequently, the angle $\phi _{s}$ (see (2.11)) between the inviscid streamline and $x$ does not change significantly in $x$ (figure 3). The pronounced outboard bending of the streamlines in the near-wall region upstream of the step reverses the crossflow velocity, which becomes negative in all step configurations close to the wall. This is illustrated in figures 10(a,b). From (2.12), it can be conceived as a consequence of the effective deceleration of $u_{{B}}$, as compared to $w_{{B}}$, whereas $\phi _{s} \approx -45^{\circ }$ does not undergo large variations in $x$.
$x$.
Crossflow velocity profile near the step: smooth case (thin solid black), step case I (dotted orange), step case II (dash-dotted blue), step case III (thick solid red) at (a)  $x_{{st}} / \delta _{0} = -9.56$, (b) $x_{{st}} / \delta _{0} = -0.97$, (c) $x_{{st}} / \delta _{0} = 0.05$, (d) $x_{{st}} / \delta _{0} = 2.86$.

At the immediate downstream vicinity of the step, the flow behaviour follows an opposite trend. The sudden inboard motion of the near-wall flow associated with the rapid acceleration of  $u_{{B}}$ (figure 6b) carries a strong acceleration of the crossflow component, which becomes positive again. As highlighted in figure 10(c), the peak value of the crossflow component in the step cases attains more than twice the value in the smooth case. When moving further downstream, $u_{{B}}$ decelerates in $x$ close to the wall (figure 6c), in the region of adverse pressure gradient. As a consequence, a second zone of crossflow reversal emerges near the wall; see figure 10(d). Further from the wall, the excess of $u_{{B}}$ relative to $w_{{B}}$ induced at the step corner maintains the crossflow component in the step cases positive and stronger than in the smooth case.
4. Evolution of the perturbation field at the step
In classic studies of the stationary crossflow instability, special attention is paid to the topology and behaviour of the characteristic co-rotating vortices that arise in the developed flow field. The evolution of stationary crossflow vortices is accompanied by a characteristic wavy fluid motion, i.e. a modulation of the flow field in the spanwise and chordwise directions. Naturally, the wavy motion is accentuated as the perturbation amplifies in  $x$. A graphical representation of the developed chordwise velocity field in the smooth reference case is provided as supplementary material available at https://doi.org/10.1017/jfm.2022.456. It must be noted that the isolated form of the crossflow instability as a perturbation structure manifests itself as patches of vorticity of alternating sign in $z$ (Bippes Reference Bippes1999; Hosseinverdi & Fasel Reference Hosseinverdi and Fasel2016) accompanied by spanwise-distributed regions of perturbation-velocity excess and deficit (see the supplementary material). Since the activity of the harmonic components is weak at the $x$-position of the step (§ 2.5), the fundamental perturbation component, $u^{\prime }_{(0,1)} + u^{\prime \;{\dagger} }_{(0,1)}$, is very similar to the total perturbation field near the step.
The presence of the forward-facing step and the associated changes on the underlying base flow complicate further the identification of vortical structures. In particular, close to the step, it is challenging to identify visually the structure of the developed crossflow vortices using classical vortex-identification techniques such as the  $Q$-criterion (Hunt, Wray & Moin Reference Hunt, Wray and Moin1988). In step case I, the characteristic spanwise-modulated pattern in the developed flow field is maintained rather invariant when passing the step in $x$ (see the supplementary material). This is not the case in step configuration III, as a strong distortion of the developed-flow motion is evident, and the organisation of the total perturbation field immediately downstream of the step is more pronounced (figures 11a,b) than in the smooth case. At the same time, the total and fundamental perturbation fields in step case III differ significantly from each other (figures 11b,c), suggesting an enhancement of the harmonic activity at the step. To segregate pertinent disturbance mechanisms, the analysis is commenced by describing the evolution of the fundamental perturbation field, $\boldsymbol {q}^{\prime }_{(0,1)}$.
Organisation of the chordwise velocity of (a) the developed flow, (b) the total perturbation field, and (c) the fundamental perturbation field, in step case III.

4.1. Organisation of the fundamental perturbation field  ${\boldsymbol{q}}^{\prime }_{(0,1)}$

For all cases, sufficiently upstream of the step, the profiles along  $y$ of the amplitude function of the fundamental Fourier component, $|\tilde {u}|_{(0,1)}$, display the single-peaked topology characteristic of the crossflow instability. Nevertheless, in the upstream vicinity of the step, profiles of $|\tilde {u}|_{(0,1)}$ develop a secondary peak close to the wall; see figures 12(a–c). When considering the corresponding three-dimensional perturbation representation, $u^{\prime }_{(0,1)} + u^{\prime \;{\dagger} }_{(0,1)}$, the secondary peak in the amplitude function manifests as a system of velocity-perturbation streaks of alternating sign along the spanwise direction. This is illustrated in figure 11(c).
Amplitude function  $|\tilde {u}|_{(0,1)}$ profiles close to the step, with $x_{{st}} / \delta _{0}$ values: (a) $-2.04$, (b) $-0.45$, (c) $-0.07$, (d) $0.01$, (e) $0.61$, (f) $2$, (g) $5$, (h) $8$. Smooth case (thin solid black), step case I (dotted orange), step case II (dash-dotted blue), and step case III (thick solid red).

Downstream of the step, a near-wall peak in the amplitude function  $|\tilde {u}|_{(0,1)}$ co-existing with the original primary peak is captured as well; see figures 12(d–h). The existence of a secondary peak in the amplitude function profile is found for all $x_{{st}} > 0$ in the near-step regime and for all step cases. When moving downstream of $x_{{st}} = 0$ in the largest step case, the secondary peak exhibits strong growth in amplitude and eventually becomes more prominent than the primary peak. This trend is reverted further downstream, as the secondary peak decays in amplitude rapidly in $x$ and merges back to the main profile. The associated near-wall perturbation-streak system (figure 11c) behaves accordingly. Weak manifestations of the secondary peak in the amplitude function $|\tilde {u}|_{(0,1)}$ develop in step cases I and II as well, but never surpass the primary peak in strength.
The existence of a secondary near-wall peak in the perturbation shape has been reported in previous investigations and pointed out as a relevant feature of the interaction between the incoming crossflow instability and the step (Tufts et al. Reference Tufts, Reed, Crawford, Duncan and Saric2017; Eppink Reference Eppink2020; Casacuberta et al. Reference Casacuberta, Hickel and Kotsonis2021). Furthermore, the aforementioned works, and more recently Rius-Vidales & Kotsonis (Reference Rius-Vidales and Kotsonis2021), indicate that the incoming crossflow perturbation mode deflects away from the wall when passing over the step. The present results support this observation, as shown in figures 12(a–c). Additionally, Casacuberta et al. (Reference Casacuberta, Hickel and Kotsonis2021) observe that the near-wall streaks downstream of the step are accompanied by stationary vortex-like perturbation structures that coexist with the incoming (crossflow) perturbation structures at the step. Secondary near-wall perturbations that are structurally similar to the ones reported by Casacuberta et al. (Reference Casacuberta, Hickel and Kotsonis2021) are identified in the present study; these manifest as spanwise-distributed patches of opposite vorticity and have the same spanwise wavenumber as the primary vortices. Nevertheless, these near-wall perturbation structures accompanying the streaks are referred to hereafter as secondary since they are additional elements not present in the smooth case.
4.2. Perturbation amplification upstream of the step
Next to describing the spatial evolution of the fundamental perturbation system  $\boldsymbol {q}^{\prime }_{(0,1)}$, a main goal motivating the current analysis is to quantify the effect of the step in altering the properties of the pre-existing stationary crossflow instability. In the present subsection, the focus is put on effects upstream of the step.
A first metric employed to characterise the amplification of the fundamental crossflow perturbation is the chordwise evolution of amplitude identified as the primary peak of  $|\tilde {u}|_{(0,1)}$. This amplitude definition is at present denoted by $A^{u}_{(0,1)}$ (§ 2.2); as pointed out previously, a secondary peak in the perturbation amplitude function develops upstream of the step but, unlike the downstream region, it does not surpass the primary peak in strength in any step case. Thus $|\tilde {u}|^{{top}}_{(0,1)} = |\tilde {u}|^{{max}}_{(0,1)}$ upstream of the step. It is emphasised that the latter relation does not apply when considering the perturbation components $w^{\prime }_{(0,1)}$ and $v^{\prime }_{(0,1)}$ since secondary peak(s) may become more prominent than the primary peak (Casacuberta et al. Reference Casacuberta, Hickel and Kotsonis2021).
Lines in figure 13 indicate the chordwise evolution of  $A^{u}_{(0,1)}$ measured in the present DNS. Based on the choice of amplitude $A^{u}_{(0,1)}$, it is evident that the fundamental crossflow perturbation becomes amplified gradually upstream of the step. Moreover, the overall upstream amplification with respect to the reference case appears to be proportional to the step height.
Amplitude of the fundamental chordwise-velocity perturbation component from DNS (lines) and PSE (symbols) upstream of the step: smooth case (thin solid black line and circles), step case I (dash-dotted orange line and triangles), step case II (dash-dotted blue line and diamonds), and step case III (thick solid red line and squares). Vertical lines indicate the beginning of disagreement between DNS and PSE ( $1\,\%$ relative error).

To gain additional insight into the underlying mechanisms for the observed upstream amplification, it is instructive to monitor reduced approximations to the instability growth. A powerful technique for this is a PSE analysis of the DNS base flow. The comparison between DNS and PSE exposes the effect of inherent PSE assumptions, such as quasi-parallelism, on the manifestation of amplification due to the step. On the other hand, the present problem serves as an ideal platform to assess the limitations of a classic stability method such as the PSE when they are applied in the presence of a sharp geometrical discontinuity. Cooke et al. (Reference Cooke, Mughal, Sherwin, Ashworth and Rolston2019) report that the PSE method suffers from lack of numerical convergence when it is marched over the step due to the restriction concerning the minimum marching step size.
The LPSE are solved in the domain  $x_{{st}} < 0$. The present choice of initial (inflow) DNS perturbation amplitude yields a largely linear behaviour of the crossflow perturbation until reasonably close to the step (§ 2.5). Thus the LPSE method has been considered for the analysis of the upstream regime. The numerical set-up is identical to that employed for the cross-validation with the reference DNS case; see § 2.5. The amplitude obtained by solving the LPSE is represented by symbols in figure 13. A first main observation is numerical convergence of the method until the upstream vicinity of the step; this result was unanticipated, inasmuch as the near-step region contains areas of flow recirculation and non-negligible chordwise base-flow derivatives and upwash, which are a priori violations of the underlying assumptions of the PSE method (Herbert Reference Herbert1997). A second major result of figure 13 is that the LPSE capture a main part of the upstream amplification process, as indicated by the match in amplitude evolution between DNS and LPSE until significantly close to the step. Therefore, the crossflow disturbance undergoes primarily linear growth evolution supported by the step-distorted base flow, and the strong non-parallel effects introduced by the step do not impact significantly the main amplification process in the upstream regime.
The perturbation shape profiles obtained by DNS and LPSE are in excellent agreement in the region of reasonably close amplitude match; see figures 14(a,b) representing step case III. Figure 14(c) portrays additionally the perturbation shape at an  $x$-station immediately upstream of the step. Major differences in figure 14(c) arise in the near-wall region; the secondary peak present in the results from DNS is not captured by the LPSE. The present results show that the PSE method is robust in a region with non-negligible non-parallel effects.
Profiles of the normalised amplitude function  $|\tilde {u}|_{(0,1)}$ from DNS (solid line) and PSE (symbols) upstream of the step at $x_{{st}} / \delta _{0}$ values: (a) $-4.5$, (b) $-2.5$, and (c) $-0.5$.

It should be noted that in the present DNS, the fundamental crossflow instability amplifies upstream of the step in a regime where the strength of the base-flow crossflow component decreases significantly in  $x$ (figure 10). Under parallel-flow approximations, Mack (Reference Mack1984) indicates that the linear local instability characteristics are governed by the directional profile, i.e. the profile of the three-dimensional boundary layer in the direction of the wavenumber vector (Bippes Reference Bippes1999); in a classic swept-wing boundary layer without steps, the wavenumber vector is roughly parallel to the direction of the crossflow component (2.12). However, the present results pose the question of whether the inference of stability characteristics of the perturbation system from the properties of the crossflow profile holds valid near the step.
4.3. Modal and non-modal growth at the step
The discussion on the mechanisms of interaction between the fundamental crossflow perturbation and step-induced flow features is next extended to the region around the step, and the physical nature of the mechanisms that govern the disturbance evolution.
When studying the stationary three-dimensional perturbation behaviour in a two-dimensional separated boundary layer, Marxen et al. (Reference Marxen, Lang, Rist, Levin and Henningson2009) find that a mixture of modal and non-modal growth governs the disturbance evolution. Similarities with Marxen et al. (Reference Marxen, Lang, Rist, Levin and Henningson2009) appear in the presently inspected flow, specifically, the step-induced region of favourable-to-adverse pressure gradient and the separation bubble. Nevertheless, a major difference in the present case is the existence of the modal crossflow instability upstream of the step, which was not considered by Marxen et al. (Reference Marxen, Lang, Rist, Levin and Henningson2009). Based on the observations of Marxen et al. (Reference Marxen, Lang, Rist, Levin and Henningson2009), the rapid deflection of the base flow compared to the smooth reference case can be expected to be fertile for the development of non-modal growth in the present case. Thus to inspect possible non-modal mechanisms near the step, the growth rate of the fundamental velocity-perturbation vector,  $\boldsymbol {v}^{\prime }_{(0,1)}$, decomposed following the base-flow orientation (2.16), is evaluated here. In the case of pure modal growth, different velocity components ought to exhibit a (reasonably) common growth rate, implying the existence of a single growing eigenmode (Marxen et al. Reference Marxen, Lang, Rist, Levin and Henningson2009).
The following analysis is carried out by considering the amplitude functions corresponding to the modulus of the fundamental perturbation vector itself,  $|\tilde {\psi }|_{(0,1)}$ (see (2.28)), and to the component of the perturbation vector tangential to the base-flow direction, $|\tilde {\tau }|_{(0,1)}$ (see (2.27)). The former is portrayed in figure 15 for the reference case and for the step cases. In step configuration III (figure 15d), the near-wall secondary peak in the perturbation amplitude function downstream of the step surpasses the primary peak in strength. Similar observations apply to $|\tilde {\tau }|_{(0,1)}$. Casacuberta et al. (Reference Casacuberta, Hickel and Kotsonis2021) propose that under these circumstances, the global maxima of the perturbation amplitude function measures inherently the growth of the near-wall secondary structures. A more representative characterisation of the amplification of the incoming perturbation is obtained instead by tracking the evolution of the original primary peak. A similar metric can be devised considering $|\tilde {\psi }|^{{top}}_{(0,1)}$ and $|\tilde {\tau }|^{{top}}_{(0,1)}$ instead of $|\tilde {\psi }|^{{max}}_{(0,1)}$ and $|\tilde {\tau }|^{{max}}_{(0,1)}$ (see § 2.2). The associated wall-normal locations are denoted by $\tilde {y}^{\psi }_{(0,1)}$ (indicated in figure 15 by solid circles) and by $\tilde {y}^{\tau }_{(0,1)}$, respectively. Additionally, dotted and solid lines in figure 15 represent $u_{{B}} = 0$ and the locations of inflection points in the crossflow component, respectively.
Fundamental total amplitude function contour, wall-normal position of maximum amplitude  $|\tilde {\psi }|^{{top}}_{(0,1)}$ (circles), loci of base-flow crossflow inflection points (solid cyan), and base-flow reversal $u_{{B}} = 0$ (dotted green), in (a) the smooth case, (b) step case I, (c) step case II, and (d) step case III.

Figure 16 shows the chordwise evolution of the growth rate associated with  $|\tilde {\psi }|^{{top}}_{(0,1)}$ and $|\tilde {\tau }|^{{top}}_{(0,1)}$ computed following definition (2.10). In the reference case, as well as sufficiently upstream and downstream of the step, the fundamental perturbation vector and its component parallel to the base flow have similar growth rates. Following the discussion provided by Marxen et al. (Reference Marxen, Lang, Rist, Levin and Henningson2009), this indicates that perturbation growth is due largely to a modal instability, which is associated naturally with the incoming crossflow instability. On the other hand, the significant differences between the growth rate evolution in the vicinity of the step in figures 16(b–d) provide a first indication of possible non-modal perturbation growth. Since the single modal crossflow instability manifests again shortly downstream of the step, it is reasonable to consider a combination of modal and non-modal mechanisms governing the perturbation evolution at the step.
Growth rates associated with  $|\psi |^{{top}}_{(0,1)}$ (dashed) and $|\tau |^{{top}}_{(0,1)}$ (solid) in (a) the smooth case, (b) step case I, (c) step case II, and (d) step case III.

The realisation that different (base-flow-oriented) perturbation components display a significantly different growth rate evolution at the step poses the challenge of establishing a global estimation for the amplification in this regime. For instance, Casacuberta et al. (Reference Casacuberta, Hickel and Kotsonis2021) find that immediately downstream of the step,  $u^{\prime }_{(0,1)}$ shows destabilisation, whereas $v^{\prime }_{(0,1)}$ shows stabilisation. Based on this disparity, one may conclude that energy-based criteria, encompassing simultaneously the evolutions of all perturbation components, are more suitable. The perturbation kinetic energy density of the Fourier space $j\beta _{0}$ is
 \begin{equation} E_{j\beta_{0}} = \frac{1}{2} \int^{\infty}_{0} \left( u^{\prime\;{\dagger}}_{(0,j)} u^{\prime}_{(0,j)} + v^{\prime\;{\dagger}}_{(0,j)} v^{\prime}_{(0,j)} + w^{\prime\;{\dagger}}_{(0,j)} w^{\prime}_{(0,j)} \right)\,{\rm d} y = \frac{1}{2} \int^{\infty}_{0} |\tilde{\psi}|^2_{(0,j)}\,{\rm d} y. \end{equation}
The norm of the fundamental perturbation vector,  $|\tilde {\psi }|_{(0,1)}$, serves hereafter as a metric to characterise growth or decay at the step.
In a fashion similar to the previous analysis, we evaluate the growth of the primary peak of the amplitude function,  $|\tilde {\psi }|^{{top}}_{(0,1)}$, thus avoiding possible artefacts from the amplification of the secondary near-wall structures at the step. The chordwise evolution of amplitude associated with $|\tilde {\psi }|^{{top}}_{(0,1)}$ in the vicinity of the step is illustrated in figure 17. At first glance, the amplitude curves of step cases I and II maintain a rather constant growth in the region where non-modal growth sets in, possibly indicating that its effect is mild in comparison to the modal growth associated with the original pre-existing instability. However, step case III appears to differ considerably. The curve of step case III initially displays growth downstream of the step, but this is followed rapidly by a sudden and strong amplitude decay in the downstream direction. Therefore, based on the current choice of amplitude characterisation, the fundamental crossflow perturbation emerges significantly stabilised immediately downstream of a large step.
Chordwise evolution of the amplitude associated with  $|\psi |^{{top}}_{(0,1)}$ in the smooth case (thick solid black), step case I (dotted orange), step case II (dashed-dotted blue), and step case III (thin solid red).

The current observations are in contrast to conclusions drawn by Tufts et al. (Reference Tufts, Reed, Crawford, Duncan and Saric2017), who indicate that for large steps, the interaction between the downstream region of flow recirculation and the incoming crossflow vortices amplifies the perturbation. Eppink (Reference Eppink2020) reports stationary crossflow amplification at the step as well; the author attributes it to the destabilising effect of the inflectional profiles arising in the regions of flow separation and crossflow reversal. Increasing the step height results in enhanced stationary crossflow-instability growth driven by the enhancement of reverse-flow regions (Eppink Reference Eppink2020). Nevertheless, both aforementioned studies do not discriminate between possible locally formed near-wall structures and the pre-existing crossflow instability. As such, in the region where the amplitude of the near-wall structure dominates, a local rapid growth is recorded. In contrast, in the present study, monitoring only the primary instability amplitude reveals a milder impact – and even stabilisation – caused by the highest step.
In summary, the present DNS indicate that the near-step regime encompasses a mixture of perturbation mechanisms acting simultaneously. Secondary near-wall structures are induced at the step; their growth is not captured by the LPSE, despite the remarkable ability of the latter to model the amplitude and shape of the incoming crossflow instability up to close vicinity of the step. Additionally, differences in the growth rate in different directions point to non-modal effects feeding growth to certain perturbation components. Finally, large differences in perturbation growth rate are identified, depending on the wall-normal position at which the latter is evaluated. Previous work on forward-facing-step flows in the absence of a crossflow instability (Lanzerstorfer & Kuhlmann Reference Lanzerstorfer and Kuhlmann2012) has identified spanwise-distributed near-wall velocity streaks, structurally similar to the secondary structures reported here. This suggests that the near-wall vortex-like structures and streaks can exist independently from (but possibly triggered and conditioned in wavelength and phase by) the pre-existing crossflow perturbation. Furthermore, regardless of their nature and origin, the near-wall secondary structures decay rapidly in  $x$ and merge eventually with the primary crossflow vortices. Accordingly, it becomes important to characterise the impact of the step on the incoming fundamental crossflow perturbation by evaluating the stability properties of the perturbation system in the region far from the wall, where the incoming primary structures lift up and pass over the step.
4.4. Perturbation misalignment and energy-transfer mechanisms at the step
Based on the observations in the previous subsection, non-modal growth mechanisms, in conjunction with the primary modal instability growth, likely play a role near the step. Marxen et al. (Reference Marxen, Lang, Rist, Levin and Henningson2009) relate a modal instability in which all perturbation components exhibit a common growth rate in  $x$ to the perturbation vector maintaining its orientation with respect to the base flow. Following this reasoning, the observed differences displayed by different perturbation components in figure 16 suggests a link to a local misalignment between the base-flow vector and the perturbation vector at the step. This misalignment can be expected in a region of strong and sudden spanwise base-flow modulation (figures 7 and 8). To explore this in detail, the perturbation-vector field $\boldsymbol {\upsilon }^{\prime }_{(0,j)}$ and its component aligned with the base-flow direction, $\boldsymbol {\upsilon }^{\prime }_{t,(0,j)}$, are considered (see (2.16)). The analysis carried out next is generalised for any Fourier component; the discussion will focus on the fundamental mode, which is the scope of the current section. Since $\boldsymbol {\upsilon }^{\prime }_{(0,j)}$ and $\boldsymbol {\upsilon }^{\prime }_{t,(0,j)}$ are complex-valued, the a priori complex-valued angle $\zeta _{(0,j)}$ between $\boldsymbol {\upsilon }^{\prime }_{(0,j)}$ and $\boldsymbol {\upsilon }^{\prime }_{t,(0,j)}$ is introduced (Scharnhorst Reference Scharnhorst2001) by
 \begin{equation} \cos \left( \zeta_{(0,j)} \right) = \frac{\boldsymbol{\upsilon}^{\prime}_{(0,j)} \boldsymbol{\cdot} \boldsymbol{\upsilon}^{\prime}_{t,(0,j)}}{\|\boldsymbol{\upsilon}^{\prime}_{(0,j)}\|\;\|\boldsymbol{\upsilon}^{\prime}_{t,(0,j)}\|}, \end{equation}
whereas the real-valued Euclidean angle  $\zeta _{{E},(0,j)}$ between $\boldsymbol {\upsilon }^{\prime }_{(0,j)}$ and $\boldsymbol {\upsilon }^{\prime }_{t,(0,j)}$ is defined by (Scharnhorst Reference Scharnhorst2001)
 \begin{equation} \cos \left( \zeta_{{E},(0,j)} \right) = \frac{\mathrm{Re} \left( \boldsymbol{\upsilon}^{\prime}_{(0,j)} \boldsymbol{\cdot} \boldsymbol{\upsilon}^{\prime}_{t,(0,j)} \right)}{\|\boldsymbol{\upsilon}^{\prime}_{(0,j)}\|\;\|\boldsymbol{\upsilon}^{\prime}_{t,(0,j)}\|}. \end{equation}
It must be noted that
 \begin{equation} \boldsymbol{\upsilon}^{\prime}_{(0,j)} \boldsymbol{\cdot} \boldsymbol{\upsilon}^{\prime}_{t,(0,j)} = \left( \boldsymbol{\upsilon}^{\prime}_{t,(0,j)} + \boldsymbol{\upsilon}^{\prime}_{n,(0,j)} \right) \boldsymbol{\cdot} \boldsymbol{\upsilon}^{\prime}_{t,(0,j)} = \boldsymbol{\upsilon}^{\prime}_{t,(0,j)} \boldsymbol{\cdot} \boldsymbol{\upsilon}^{\prime}_{t,(0,j)} = \|\boldsymbol{\upsilon}^{\prime}_{t,(0,j)}\|^2 \end{equation}
since  $\boldsymbol {\upsilon }^{\prime }_{t,(0,j)}$ and $\boldsymbol {\upsilon }^{\prime }_{n,(0,j)}$ are complex orthogonal; see Appendix A. As a consequence, (4.2) and (4.3) are equivalent, thus $\zeta _{(0,j)} = \zeta _{{E},(0,j)}$. Furthermore, considering (4.4), expression (4.2) can be rewritten as
 \begin{equation} \cos \left( \zeta_{(0,j)} \right) = \frac{\|\boldsymbol{\upsilon}^{\prime}_{t,(0,j)}\|}{\|\boldsymbol{\upsilon}^{\prime}_{(0,j)}\|} = \frac{|\tilde{\tau}|_{(0,j)}}{|\tilde{\psi}|_{(0,j)}}, \end{equation}
implying that  $\zeta _{(0,j)} = \zeta _{(0,j)} (x,y)$.
The rate of change of the angle  $\zeta _{(0,j)}$ in $x$ can be related directly to the relative growth rate evolution of the perturbation components. We first evaluate the chordwise derivative of $\zeta _{(0,j)}$:
 \begin{equation} \dfrac{\partial}{\partial x} \left( \cos \left( \zeta_{(0,j)} \right) \right) = \dfrac{\dfrac{\partial}{\partial x} \left( |\tilde{\tau}|_{(0,j)} \right) |\tilde{\psi}|_{(0,j)} - \dfrac{\partial}{\partial x} \left( |\tilde{\psi}|_{(0,j)} \right) |\tilde{\tau}|_{(0,j)}}{|\tilde{\psi}|_{(0,j)}^2}. \end{equation}
From (4.6),
 \begin{equation} \dfrac{\dfrac{\partial}{\partial x} \left( |\tilde{\tau}|_{(0,j)} \right)}{|\tilde{\tau}|_{(0,j)}} \neq \dfrac{\dfrac{\partial}{\partial x} \left( |\tilde{\psi}|_{(0,j)} \right)}{|\tilde{\psi}|_{(0,j)}}\quad\Rightarrow\quad\dfrac{\partial}{\partial x} \left( \zeta_{(0,j)} \right) \neq 0. \end{equation}
 Condition (4.7) can be evaluated for a particular Fourier component at any  $(x,y)$ location of the corresponding amplitude functions. From the results of figure 16, the occurrence of non-modal growth at the step has been justified based on the different growth rate evolutions associated with $|\tilde {\psi }|^{{top}}_{(0,1)}$ and $|\tilde {\tau }|^{{top}}_{(0,1)}$. We observe that the wall-normal position associated with $|\tilde {\psi }|^{{top}}_{(0,1)}$ (figure 15) and $|\tilde {\tau }|^{{top}}_{(0,1)}$, $\tilde {y}^{\psi }_{(0,1)}$ and $\tilde {y}^{\tau }_{(0,1)}$ are reasonably close to each other in the vicinity of the step in configuration III, and are almost identical in configurations I and II. Under the assumption $\tilde {y}^{\psi }_{(0,1)} \approx \tilde {y}^{\tau }_{(0,1)}$, when evaluated at this common wall-normal position, (4.7) is reduced to
 \begin{equation} \alpha^{\tau}_{i,(0,j)} \neq \alpha^{\psi}_{i,(0,j)} \Rightarrow \frac{\partial}{\partial x} \left( \zeta_{(0,j)} \right) \neq 0. \end{equation}
Thus differences in the growth rate evolution in figure 16 appear to be linked to the fundamental perturbation vector changing its orientation with respect to the base-flow vector.
Figure 18(a) portrays the chordwise evolution of  $\zeta _{(0,1)}(x,\tilde {y}^{\tau }_{(0,1)})$. In the smooth reference case, the angle remains constant at approximately $4.6^\circ$. That is, the fundamental perturbation vector maintains its orientation with respect to the base-flow vector while growing in $x$, as can be expected in the case of a single modal (crossflow) instability. Furthermore, it conforms with the results of figure 16(a), where the perturbation vector and its tangential component are shown to follow a common growth rate.
Chordwise evolution of the perturbation-to-base-flow angle  $\zeta _{(0,1)}$ at (a) the wall-normal location of $|\tilde {\tau }|^{{top}}_{(0,1)}$, and (b) $y / \delta _{0} = h / \delta _{0} + 0.2$, in the smooth case (thin solid black), step case I (dotted orange), step case II (dashed-dotted blue), and step case III (thick solid red).

When considering the step cases,  $\zeta _{(0,1)}(x,\tilde {y}^{\tau }_{(0,1)})$ changes significantly in $x$ in the vicinity of the step; see figure 18(a). Approximately in the range $x_{{st}}/\delta _{0} \in [-1.5,4]$, in line with (4.8), large differences in both the growth rate evolution in figures 16(b–d) and the rate of change of $\zeta _{(0,1)}(x,\tilde {y}^{\tau }_{(0,1)})$ in $x$ in figure 18(a) are evident. Significant chordwise variations of $\zeta _{(0,1)}$ are captured in the near-wall region downstream of the step as well; see figure 18(b), representing a constant wall-normal location. Figure 19 gives further evidence that the crossflow perturbation does not follow the base-flow advection direction at the step. Considering step case III, figure 19 portrays $x$–
$x$– $z$ planes of $u^{\prime }_{(0,1)} + u^{\prime \;{\dagger} }_{(0,1)}$ and $w^{\prime }_{(0,1)} + w^{\prime \;{\dagger} }_{(0,1)}$ with projected base-flow streamlines (solid lines) and wavefronts of the perturbation field in the plane (dash-dotted lines).
(a) Chordwise and (b) spanwise fundamental perturbation-velocity fields at  $y / \delta _{0} = 1.48$ in step case III. In-plane base-flow streamlines (solid lines) and perturbation wavefronts (dash-dotted lines) are shown.

In classic spatial LST analysis, the wavenumber vector is used typically to characterise the perturbation propagation direction (Mack Reference Mack1984; Arnal Reference Arnal1993). The wavenumber vector is normal to the wavefronts, hence the results of figure 19 show graphical evidence that the trajectory of the wavefronts and the projected base-flow streamlines gradually diverge upstream of the step. In line with the results of figure 18(a), the wavenumber vector displays a sudden change of orientation with respect to the base-flow direction immediately downstream of the step. Eppink (Reference Eppink2020) reports similarly that isocontours of chordwise-velocity perturbation bend vigorously close to the step, before realigning with the direction of the inviscid streamlines.
The possible implications of the misalignment between perturbations and base flow on the disturbance growth and decay at the step are scrutinised next by means of the Reynolds–Orr equation. This equation governs the perturbation kinetic energy evolution (Schmid & Henningson Reference Schmid and Henningson2001). Of relevance for the present analysis is the production term of the Reynolds–Orr equation,
 \begin{equation} P ={-} \int_{V} \boldsymbol{\upsilon}^{\prime} \boldsymbol{\cdot} \left( \boldsymbol{\upsilon}^{\prime} \boldsymbol{\cdot} \boldsymbol{\nabla} \right) \boldsymbol{\upsilon}_{{B}}\,{\rm d}V, \end{equation}
which expresses the kinetic energy transfer rate between the base flow and the perturbation field in a volume  $V$. Notwithstanding the stationary nature of the flow field studied here, upon characterising the spatial evolution of the integrand of (4.9), insight can be gained into the location and strength of the associated energy-transfer mechanism; see, for instance, Albensoeder et al. (Reference Albensoeder, Kuhlmann and Rath2001), Lanzerstorfer & Kuhlmann (Reference Lanzerstorfer and Kuhlmann2012) and Loiseau et al. (Reference Loiseau, Robinet, Cherubini and Leriche2014).
The present analysis is restricted to the fundamental crossflow component (i.e.  $\boldsymbol {q}^{\prime }_{(0,1)}$). We introduce the perturbation Fourier expansion (2.9) into (4.9), and using the orthogonality of complex exponentials, the leading-order term
 \begin{equation} P_{\beta_{0}} ={-} \frac{2 {\rm \pi}}{\beta_{0}} \iint \varLambda_{\beta_{0}}\,{\rm d}\kern0.06em x\, {\rm d} y, \end{equation}
 \begin{align} \varLambda_{\beta_{0}}(x,y) &= \left( \tilde{u}^{\phantom{{\dagger}}}_{(0,1)} \tilde{u}^{{{\dagger}}}_{(0,1)} + \tilde{u}^{{{\dagger}}}_{(0,1)} \tilde{u}^{\phantom{{\dagger}}}_{(0,1)} \right) \frac{\partial u_{{B}}}{\partial x} + \left( \tilde{u}^{\phantom{{\dagger}}}_{(0,1)} \tilde{v}^{{{\dagger}}}_{(0,1)} + \tilde{u}^{{{\dagger}}}_{(0,1)} \tilde{v}^{\phantom{{\dagger}}}_{(0,1)} \right) \frac{\partial u_{{B}}}{\partial y} \nonumber\\ &\quad + \left( \tilde{v}^{\phantom{{\dagger}}}_{(0,1)} \tilde{u}^{{{\dagger}}}_{(0,1)} + \tilde{v}^{{{\dagger}}}_{(0,1)} \tilde{u}^{\phantom{{\dagger}}}_{(0,1)} \right) \frac{\partial v_{{B}}}{\partial x} + \left( \tilde{v}^{\phantom{{\dagger}}}_{(0,1)} \tilde{v}^{{{\dagger}}}_{(0,1)} + \tilde{v}^{{{\dagger}}}_{(0,1)} \tilde{v}^{\phantom{{\dagger}}}_{(0,1)} \right) \frac{\partial v_{{B}}}{\partial y} \nonumber\\ &\quad + \left( \tilde{w}^{\phantom{{\dagger}}}_{(0,1)} \tilde{u}^{{{\dagger}}}_{(0,1)} + \tilde{w}^{{{\dagger}}}_{(0,1)} \tilde{u}^{\phantom{{\dagger}}}_{(0,1)} \right) \frac{\partial w_{{B}}}{\partial x} + \left( \tilde{w}^{\phantom{{\dagger}}}_{(0,1)} \tilde{v}^{{{\dagger}}}_{(0,1)} + \tilde{w}^{{{\dagger}}}_{(0,1)} \tilde{v}^{\phantom{{\dagger}}}_{(0,1)} \right) \frac{\partial w_{{B}}}{\partial y}, \end{align}
is retained. Equation (4.10) characterises the exchange of kinetic energy between the base flow and the fundamental perturbation. Additionally, the sign of  $P_{\beta _{0}}$ informs whether kinetic energy is transferred from the base flow to the perturbation field ( $P_{\beta _{0}} > 0$), i.e. the process is destabilising, or vice versa ( $P_{\beta _{0}} < 0$) (Albensoeder et al. Reference Albensoeder, Kuhlmann and Rath2001).
The production term  $P_{\beta _{0}}$ is evaluated by considering a volume $V$ defined by $0 \leq x_{{st}} / \delta _{0} \leq 10$, $h / \delta _{0} \leq y_{{st}} / \delta _{0} \leq 6$, $z_{{min}} \leq z \leq z_{{max}}$ since the current aim is to quantify perturbation mechanisms downstream of the step. Table 4 summarises the quantitative results normalised with the reference case, where $P^{\star }$ denotes integration of the signed production, and $P^{\star }_{{abs}}$ denotes integration of its local absolute value. The integral of the absolute value confirms that the presence of the step enhances the exchange of kinetic energy between the base flow and the fundamental perturbation field. The perturbation-to-base-flow misalignment (and posterior realignment) induced at the step carries inherently growth (and decay) of the normal perturbation component $\boldsymbol {\upsilon }^{\prime }_{n,(0,1)}$ relative to the tangential component $\boldsymbol {\upsilon }^{\prime }_{t,(0,1)}$ (see (2.16)). Rapid change in $x$ of the perturbation component acting normal to the base-flow streamlines appears to enhance the energy transfer between base flow and perturbations.
Regular (top) and absolute value (bottom) integral evaluation of the Reynolds–Orr production term  $P_{\beta _{0}}$ downstream of the step normalised with the smooth reference case ( $P^{\star }$).

Additionally, figure 20 illustrates the integrand of  $P_{\beta _{0}}$, $-2 {\rm \pi}/ \beta _{0}\varLambda _{\beta _{0}}$. Immediately upstream of $x_{{st}} = 0$, in all step configurations, an enhancement of kinetic energy transfer towards the perturbation field (i.e. $-2 {\rm \pi}/ \beta _{0}\varLambda _{\beta _{0}} > 0$) is captured . This is in agreement with the results of figure 13, highlighting that the incoming crossflow perturbation is amplified gradually as it approaches the step. Downstream of the step, $-2 {\rm \pi}/ \beta _{0}\varLambda _{\beta _{0}}$ maintains a dominant positive contribution in step cases I and II (figures 20b,c), which is consistent with the rather constant amplification trend depicted in figure 17. For step case III, a prominent region of negative $-2 {\rm \pi}/ \beta _{0}\varLambda _{\beta _{0}}$ arises (figure 20d) in the region where the perturbation amplitude decays (figure 17). It should be stressed that the remaining terms of the Reynolds–Orr equation ought to be considered for a full energy budget description; however, the production term itself is sufficient to characterise major stability features of the step-modified fundamental perturbation field.
Integrand of the Reynolds–Orr production term  $P_{\beta _{0}}$ in (a) the smooth case, (b) step case I, (c) step case II, and (d) step case III.

5. Perturbation evolution downstream of the step
The analysis is extended next to the region further downstream of the step, up to approximately  $x_{{st}} / \delta _{0} = 30$. Previous work identified dominant harmonic activity in this regime (Eppink Reference Eppink2020; Rius-Vidales & Kotsonis Reference Rius-Vidales and Kotsonis2021).
The evolution of the harmonic field  $\boldsymbol {\upsilon }^{\prime }_{(0,2)}$ is characterised in figure 21, where the associated total amplitude function is shown. Careful inspection of the topology of the field reveals similarities with that of the fundamental Fourier component, $\boldsymbol {\upsilon }^{\prime }_{(0,1)}$. Additional secondary stationary near-wall perturbation structures develop as well immediately downstream of the step. They manifest in the form of spanwise-distributed regions of opposite vorticity with spanwise wavenumber $2 \beta _{0}$. In the smallest step case, the pre-existing harmonic perturbation elements remain as dominant structures downstream of the step since additional near-wall ones are rather weak. This is not the case in step case III, for which the new secondary near-wall structures display rapid growth in $x$ and eventually overtake the incoming ones as a main perturbation feature. Naturally, the $u^{\prime }_{(0,2)}$ streaks expand accordingly, which explains the particular behaviour of the amplitude function for step case III depicted in figure 21(d). Similarly, Eppink (Reference Eppink2020) identifies streamwise-oriented vortices localised in the near-step regime, which are connected to the harmonic content of the perturbation field. The origin of these secondary structures is ascribed by Eppink (Reference Eppink2020) to the modulation of the step-induced upper separation bubble under the action of the incoming crossflow vortices.
Harmonic  $(0,2)$ total amplitude function contour, wall-normal position of $|\tilde {\psi }|^{{top}}_{(0,2)}$ (circles), loci of base-flow crossflow inflection points (solid cyan), and base-flow reversal $u_{{B}} = 0$ (dotted green) in (a) the smooth case, (b) step case I, (c) step case II, and (d) step case III. Also shown are wall-normal positions of $|\tilde {\psi }|^{{max}}_{(0,2)}$ downstream of the step in case III (triangles).

A visual correlation is identified between the location of the maxima of the near-wall secondary peak in the amplitude function  $|\tilde {\psi }|_{(0,2)}$ in step cases II and III, and the location of the secondary step-induced inflection points in the crossflow component close to the wall (figures 21c,d). Eppink (Reference Eppink2020) postulates that stationary crossflow amplification at the step corner is triggered by the destabilising effect of the step-induced inflection points. As shown in §§ 4.3 and 4.4, this is not the case for the pre-existing fundamental crossflow perturbation since it is stabilised locally by a sufficiently large step. Nonetheless, the results of figure 21 suggest a local destabilising effect of the near-wall step-induced inflection points when considering the harmonic field $\boldsymbol {\upsilon }^{\prime }_{(0,2)}$.
To shed light on this possibility, a linear local and parallel stability analysis, based on the Orr–Sommerfeld eigenvalue problem, is conducted on the base-flow profiles in the range  $4 \leq x_{{st}} / \delta _{0} \leq 50.2$ considering $\beta = 2 \beta _{0}$. In all step cases, an eigensolution whose associated eigenvalue becomes unstable within a particular $x$-range (figures 22b–d) is identified, which remains stable in the equivalent eigenspectrum of the smooth reference case (figure 22a). Hereafter, this eigenvalue is referred to as critical and is denoted by $\alpha ^{{OS}} = \alpha ^{{OS}}_{r} + {\rm i}\,\alpha ^{{OS}}_{i}$. Therefore, the step-distorted base-flow profiles appear to support the exponential amplification of small-amplitude perturbations with half the spanwise wavelength of the fundamental crossflow mode.
Trajectory of the critical unstable eigenvalue of the Orr–Sommerfeld eigenspectrum for increasing  $x$ in equispaced partitions in the range $x_{{st}} / \delta _{0} \in [4, 50.2]$ with $\beta = 2 \beta _{0}$: (a) smooth case, (b) step case I, (c) step case II, and (d) step case III. Dark-to-bright colour corresponds to increasing $x$.
$x$.

Furthermore, the amplification factor in  $x$ of the critical unstable Orr–Sommerfeld eigenmode is proportional to the step height. In line with observations of Eppink (Reference Eppink2020), for the particular case of the field $\boldsymbol {\upsilon }^{\prime }_{(0,2)}$, an increase in the step height appears to increase the destabilising influence of the step-distorted inflectional base-flow profiles. Additionally, in results not shown here, linear local unstable eigensolutions are also identified when the analysis is repeated for higher-order harmonics. Although not fully conclusive, this model suggests that near-wall perturbations with $\beta > \beta _{0}$ triggered at the step corner are amplified further downstream through an Orr–Sommerfeld type of mechanism, possibly associated with the step-induced near-wall inflection points.
The behaviour of the harmonic Fourier modes for the DNS at the highest step is characterised quantitatively in figure 23, portraying the evolution in  $x$ of the amplitude associated with $|\tilde {u}|^{{max}}_{(0,j)}$, $j = 0$– $6$. As suggested by the results of the Orr–Sommerfeld analysis, growth of the high-order harmonics is captured downstream of the step. Additionally, figure 23 depicts the amplitude curves obtained by solving the LPSE and NPSE on the DNS base flow downstream of (but not at) the step.
Chordwise evolution of the amplitude associated with  $|\tilde {u}|^{{max}}_{(0,j)}$, $j = 1$– $5$ (thick-to-thin), $j=0$ (dotted), from DNS (solid lines), LPSE (blue symbols), NPSE (white symbols): (a) in the near-step regime, (b) downstream of the step, for step case III. The vertical red line indicates the step location.

The numerical set-up of the present NPSE simulations is identical to that employed in previous sections (§§ 2.5 and 4.2), albeit with a major difference: the initial condition of the marching scheme is provided by the local DNS solution at a selected  $x$-position downstream of the step. Furthermore, for NPSE, this DNS (Fourier-analysed) initial condition is assigned simultaneously to all modes considered in the simulation at the common initial marching position.
It is found that an NPSE solution is able to march from  $x_{{st}} / \delta _{0} = 8.57$ and match reasonably the results from DNS (see figure 23). Excellent agreement is obtained sufficiently far from the step. Therefore, NPSE initialised from DNS data are able to resolve the perturbation evolution downstream of the step, even when an initial condition extracted reasonably close to the step is considered. Shifting the starting position of the NPSE simulation upstream of $x_{{st}} / \delta _{0} = 8.57$ results rapidly in a significant loss of accuracy. Similarly, the solution of the LPSE marched from $x_{{st}} / \delta _{0} = 8.57$ matches reasonably the local trend displayed by the fundamental crossflow component in the DNS and NPSE until approximately $x_{{st}} / \delta _{0} = 100$. Thereby, the present results show evidence that after passing the largest step, the fundamental crossflow perturbation evolves following linear perturbation mechanisms.
This finding is contrary to the observed behaviour in the no-step case, where LPSE and NPSE start to display differences much closer to the virtual location of the step (§ 2.5). The fundamental perturbation experiences a significant stabilisation at the largest step, as detailed previously in § 4.3 and illustrated in figure 17. In § 4.4, this behaviour has been connected to the effective transfer of kinetic energy between the base flow and the fundamental perturbation, which is characterised quantitatively by the linear production term in the Reynolds–Orr equation (table 4 and figure 20d). It is hypothesised that the enhancement of this linear perturbation effect under the influence of the step overshadows the impact of the nonlinear interactions on the evolution of the fundamental perturbation. This would be substantiated further by the rapid emergence of differences between LPSE and NPSE initialised downstream of step cases I and II using the same methodology as employed for step case III; in step cases I and II, the behaviour of the linear production term is closer to that exhibited by the no-step case (figure 20).
It should be noted that linear behaviour of the fundamental perturbation downstream of the largest step arises in a regime with significant amplification of the harmonic components (figure 23). As shown in figure 22, harmonic growth near the step can be linked potentially to the unstable nature of the base-flow profiles to spanwise wavelengths smaller than the fundamental one. In contrast, Eppink (Reference Eppink2020) attributes stationary crossflow growth downstream of large steps – beginning approximately at the end of the separated-flow region – to a nonlinear effect; the author justifies this based on the presence of secondary structures with harmonic wavelengths in this region (Eppink Reference Eppink2020). It can be anticipated that in order to assess whether the crossflow perturbation follows linear or nonlinear growth mechanisms downstream of the step, a multi-parametric space ought to be defined. The height of the step and the amplitude of the pre-existing perturbation at the location of the step may stand out as dominant parameters in this regard.
6. Conclusions
Direct numerical simulations (DNS) of a purely stationary interaction between a critical crossflow instability and a range of forward facing steps have revealed salient features of laminar–turbulent transition due to geometrical imperfections. The topology of the laminar base flow includes recirculating flow immediately upstream and downstream of all steps studied. In line with previous investigations, reversal of the crossflow component and near-wall secondary inflection points in the crossflow profile are identified near the steps. A main feature of the step-distorted base flow is the sudden deflection of the streamlines at the step not only in the wall-normal direction, but also in the spanwise direction. This is ascribed mainly to the effect of the local pressure gradient, which is adverse upstream and downstream of the step, but favourable locally at the step corner.
The analysis of the step-modified perturbation mechanisms is first centred around effects on the fundamental perturbation component, i.e. the primary spanwise Fourier mode of the stationary perturbation field. Contrary to the model conjectured previously by Tufts et al. (Reference Tufts, Reed, Crawford, Duncan and Saric2017), the main body of the fundamental crossflow instability is found to pass gradually over the step sufficiently far from the wall, with no apparent explicit interaction with the regions of flow recirculation. As it approaches the step in the chordwise direction  $x$, the fundamental crossflow perturbation is amplified gradually, with respect to the smooth reference case. A close match of the DNS and the linear parabolised stability equations (LPSE) amplitudes in this region reveals linear perturbation growth driven purely by the modification of the base flow by the step. Furthermore, the amplification factor immediately upstream of the step is proportional to the step height.
In the immediate vicinity of the step and close to the wall, additional perturbation-velocity streaks develop in a short region upstream and downstream of the step. These new perturbation structures are conjectured to be independent from (but possibly triggered and conditioned by) the incoming crossflow perturbation, and manifest in the fundamental amplitude function as a secondary peak close to the wall. These secondary streaky structures are reminiscent of classic step-flow features reported widely in the literature. The apparent independence of these structures from the incoming crossflow instability highlights further the need for a proper definition of instability amplitude when rapid geometry changes are present. In this work, the quantitative analysis of the impact of the step on the incoming crossflow instability is based on the amplitude measured by tracking the (upper) local peak of the corresponding amplitude function instead of tracking the global maximum value at each chordwise station.
Downstream of the smallest steps studied, the fundamental crossflow perturbation maintains a rather constant amplification. However, it is stabilised significantly downstream of the largest step, before amplifying again further downstream. This observed local stabilising effect induced by the largest step is in opposition to recent experimental and numerical reports indicating sudden and vigorous amplification of the crossflow instability due to a large step (Tufts et al. Reference Tufts, Reed, Crawford, Duncan and Saric2017; Eppink Reference Eppink2020). This apparent discrepancy is a direct artefact of the inclusion of the locally formed and rapidly amplified near-wall structures in the instability amplitude estimation, thus overshadowing the incoming instability response.
By use of the Reynolds–Orr equation, it is shown that the step enhances locally the exchange of kinetic energy between the base flow and the fundamental perturbation field. The disturbance kinetic energy production term yields plausible explanations for both the stabilising and destabilising effects captured in the DNS for different step heights. Furthermore, the step-induced enhancement of kinetic energy transfer takes place in a region where the change of orientation of the fundamental perturbation vector relative to the direction of the base-flow vector is evident. This misalignment of perturbation and base flow is not observed in the smooth reference case. It can be shown analytically that for the current flow conditions, the different growth rate evolution in  $x$, measured in the DNS between the (fundamental) total perturbation component and the perturbation component tangential to the base-flow direction, is a sufficient condition for the relative change in orientation between the associated vectors. Other studies on three-dimensional stationary perturbations link a change of orientation of the perturbation vector relative to the base-flow direction to non-modal growth mechanisms (Marxen et al. Reference Marxen, Lang, Rist, Levin and Henningson2009), which in the present case may blend with the original modal (crossflow) instability mechanism at the step.
Previous work ascribes stationary crossflow growth to the destabilising influence of the step-induced near-wall inflection points in the crossflow component (Eppink Reference Eppink2020). Disregarding possible effects on the new near-wall structures formed at the step, no apparent evidence supporting a significant destabilising effect of these step-induced inflection points on the fundamental crossflow instability is found in this work. However, strong evidence is reported for the higher harmonic field, i.e. the secondary spanwise Fourier mode, containing perturbations with half the fundamental spanwise wavelength. Conformably, and in agreement with recent experimental investigations (Eppink Reference Eppink2020; Rius-Vidales & Kotsonis Reference Rius-Vidales and Kotsonis2021), significant growth of the higher-order harmonic crossflow components is measured downstream of the step in the DNS. An ongoing debate in the literature examines whether this harmonic amplification arises via nonlinear forcing of the fundamental crossflow component or, vice versa, the enhanced harmonic activity induces nonlinear growth of the fundamental crossflow component. In the present work, it becomes evident that the amplitude evolution of the primary Fourier mode from DNS matches reasonably the solution of the LPSE initialised close downstream of (but not at) the largest step. Thus further downstream of the largest step, the fundamental crossflow perturbation evolves following linear perturbation mechanisms, in spite of the significant growth of the harmonic components in this regime. On the other hand, the instability growth downstream of the smallest steps is dominated nonlinearly in this region, indicating that the nature of the perturbation mechanisms is a function of, at least, the step height.
Supplementary material
Supplementary material is available at https://doi.org/10.1017/jfm.2022.456.
Acknowledgements
The authors would like to express their gratitude to Dr Pestana for assisting in the numerical simulations, as well as Dr Groot, Dr Michelis, A.F. Rius-Vidales and H. Shahzad for fruitful discussions.
Funding
This work was carried out on the Dutch national e-infrastructure with the support of SURF Cooperative. The authors would like to acknowledge the support of the European Research Council through StG no. 803082 GLOWING.
Declaration of interests
The authors report no conflict of interest.
Appendix A. Definition of the normal perturbation component
The second vector of decomposition (2.16),  $\boldsymbol {\upsilon }_{n,(0,j)}^{\prime }$, represents a perturbation acting normal to the base-flow-aligned perturbation component $\boldsymbol {\upsilon }_{t,(0,j)}^{\prime }$. Whereas the direction tangential to the base flow is uniquely defined (2.18), the direction associated with $\boldsymbol {\upsilon }_{n,(0,j)}^{\prime }$ is, at present, taken inherently as that defined by the difference between $\boldsymbol {\upsilon }_{(0,j)}^{\prime }$ and $\boldsymbol {\upsilon }_{t,(0,j)}^{\prime }$ (2.16). Hence
 \begin{align} \boldsymbol{\upsilon}_{n,(0,j)}^{\prime} &= \begin{bmatrix} |\tilde{u}|_{(0,j)} \exp\left({{\rm i} \left( j \beta_{0} z + \varphi^{u}_{(0,j)} \right)}\right) \\ |\tilde{v}|_{(0,j)} \exp\left({{\rm i} \left( j \beta_{0} z + \varphi^{v}_{(0,j)} \right)}\right) \\ |\tilde{w}|_{(0,j)} \exp\left({{\rm i} \left( j \beta_{0} z + \varphi^{w}_{(0,j)} \right)}\right) \end{bmatrix} \nonumber\\ &\quad - \frac{1}{\|\boldsymbol{\upsilon}_{{B}}\|^2} \sqrt{(\gamma^{+}_{(0,j)})^2 + (\gamma^{-}_{(0,j)})^2} \exp\left({{\rm i}\left( j \beta_{0} z + \varphi^{\tau}_{(0,j)} \right)}\right) \begin{bmatrix} u_{{B}} \\ v_{{B}} \\ w_{{B}} \end{bmatrix}. \end{align}
 The amplitude function  $\|\boldsymbol {\upsilon }_{n,(0,j)}^{\prime }\|$ associated with the perturbation component $\boldsymbol {\upsilon }_{n,(0,j)}^{\prime }$ can be obtained directly by relating the amplitude functions (or moduli) of $\boldsymbol {\upsilon }^{\prime }_{(0,j)}$ and $\boldsymbol {\upsilon }_{t,(0,j)}^{\prime }$:
 \begin{equation} \|\boldsymbol{\upsilon}^{\prime}_{(0,j)}\|^2 = \|\boldsymbol{\upsilon}_{t,(0,j)}^{\prime}\|^2 + \|\boldsymbol{\upsilon}_{n,(0,j)}^{\prime}\|^2,\end{equation}
since  $\boldsymbol {\upsilon }_{t,(0,j)}^{\prime }$ and $\boldsymbol {\upsilon }_{n,(0,j)}^{\prime }$ are complex orthogonal,
 \begin{equation} \boldsymbol{\upsilon}_{t,(0,j)}^{\prime} \boldsymbol{\cdot} \boldsymbol{\upsilon}_{n,(0,j)}^{\prime} = \boldsymbol{\upsilon}_{t,(0,j)}^{\prime} \boldsymbol{\cdot} \boldsymbol{\upsilon}_{(0,j)}^{\prime} - \|\boldsymbol{\upsilon}_{t,(0,j)}^{\prime}\|^2 = 0, \end{equation}
which follows from the fact that  $\boldsymbol {\upsilon }_{t,(0,j)}^{\prime } = (\boldsymbol {\upsilon }_{(0,j)}^{\prime } \boldsymbol {\cdot } \; \boldsymbol {\upsilon }_{{B}} / \|\boldsymbol {\upsilon }_{{B}}\|^2) \boldsymbol {\upsilon }_{{B}}$ (§ 2.6). Here, the dot denotes the standard Hermitian inner product:
 \begin{equation} \boldsymbol{\upsilon}_{t,(0,j)}^{\prime} \boldsymbol{\cdot} \boldsymbol{\upsilon}_{n,(0,j)}^{\prime} = \sum^{3}_{k = 1} \boldsymbol{\upsilon}_{n,(0,j)}^{\prime\;{\dagger}} (k)\,\boldsymbol{\upsilon}_{t,(0,j)}^{\prime} (k), \end{equation}
with  $k$ denoting the components of the corresponding vector field.


 Open access