


Mercury (Hg) is a Priority One trace metal that is of concern to the UK and other signatories of the Oslo–Paris Convention, which aims to limit discharges, emissions and losses of hazardous substances to the marine environment, including the southern North Sea, by 2020. Interest in sedimentary-hosted Hg stems from its long-term environmental persistence, its toxic effect on marine invertebrates and the tendency for the methyl-Hg form, which generally comprises approximately 1–10 % of total Hg, to bio-accumulate up trophic levels (Bryan & Langston Reference Bryan and Langston1992; Boening Reference Boening2000). Under certain physico-chemical (e.g., pH, redox, chloride and sulphide) and hydrological (e.g., water velocity, salinity gradient) conditions, estuarine sediments can accumulate and record local, regional and global heavy metal anthropogenic signatures, including Hg inputs (Vane et al. Reference Vane, Harrison, Kim, Moss-Hayes, Vickers and Hong2009a, Reference Vane, Jones and Listerb, Reference Vane, Chenery, Harrison, Kim, Moss-Hayes and Jones2011; Kemp et al. Reference Kemp, Sommerfield, Vane, Horton, Chenery, Anisfeld and Nikitina2012). The primary characteristics that facilitate the accumulation of Hg onto sediment mineral surfaces include binding to organic carbon coatings by electrostatic forces and complexation and sorption to small particle sizes (clay and fine silt), as well to the cell walls of certain bacteria (Bengsston & Piccado Reference Bengtsson and Picado2008).
Comparison of published global Hg atmospheric emission inventories suggests that anthropogenic sources exceed those from natural sources such as volcanoes, wild fires and dusts (OSPAR 2004 and references therein). For example, input of aerial Hg from volcanoes is estimated at 1000 t/yr, whereas anthropogenic sources such as coal combustion and refuse incineration account for approximately 2100t /yr and 1200 t/yr respectively. In the UK, the main historical and current Hg polluting industries include: (i) power production (e.g., generation by coal combustion, coke production, generation from natural gas and oil, petroleum refining); (ii) metal processing (e.g., smelting, steel/Cu/Ni production); (iii) landfill waste, including waste incineration and waste/sewage treatment; and (iv) other (e.g., cement and lime manufacture, the chlor-alkali industry and biocides used in paper and pulp production). Of these, chloro-alkali plants (Castner-Kellner Cells) are known to be a major historical point of contamination source in estuaries (e.g., the Mersey estuary, UK; Thane Creek, Mumbai Harbour, India) (Vane et al. Reference Vane, Harrison and Kim2007; Rama et al. Reference Rama, Rokade, Zingde and Boroleb2009).
The Thames estuary is located in the southeast UK. It has catchment of 14,000 km2 and is approximately 110 km long, with a width that varies from 55 m at Brentford to 270 m at Tower Bridge, and reaching a maximum of 8 km at Shoeburyness to Sheerness. The tidal portion of the river serves as a key transport route for Greater London, historically one of the most populous cities in the world, with a current population of about 12 million people. The upstream tidal influence of the Thames is halted artificially at Teddington Locks, which were completed in 1811 in order to ensure downstream navigation at low tide. Consequently, the 19thC-to-modern tidal Thames extends from Teddington to Shoeburyness–Sheerness (Fig. 1A). The Thames is a macrotidal estuary, with a spring tidal range of 5.2 m at Sheerness and 6.6 m at London Bridge; the difference between high water and low water at London Bridge varies from 4.4 m (mean neap) to 6.6 m (mean spring) (ATT 2013). Salinity ranges from <1 at the Teddington tidal limit to 30 at Shoeburyness. Recent investigations into turbidity have shown that the amount of suspended sediment varies both spatially and with water depth, such that suspended sediment loads can vary from 0.5 g/L at the surface to 6 g /L at 0.6 m depth (Uncles & Mitchell Reference Uncles and Mitchell2011).
Industrial, domestic and municipal wastes have been discharged from central London into the Thames for over 1,900 years. Originally settled by the Romans between two tributaries (the Fleet and the Wallbrook), the city of London remained fairly limited in spatial extent until 1600 AD. Thereafter, a gradual urban expansion began, which increased with the onset of the Industrial Revolution (around 1770). The rapid rise in London's population from 1 million in 1801 to about 6.5 million in 1901, together with multiple cholera epidemics, culminated in the construction of an integrated series of intercepting sewers that are still in use today. Under normal meteorological conditions, sewage effluent is sent for treatment via the northern outfall at Beckton or the southern outfall at Crossness. However, at times of high rainfall, untreated sewage from 56 combined sewer overflows can mix with road run-off and discharge into the Thames. Other notable sources of pollution in the Thames include: 16 coal, oil and gas power stations, including Battersea, Bankside, Belvedere, Deptford, Northfleet and Tilbury; fugitive landfill releases (Rainham); metal processing; gas works; pulp and paper (Purfleet); petroleum refining (Coryton); as well as numerous docks and wharves (e.g. Tilbury, Rotherhithe, Woolwich).
Improvements in Thames water and London air quality have been widely reported over the last two decades, using a variety of atmospheric, geochemical, biological and ecological indicators (Sedgwick & Arthur Reference Sedgwick and Arthur1976; Andrews & Rickard Reference Andrews and Rickard1980; Power et al. Reference Power, Attrill and Thomas1999; Scrimshaw et al. Reference Scrimshaw, Wahlen, Catterick and Lester2005). Monitoring of bulk atmospheric Hg deposition in London air from 1999 to 2005 showed a decrease from 76.0 ng/L to 43.8 ng/L, in contrast to a control site at Lochnagar in Scotland, which maintained a stable atmospheric deposition trend, indicating that London Hg deposition was of local and or regional origins (Yang et al. Reference Yang, Berry, Rose and Berg2009). Similarly, Thames water chemistry between 1980 and 1997 has shown an exponential decrease in dissolved Hg, Cd, Cu, Ni, Pb and Zn concentrations at Erith, a site 26 km downstream of London Bridge, suggesting a decline in metal loadings and, by extension, an improvement in water quality over the 17-year period (Power et al. Reference Power, Attrill and Thomas1999). Whereas Thames water and air quality have been scrutinised, there are few published surveys of metals and organic contaminants in sediments and particularly those in the sub-surface. This lack of baseline geochemistry is surprising, particularly since major changes to Thames estuary infrastructure are already underway (Vane Reference Vane2014). These include construction of the Thames tideway tunnel (interception of combined sewer overflows) and the 2013 opening of deep-sea global shipping port (DP world London Gateway), as well as Environment Agency-led improvements to flood defences.
The purpose of the research presented here was to: (1) map the lateral and vertical distribution of sedimentary hosted Hg through the entire 100 km of the tidal Thames system; (2) examine whether sediment particle characteristics such as grain size and total organic carbon (TOC %) are correlated with Hg content; (3) rank the Thames estuary Hg loading against other similarly urbanised and industrialised estuaries; and (4) assess the Hg concentration data within published (non-statutory) sediment quality guidelines to aid decision making and future river management.
1. Method
1.1. Sampling and sample preparation
Sediment cores were collected in November 2009 and October 2010 (Fig. 1; Table 1). Fifty six inter-tidal sampling sites were accessed by Port of London Authority Dory attached to the vessel Driftwood II, using pre-determined GPS co-ordinates to accurately locate each position (sites 1–56). At each site, clear polycarbonate tubes (140 cm length×6 cm I.D) fitted with a stainless steel basket catcher at the base were manually driven into the exposed sediment and extracted to recover the core material (Vane et al. Reference Vane, Harrison and Kim2007, Reference Vane, Rawlins, Kim, Moss-Hayes, Kendrick and Leng2013). Upon collection, sediment cores were stored frozen at −18° C in the dark to avoid post-collection chemical changes and physical movement; then transported frozen to the laboratory within three days. Each core was defrosted, cut longitudinally in half and sliced into 10-cm intervals. The resultant 351 sediment samples were freeze-dried, sieved to pass a 2-mm brass mesh, ground to a fine powder using an agate ball-mill, and stored in sealed plastic vials in a desiccator. Prior to analysis, all samples were thoroughly mixed to avoid inhomogeneity caused by density settling during storage (Beriro et al. Reference Beriro, Vane, Cave and Nathanail2014). It should be noted that sediment cores were not collected to the tidal limit at Teddington due to lack of soft sediment. The upper Thames is defined by sites from Brentford to Battersea (sites 1–9); the London reaches incorporate sites from Albert Bridge to Horseshoe Corner (sites 10–32); and the Lower Thames encompasses Crossness to the Isle of Grain (sites 33–56).
Location of intertidal sediment core sites in the inner, middle and outer Thames Estuary, UK, with their respective down-core total mercury (Hg) concentration profiles: (Part 1) sites 1–15; (Part 2) sites 16–42; (Part 3) sites 43–56. All values are given in mg/kg dry weight sediment.

(continued)

(continued)

Quality control measured in marine sediment-certified reference material

1.2. Mercury analysis
Total mercury analysis was performed using an Advanced Mercury Analyser (AMA-254) instrument (ALTEC, Czech Republic, distributed by LECO), which is a direct atomic absorption spectrophotometer (AAS) method that uses cold vapour method with gold amalgamation. For each sample, approximately 100 mg of Thames sediment was weighed, dried for one minute at 120°C to remove the water and pyrolysed at 850°C for 2.5 minutes. The products were subsequently trapped at 120°C for 45 seconds and the Hg released upon heating at 950°C for Hg measurement following an automatic zero adjustment. The ASA was operated with an O2 flow rate of 200ml/min and absorption was measured at 253.65 nm. Quality control was accomplished by analysing PACS-1, a high level marine sediment Hg reference material. A total of ten QC analyses were conducted at regular intervals throughout the analysis of the samples. These were in good agreement with the certified Hg value of 4.57 mg/kg, suggesting that the method employed was accurate (Table 1). The error for PACS-1 (standard deviation) was ±0.22 mg/kg, equivalent to a relative standard deviation of 4.8 % and a limit of quantification of 0.002 mg/kg.
1.3. Particle size analysis
Prior to particle size analysis, organic matter was removed from the samples with H2O2 in the following way. Approximately 1 g of the freeze-dried sample was placed in a 50 ml beaker and 10 ml of H2O2 was added. The samples were then placed in a sand bath on a hotplate and the temperature was raised to 90°C. Initially, any vigorous reactions were reduced by the addition of a small volume of distilled water. Samples were made up to approximately 20 ml H2O2 and left on the hotplate, with the regular addition of H2O2 to compensate for any H2O2 loss, until any reaction had ceased. They were then allowed to settle and any excess H2O2 was carefully poured off and replaced with distilled water up to 20 ml. A few drops of 10 % calgon were then added to each sample to aid dispersion of particles.
Particle size was measured using a Beckman Coulter LS™ 13 320 MW. In order to analyse a representative sample, the beaker sample was stirred for two minutes on a magnetic stirrer, with the speed set to achieve a vortex depth in the liquid of approximately 50 % of the liquid level at the beaker wall. The sample was then transferred in 0.5-ml doses, by pipette, into the aqueous module of the instrument from a region adjacent to the beaker wall, approximately 2 cm above the bottom of the beaker, using a modified pipette tip with an enlarged opening (to accommodate any large particles present). Only enough of the sample to achieve an obscuration value of approximately 3 % was added, as this is in the optimum range required for an accurate analysis. Analyses were carried out for 60 seconds duration, at maximum pump speed (in order to ensure that any heavy particles present were effectively circulated). The proportions of particles at each size class (117 groups, from 0.1 µm to 2000 µm) were calculated using the Fraunhofer model, based on refractive indices of 1.33 for H2O and 1.55 for quartz. The 117 groups were then summed according to the following categorisation scheme: clay (<4 µm); silt (4–64 µm); and sand (64–2000 µm).
2. Results and discussion
2.1. Longitudinal–spatial variation in surface sediment Hg
Total mercury concentrations of surface sediments ranged from 0.01 mg/kg (Mucking Flats – site 51) to 7.65 mg/kg (Millennium Dome – site 21) with a mean of 1.27 mg/kg (n=56) (Figs 1, 2). The greatest surface Hg concentrations occurred within the London reaches of the river at Albert Bridge (10), Vauxhall Bridge (11), Millennium Bridge at Bankside (14), Cuckolds Point at Rotherhithe (16), Millwall (17), Blackwall Tunnel (19), Millennium Dome (21, 23), Woolwich Ferry terminal (26) and Barking Reach (30); the latter a site opposite Beckton Sewage works outfall (Figs 1, 2). Inspection of the surface Hg values downstream (Fig. 2A) showed moderate values of <1 mg/kg in the upper Thames (sites 1–9) and a peak in the London reaches (sites 10–30) followed by a return to lower values in the outer Thames (sites 32–56). Furthermore, the Rotherhithe, Isle of Dogs, Greenwich Peninsular (East End) portion of the London Reach had the highest concentrations, suggesting possible inputs from gas works, dockyards/shipping and sewage discharges, as well as metal processing. However, it should be borne in mind that not every surface sample from the London reaches had elevated values. For example, Greenwich Pier (20), Bow Creek (22) and Bugsby's Reach (24) all yielded relatively low surface Hg concentrations of ∼1 mg/kg, despite being located just 0.3 km from the sites with the highest Hg contamination. This local spatial variability in Hg content clearly demonstrates the need for high-resolution spatial sampling in highly industrialised estuaries with manifold inputs, such as that conducted here.
(A) Spatial distribution of Hg in surface sediments of the Thames estuary. (B) Spatial distribution of maximal Hg from shallow sediment cores of the Thames estuary. See Table 3 for explanation of Action Level 2. Values above columns correspond to the specific depth interval from surface (in cm).

Previous studies of metals in the fine fraction (<63 µm) of Thames sediments reported a mean Hg content of 0.6 mg/kg and an upper Thames mean of 1.3 mg/kg, and showed a general downstream decrease in metal concentrations, including total Hg (Attrill & Thomes Reference Attrill and Thomes1995). Pope & Langston (Reference Pope and Langston2011) recorded trace metals concentrations in Thames estuarine water, suspended as solids as well as in selected surface sediments (results from 1997, 1999 and 2001). The time-series showed decreasing amounts of Cd, Cu, Hg, Pb and Zn downstream, due in part to elevated mixing of marine sediments, increased salinity and greater distance from upstream pollution-point sources. Surface sediments (<100 µm) collected from 28 sites, spanning the entire tidal Thames, gave sediment Hg values that ranged from 0.03 to 6.47 mg/kg, with a mean of 0.70 mg/kg; only two sites (Kew and Westcliffe) reported Hg concentrations of >2 mg/kg. The surface Hg concentrations reported in this current study are of the same order of magnitude, but are generally higher (arithmetic mean of 1.27 mg/kg as compared to 0.7 mg/kg), and also differ in that the Hg peaks in the central London reaches shown in Figure 2 were not reported. Interestingly, the highest total concentrations of Ag, Cd, Cu, Pb and Zn were not observed in the central London reaches but at Kew Bridge, a site which is primarily urban but not heavily industrialised. Pope & Langston (Reference Pope and Langston2011) did not suggest a specific source of the Hg at Kew because this was not within their remit, but one obvious candidate is Mogden Sewage Treatment Works outfall, which is located ∼1.5 km upstream of their sample site. Mercury levels in sediments from the far outer estuary have been previously examined and compared with archived samples (0.012–0.550 mg/kg; 1925–1964) and freshly collected surface sediments (0.012–0.490 mg/kg; 1971), together with geogenic background (Eocene ∼50 Ma) London Clay (0.010 mg/kg) (Smith et al. Reference Smith, Nicholson and Moore1973). These values broadly agree with those obtained here from the outer estuary (sites 46–56; Fig. 2A) and indicate that the Hg concentrations probably continue to decline toward the southern North Sea, due to increased sediment dilution with offshore sandier sediment low in Hg.
2.2. Down-profile variation
The Hg concentration profiles from 56 Thames sediment cores are presented in Figure 1B. Taken together, the core Hg content ranged from 0.01 to 12.07 mg/kg, with a mean of 2.10 mg/kg and a median of 0.85 mg/kg (n=351). Low, rather invariant Hg values ranging from 0.01 to 0.40 mg/kg were observed in sediment cores from the most westerly locations (Upper Thames) at Brentford, Chiswick Bridge and Barnes Bridge (sites 1–3); reflecting either the overall lower volumes of current and past industry or mainly urban and/or physical sediment mixing and dilution (Fig. 1B). The slightly higher Hg values at Brentford may be due to input from the Grand Union Canal, which joins the Thames just 0.1 km upstream. A similar increase in total Hg has been previously reported in the Mersey estuary, where the Manchester Ship Canal enters at Eastham Locks (Vane et al. Reference Vane, Jones and Lister2009b). The Hg profile for Wandsworth (site 5) situated between Putney and Fulham Rail Bridges, varied from 0.04 mg/kg at base (74 cm) to a maximum of 6.05 mg/kg (45 cm), and then declined to 1.06 mg/kg at surface (Fig. 1B). The most plausible explanation for the pronounced rise, peak and fall in Hg could be changing historical anthropogenic inputs. Down-profile Hg concentrations close to the confluence with River Wandle (6), Chelsea Creek (7) and Battersea Reach (8) were low throughout. In contrast, Battersea Bridge (9), Albert Bridge (10), Vauxhall Bridge (11), Lambeth Bridge (12), Waterloo Bridge (13) and Butlers Wharf (15) (the latter a site located in close proximity to Tower Bridge) all, to a lesser or greater extent, increased in Hg with increasing depth from surface (Fig. 1B). At depths greater than 10 cm, Hg content at Vauxhall Bridge and Albert Bridge ranged from 3.36 to 5.18 mg/kg and 4.76 to 5.85 mg/kg, respectively. The unusual mid-core low to high Hg profile switch at Waterloo Bridge (13) corresponds with an abrupt change in grain size from fine and medium sand size particles (at 0–45 cm) to mainly fine silts and clay size particles at 55–85 cm (Fig. 1B). This pattern suggests that the sand-dominated particle size of the upper half of site 13 is atypical of this part of the estuary. On average, sediments from the upper Thames domain (sites 1–9) are comprised of 53 % clay, 31 % silt and 16 % sand size particles; whereas the London reaches (sites 10–32) are comprised of 24 % clay, 55 % silt and 21 % sand; and the outer Thames domain (sites 32–56) are comprised of 14 % clay, 56 % silt and 30 % sand. From these particle size data, it is clear that the sediments become coarser down-estuary (Fig. 3).
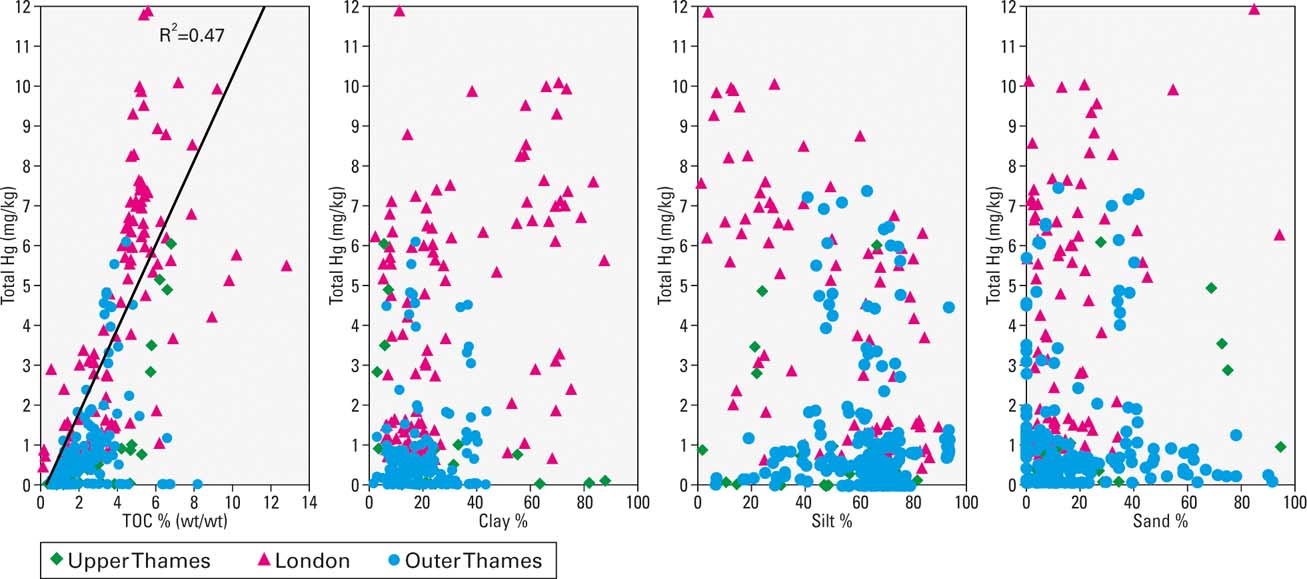
Bi-plot of total Hg concentration versus total organic carbon (TOC), clay, silt and sand particle size.
A return to a rise, peak and fall in Hg concentration with depth was observed at Millennium Bridge, the broad Hg peak having concentrations of 6.12–7.13 mg/kg, before declining at the base of the core to 3.12 mg/kg. The past and present industrial activity in these central London reaches confounds any realistic attempt at apportioning Hg pollution to a single site activity. However, considering that coal and coal combustion, and latterly oil combustion, generates Hg, four obvious possibilities are the power stations and associated coaling jetties at Battersea (operational 1930–1983), Bankside Power Station (1891–1947; 1952–1981) and, to a lesser extent, Chelsea Creek (Lotts Rd) (1905–2002) and Fulham (1901–1978). Sediment cores from Rotherhithe, Greenwich and Woolwich (sites 16–26) contained the highest concentrations of Hg in the entire Thames estuary (a mean of 4.9 mg/kg; a range 0.8–12.7 mg/kg) (Fig. 1B). The three cores at Cuckolds Point (16), Millwall (17) and Deptford Creek (18) showed a progressive increase in values down-profile (with the exception of the deepest increment), with maximal concentrations of 12.70, 11.90, 8.80 mg/kg below 50 cm, respectively (Figs 1B, 2B). A somewhat different situation was observed at Blackwall Tunnel (20) and Millennium Dome (21, 23), where the highest Hg concentrations of 6.35, 8.80 and 10.00 mg/kg are at shallower depths of 10–20 cm (Figs 1B, 2B). On balance, the elevated concentrations are consistent with diverse inputs from docks, wharves, gas works and metal smelting in the area, and the lower values at base could possibly reflect lower levels of anthropogenic input. The significant surface spatial variability in Thames Hg concentrations (see section 2.1) was paralleled by the relatively low (<2 mg/kg) invariant concentration profiles at Bow Creek (22), Bugsby's Reach (24), Gallions Reach (27, 28) and Beckton Creek (29). These differences are best explained by differing sediment accumulation and mixing rates, as well as by the highly localised nature of point sources. Woolwich Ferry (26) was the only core which had higher concentrations at the top of the core (∼5 mg/kg; 0–35 cm) than in the lower half of the core (∼1 mg/kg; 45–70 cm). This unusual profile could be due to overturning of the sediments, or could also occur due to the complete removal of relatively uncontaminated modern sediment by shipping, dredging or other unknown activities, thereby exposing contaminated historical sediments. Down-profile rise, peak and fall in Hg concentrations was also observed at Barking Reach (30), and a partial record of the peak and fall in Hg concentrations was observed at Horse Shoe Corner (32) and Crossness (33) (Fig. 1B).
Inspection of the core Hg profiles from Dagenham (34) to Aveley Marsh (42) showed lower concentrations than those from the central London reaches. This could be due to the switch in industrial land use in close proximity to this portion of the river, and to the greater mixing with sediment entering the estuary from various tributaries and the southern North Sea. However, foreshore sediments from Rainham Marsh (36) and Erith Marsh (37) showed a peak and near surface fall in Hg, with maximal values of 6.10 and 4.83 mg/kg at 45 cm (Fig. 1B). The Rainham (36) site is located close to a number of potential pollution sources, including one of the UK's largest landfill sites and a variety of other activities in the Purfleet/Thurrock area, including sewage treatment works (Longreach), container port and oil storage and power generation (Little Brook), as well as past paper manufacture (Thames Board Mills). In contrast, cores from the outer portion of the Thames (43) to Isle of Grain (56) were characterised by far lower Hg concentrations of ∼1 mg/kg (Fig. 2B), with the exception of Cliffe (52), which showed a clear rise, peak (4.52 mg/kg) and fall.
2.3. Controls on Hg content
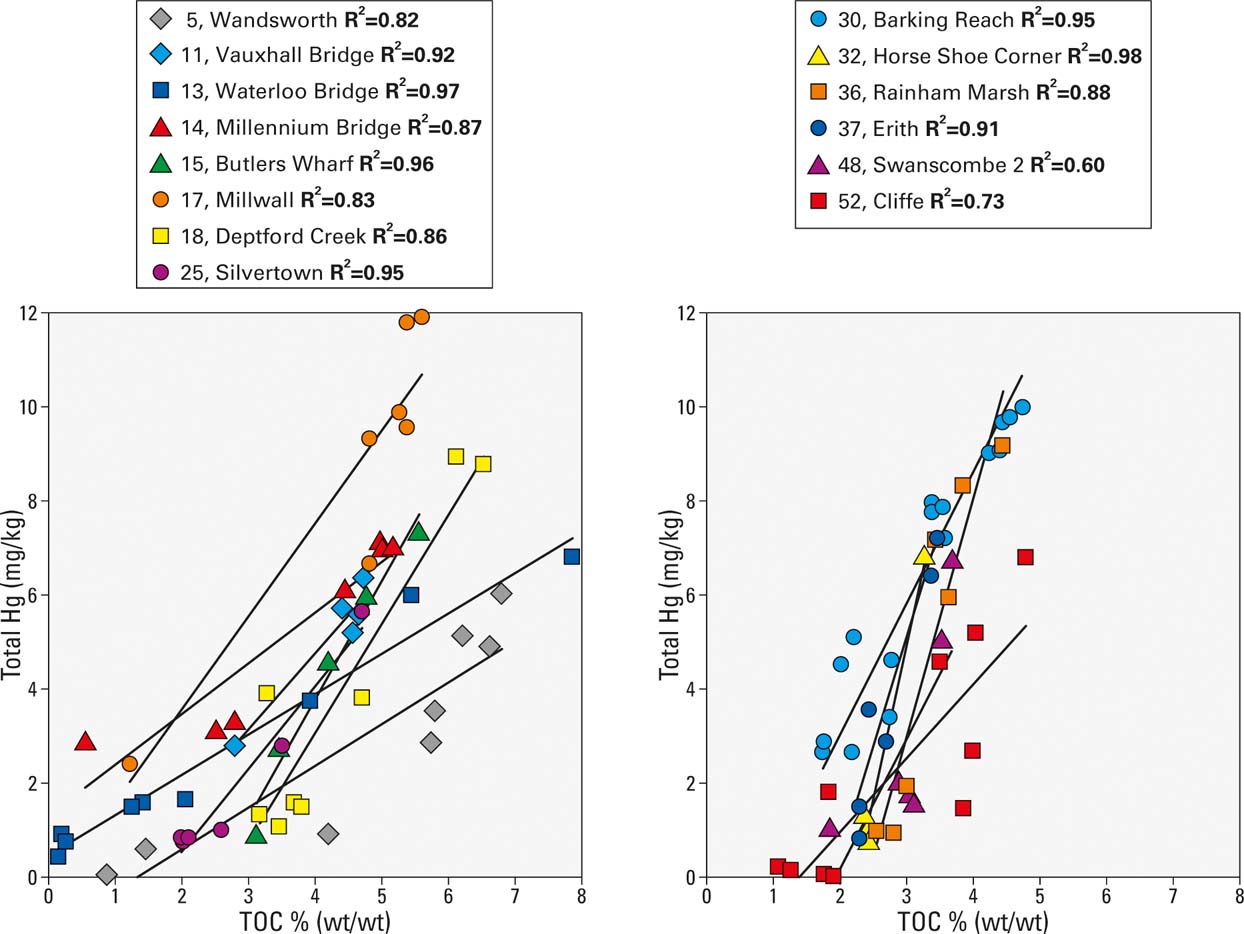
The sorption of mercury to particulate organic matter and the surfaces of minerals is well documented from laboratory experiments, but is not always observed in industrialised estuarine sediments due the diverse range of physico-chemical conditions and confounding issues of sediment mixing and co-variance with other contaminants and point sources (Haitzer et al. Reference Haitzer, Aiken and Ryan2003; Vane et al. Reference Vane, Harrison and Kim2007; Bengtsson & Picado Reference Bengtsson and Picado2008). Examination of the TOC to Hg bi-plot for all the sediments shows a positive correlation (R2, 0.47) which suggests that in the Thames, higher amounts of Hg occur in sediments with a higher percentage of TOC (Fig. 3). This relationship was particularly pronounced (R2, 0.81–0.97) in cores from the majority of sites within the London reaches; namely Wandsworth, Vauxhall Bridge, Waterloo Bridge, Butlers Wharf, Millwall, Deptford and Silvertown (Fig. 4). Similarly, cores from the outer estuary with elevated Hg concentrations, such as Barking Reach, Horse Shoe Corner, Rainham, Erith and Cliffe, were also correlated (R2, 0.6–0.98) (Fig. 4). The association of Hg with TOC was not ubiquitous, however; for example, Hg and TOC were only weakly correlated at Blackwall Tunnel (20), Cuckolds Point (16) and Millennium Dome (21, 23). The relationship between grain size and Hg content was far less obvious, with only weak positive correlation between Hg and clay content (R2, 0.10) in the London reaches and a negative correlation between Hg and sand size particles (Fig. 3).
Bi-plot of total Hg concentration versus total organic carbon (TOC) content from selected Thames sediment cores.
2.4. Comparison with other estuaries
Mercury concentrations in UK and international estuarine and coastal sediments are presented in Table 2. Ranking the ‘concentrations for UK urban-industrial estuaries using the surface concentration data suggests a downward hierarchy of Thames–Tyne–Mersey–Clyde–Medway; a similar situation is observed using the more limited UK estuary core data, where the hierarchy follows Thames–Mersey–Medway (Table 2). In light of the Medway being a tributary of the Thames and having a history of land-fill, dockyards, sewage treatment works and power generation (Spencer Reference Spencer2002), the four-fold-higher Hg concentrations for the Thames, as compared to the Medway, is surprising. One explanation is that the size and breadth of industry discharging historically into the Thames was of far greater magnitude, and so the level of fugitive metals input is accordingly higher. A second possibility is that aerial deposition, a major source of Hg from vehicle emissions, particulates from London's 26 power stations and domestic wood and coal burning, does not significantly impact the Medway, which is located 55 km from the capital on the eastern edge of the Thames estuary.
Comparison of total mercury concentrations from estuaries and coasts

* Includes cores from salt marshes as well as from intertidal zone
On an international basis, the mean concentrations and ranges of Thames sediments rank below those from sediments of the Passiac River, New Jersey, USA, which suffered from chronic pollution from numerous industries, including the manufacture of pesticides and herbicides, such as the defoliant Agent Orange (Huntley et al. Reference Huntley, Bonnevie and Wenning1995). Comparison of mean Hg content with European and Chinese estuaries suggests a hierarchy of Thames–Scheldt–Seine–Hong Kong–Gdansk–Pearl River Delta, reflecting London's long urban and industrial history (Table 2 and references therein).
2.5. Sediment quality assessment
Several risk-based benchmarking tools have been developed to facilitate the rapid evaluation of estuarine and marine sediment quality, as part of an overall weight-of-evidence approach to protecting sediment function (Table 3). Both the Canadian sediment quality guidelines (SQG) for the protection of aquatic life and the Centre for Environment, Fisheries and Aquaculture (CEFAS) dredging disposal guidelines are widely utilised by UK marine managers. These guidelines are based upon both laboratory and field studies that examined the ecological effects of a range of metals, including total Hg contamination, on multiple sensitive sediment-dwelling organisms (Long et al. Reference Long, MacDonald, Smith and Calder1995; CEFAS 1998; CCME 2002) (Table 3). For example, the Hg threshold effect limit (TEL) of 0.13 mg/kg is likely to cause adverse biological effects with an 8 % incidence, whereas values between the TEL and the probable effect level (PEL) limit of 0.70 mg/kg have a 24 % incidence, and those at or above PEL >0.71 mg/kg is the level shown to cause harmful effects, with a 37 % incidence. SQG benchmarks therefore provide a general indication of possible harmful ecological effects/risk and do not represent strict boundaries between polluted and non-polluted conditions.
Categorisation of total Hg concentrations of tidal Thames sediments using published marine/aquatic sediment quality guidelines (non-statutory).

Assessment of the Thames sediments Hg concentrations using the more conservative criteria (Canadian SQG) showed that the majority of samples (58 % (n=203)) exceeded probable effects levels (PEL), indicating that the sediments' Hg concentrations pose a high risk of adverse effects on biota in the Thames estuary; whereas 22 % (n=78) had values between TEL and PEL, and only 20 % (n=70) samples were below the no-ecological-effect level of 0.12 mg/kg TEL (Table 3). Benchmarking against CEFAS guideline levels for the disposal of dredged material at sea revealed that 88 sediment intervals (25 %) from 21 different core sites exceeded the 3 mg/kg criteria and therefore fall within Action Level 2, which are by definition unsuitable for disposal at sea (Figs 1, 2; Table 3); 173 samples (49 %) from 52 core sites fell between 0.3 and 3 mg/kg (further assessment required); and 90 intervals (26 %) were below Action Level 1, which suggests that these are of no immediate concern from a dredging and disposal standpoint.
2.6. Normal background concentrations (NBC)
In industrialised settings such as the Thames, anomalously-high contaminant concentrations can be identified using a recently developed method that defines normal background concentrations (NBCs) (Ander et al. Reference Ander, Johnson, Cave, Palumbo-Roe, Nathanail and Lark2013). NBCs are conservative representative values that have been used for risk-based land management of contaminants in soil (Cave et al. Reference Cave, Johnson, Ander and Palumbo-Roe2012; Vane et al. Reference Vane, Kim, Beriro, Cave, Knights, Moss-Hayes and Nathanail2014). They are applicable to this study because they provide a value against which to compare health-based assessment criteria such as SQG. NBCs are more appropriate than using a measure of central tendency (e.g., mean), since they provide an upper representative concentration that accounts for the majority of samples (i.e., ∼95 %) rather than a measure of central tendency (e.g., mean) that fails to account for a large proportion (i.e., ∼50 %) of sample concentrations.
NBCs should be considered as a conservative estimate of the upper concentration that might be expected to be representative of the existing background at a given location. In other words, if a new sample were to be taken in the Thames with a concentration below the NBC, it is likely to come from normal background. This approach is useful for complex urban river systems such as the Thames because it defines a baseline with which future studies might be compared, as well as providing a tool for identifying existing or future point sources of pollution to the estuary. The NBC data are summarised in Figure 6.
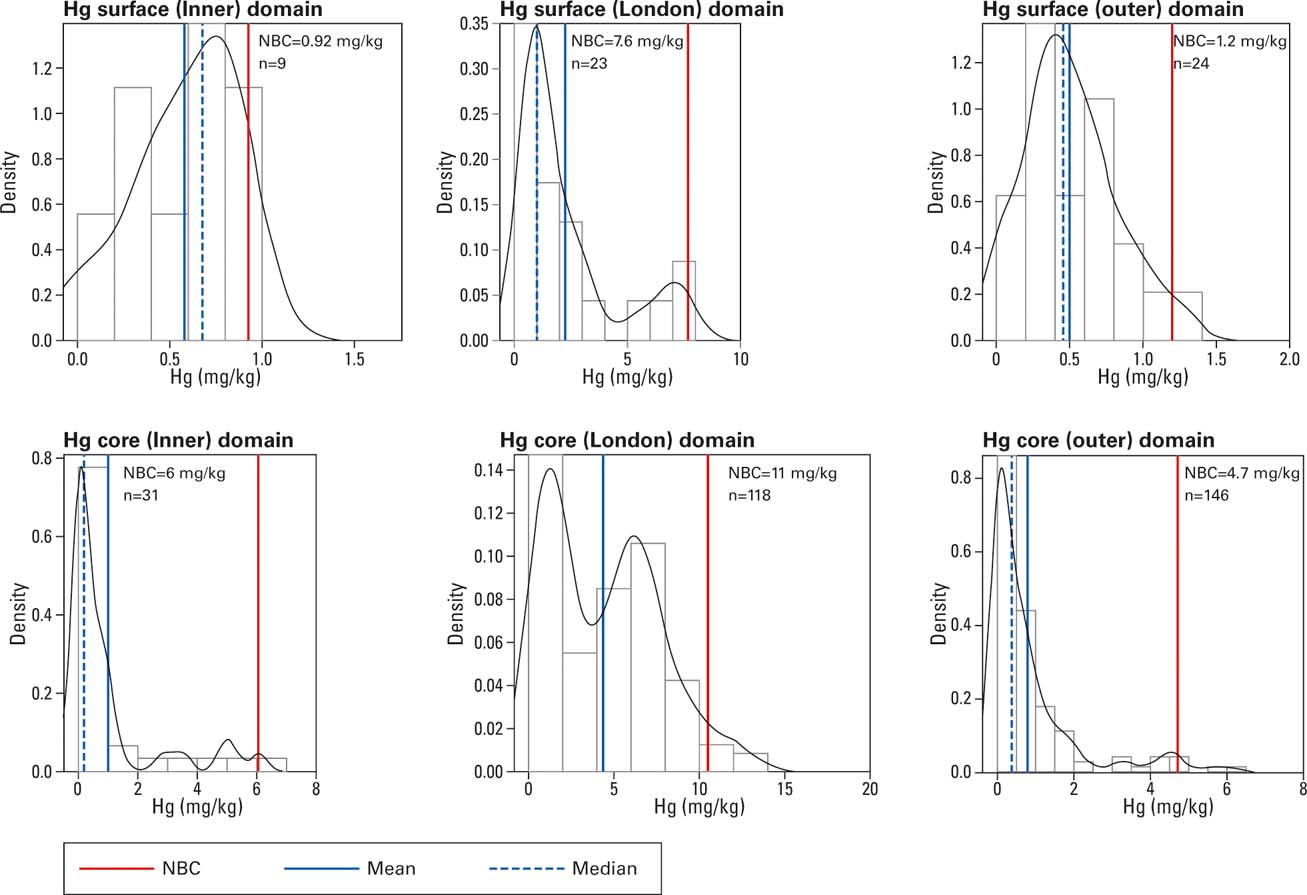
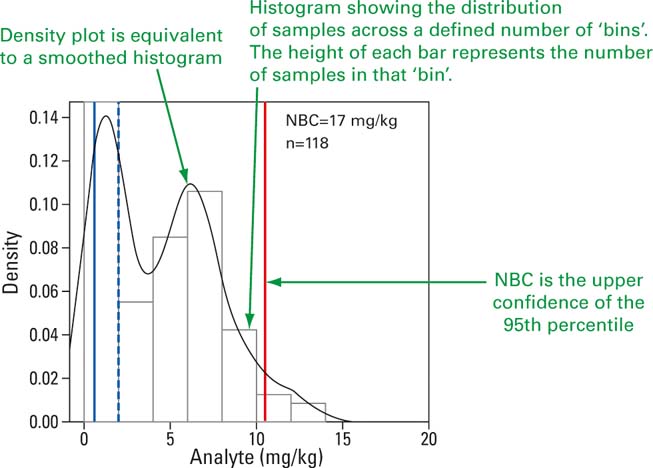
The Hg data used to calculate the NBC are assumed to be random variables representative of a normal background concentration for the area, based on contributions from fixed effects (diffuse and/or geogenic sources) and continuous random variation (normally distributed), excluding point source contamination (site-specific contaminant introductions manifest themselves acceptably as outliers). The Hg concentration data were divided into three geographical areas – inner Thames, London and outer Thames – and two depths; namely, surface (0–10 cm) and >10 cm core sediments. The Hg concentrations are summarised statistically in Figure 5 by their frequency distribution, mean, median and upper confidence limit (UCL) of the 95th percentile. The distribution of each dataset is presented as a histogram overlain by a Kernel Density Estimation plot, to show how the sample concentrations are distributed across their range. The mean and median are measures of the central tendency of the data [Fig 6].
Normal background concentration summary statistics for Hg concentrations, recorded Thames surface sediments and sediment cores of the Thames estuary.
Explanation of normal background concentration diagram.

Figure 5 shows that the Hg data for the surface samples are positively skewed, meaning there is a prevalence of lower concentrations of Hg. The calculated NBCs for surface samples (≤10 cm; n=56) are: 0.92 mg/kg for the inner Thames (n=9); 7.6 mg/kg for the London reaches (n=25); and 1.2 mg/kg (n=24) for the outer Thames. Figure 6 also shows that the data are positively skewed. The calculated NBCs for core samples (>10 cm; n=295) are: 6 mg/kg for the inner Thames; 11 mg/kg for the London reaches; and 4.7 mg/kg for the outer Thames (Fig. 5).
3. Conclusions
1. The spatial distribution of Hg in the Thames estuary follows a clear pattern of lower values in the upper Thames, highest concentrations in the London reaches and a return to lower values in the outer Thames. This lateral W–E spatial distribution is seen both at the surface and in the subsurface. The elevated Hg content spans London from Battersea to Crossness and is attributed to manifold industrial point sources and municipal discharge outfalls such as, but not limited to, power stations, gas works, shipping and paper manufacture and sewage treatment activities.
2. Although the Thames is a turbid macrotidal estuary with strong current velocities and numerous tributaries, the sediment Hg depth-profiles presented here show either a complete or partial rise–peak–fall in concentrations, constituting a record of the combined diffuse and point source anthropogenic activity in London. The majority of cores show a near-surface decrease in Hg content, which is attributed to a general fall in certain polluting industrial activities discharging wastes directly into the river, combined with improved environmental legislation as well as management of the river. These results therefore support the view that the overall ecological status of the river is improving. Nevertheless, if the spatial and temporal pattern of Hg pollution is considered as a whole, the Thames estuary ranks as one of Europe's most polluted estuaries.
3. The importance of organic matter content in controlling metallic pollution in estuaries is demonstrated by a clear positive correlation between Hg and TOC. This feature was observed throughout the estuary, both in the surface and subsurface. Conversely, no discernible correlation between Hg and particles of clay (<4 µm) and silt (4–64 µm) was observed and Hg was negatively correlated to sand size particles (64–2000 µm).
4. Concentrations of Hg ranged from 0.01 to 12.07 mg/kg, with a mean of 2.10 mg/kg. A significant proportion of these concentrations exceed accepted sediment quality guideline, established to protect sensitive sediment dwelling organisms and provide non-statutory guidance for the disposal of dredged spoil at sea. This study shows that surface samples do not provide a clear indication of sediment contamination and that higher concentrations may lie 10–80 cm beneath the surface. Taken together, the down-profile changes in Hg content probably reflect lower recent inputs and higher historic inputs, which, in turn, suggest an improvement in Thames sediment quality. In light of the high Hg concentrations encountered in the Thames sediments, we propose that normal background concentrations of 0.92 mg/kg (entire estuary surface), and values of 4.7–11 mg/kg (subsurface) could be adopted for the management of Thames sediment quality.
4. Acknowledgements
Collection of the sediment cores would not have been possible without the assistance of staff at the Port of London Authority; particular thanks are due to Alex Mortley and PLA coxswains Spencer Wells and Danny Marsh. The authors also thank Lars Åkesson and staff at the Environment Agency for providing logistical support. CHV is also indebted to Stephen Pearson, Hannah Evans and Nicole Khan for assisting in sample collection. This paper is published by permission of the Executive Director, British Geological Survey (NERC). BGS/NERC Reference: IPR/186-21CM.



 Open access

