

In recent years, diet and physical activity patterns of the Indian population have undergone major changes. This trend is exemplified in the urban setting where industrialization and global influences are more prevalent. Convenience food culture has led to the consumption of processed foods which are refined and high in sugars, fats and salt. Increased consumption of these foods coupled with decreased physical activity has contributed to the rising rates of chronic lifestyle diseases among young adultsReference Den Hartog, Stavereren and Brouwer (1) .
Good dietary practices are one of the many factors that can contribute to a healthy lifestyle. However, frequent consumption of cereals and legumes with limited intakes of dairy products, vegetables and fruits can cause an imbalance of nutrients that may result in micronutrient deficiencies. Poor dietary habits in combination with physical activity risk factors may result in poor health outcomesReference Schiff (2) .
An individual’s diet is influenced by his/her knowledge of nutritionReference Roberts and Marvin (3) . Nutrition knowledge (NK) has been shown to play an important role in influencing healthy food habits, ensuring that nutrient needs are met throughout the life cycle. Knowledge of nutritional needs facilitates food choices that enhance health and wellness by preventing excess or less intake of nutrients( Reference Worsley 4 ). Educating the population on healthy eating habits and increasing their awareness of the importance of healthy foods are the first logical steps in altering eating habits. However, increasing awareness does not necessarily ensure appropriate action, as the relationship between what people know and what people do is ‘very weak’Reference Chapman, Ham and Liesen (5) .
Studies identifying determinants of NK, including sociodemographic and cultural factors( Reference Murata, Shah and Adam 6 , Reference Connolly, Unwin and Sherriff 7 ), warrant community-specific studies. A report on NK in England focused on the serious gaps in knowledge of the relationship between diet and diseaseReference Parameter, Waller and Wardle (8) . In other Caucasian studies, the predictors may remain the same; however, findings from these studies regarding the association of NK with practice are inconsistent( Reference O’Brien and Davies 9 ).
Physical activity knowledge (PK) concerns the awareness and understanding of the benefits of physical activity, which has an impact on daily lifeReference Vega, Sallis and Patterson (10) . A study on Hong Kong Chinese adults indicated that increasing understanding of the effects of physical activity, particularly knowledge about appropriate exercise prescription, is a positive factor in improving participation levelsReference Hui and Morrow (11) . Research on the relationship between knowledge of physical activity recommendations and adherence to a suitable regimen has shown mixed results. Cameron et al.Reference Cameron, Craig and Bull (12) and Plotnikoff et al.Reference Plotnikoff, Brunet and Courneya (13) found that knowledge of physical activity recommendations predicted the level of physical activity. In contrast, Morrow et al.Reference Morrow, Krzewinski-Malone and Jackson (14) found no association between knowledge of physical activity and the actual level of physical activity. A possible explanation for the inconsistent results is that knowledge of physical activity alone does not directly affect behaviour.
There are very few studies in India on NK and PK, particularly in healthy adults. The available literature on NK and PK focuses on specific populations, such as patients with diabetes, individuals with hypertension, athletes or students( Reference Ambigapathy, Ambigapathy and Ling 15 – Reference Hui, Hui and Xie 17 ). It is surprising that relatively few studies have evaluated levels of NK and PK in the general community or the impact of NK on dietary intakes and the impact of PK on physical activity regimen( Reference Hui, Hui and Xie 17 – Reference Sharma, Gernand and Day 20 ). Given the widespread lifestyle education initiatives, studies in healthy populations are necessary.
Taken together, NK and PK assessment are critical. Levels of knowledge may be associated with eating habits and may promote alterations in nutritional status and daily physical activity. Therefore, the objectives of the present study were to: (i) assess knowledge about nutrition and physical activity in healthy Indian adults; (ii) examine associations of knowledge with sociodemographic and anthropometric parameters; and (iii) evaluate the relationship between knowledge of nutrition and physical activity and practice (dietary intake and daily physical activity).
Methods
Selection of participants
The current cross-sectional study was conducted in Pune city in the western region of Maharashtra State, India. The city is the second largest in the state and the seventh most populous city in India. Pune is known for its manufacturing and automobile industries, as well as for research institutes, information technology, education and management and training. Fifteen to twenty sites comprising housing societies, residential areas, schools, corporate offices and hospitals (for routine health checks) from Pune were approached during 2014–2015 for participation in the study. From these sites, a total of 2500 adults was randomly selected, of whom 1800 provided consent to take part in the study. The following inclusion criteria were used for enrolment of the participants: (i) healthy adult aged 35–50 years; (ii) not suffering from any major or minor ailments or any other health complaints; and (iii) not suffering from any nutrition deficiency disorder or any established metabolic disorder (CVD, diabetes mellitus, hypertension). A clinical examination was administered to all participants prior to enrolment. In total, 1000 adults met the inclusion criteria. Of these, 720 adults (361 men) were selected by computerized random number generation. With the sample size of 700, the power of the study was estimated to be 80 % at the 5 % level of significance to detect a difference of more than 10 % between groups based on the sd of the score observed from previous studies( Reference Parmenter and Wardle 21 , Reference Thakur and D’Amico 22 ). Written informed consent was obtained from all participants prior to commencement of the study. The research protocol was approved by the institutional ethics committee.
Anthropometric and demographic measurements
Height was measured to the nearest 0·1 cm (Leicester Height Meter, range 60–207 cm; Child Growth Foundation, UK)Reference Pandit-Agrawal, Khadilkar and Chiplonkar (23) . Weight was measured on an electronic digital scale to the nearest 0·1 kg (Salter India, Faridabad, India). Waist circumference was measured with an inelastic tape to the nearest 0·1 cm at the end of normal expiration at the narrowest point between the lower borders of the rib cage and the iliac crest (Seca 201 Ergonomic circumference measuring tape, ECOMED). Hip circumference was measured as maximal circumference at the level of the trochanters. BMI was computed using the formula: BMI=[weight (kg)]/[height (m)]2. Using Asian Indian BMI cut-offs, participants were classified as normal weight (BMI<23 kg/m2), overweight (BMI=23–28 kg/m2) or obese (BMI>28 kg/m2)Reference Misra (24) .
Body fat percentage was estimated using bioelectrical impedance (Tanita SC-240 portable body composition analyser, Japan) with a sensitivity of 0·1 kg and 0·5 % fat. The equipment utilizes the principle of leg-to-leg bioelectrical impedance analysis, which is accurate and reliable for calculating fat percentage. Participants were classified as normal fat and adipose using Williams’ body fat cut-offs of 25 and 35 % for men and women, respectivelyReference Williams, Going and Lohman (25) .
Using structured questionnaires from the National Family Health Survey (26) , information on demographic and socioeconomic characteristics was recorded.
Clinical examination
A physician performed a routine clinical examination of each participant. Blood pressure was assessed by auscultation with a mercury-column sphygmomanometer. The onset of the first Korotkoff phase was used to determine systolic blood pressure, and the onset of the fifth Korotkoff phase was used to determine diastolic blood pressure. The average of the three measurements was used for analysis.
Diet assessment
Daily food habits were assessed using a standardized semi-quantitative FFQ administered by the interview methodReference Chiplonkar, Agte and Mengale (27) . The FFQ consisted of cooked food items derived from an exhaustive list of the habitual food items of the study participants. The food items were categorized into the following food groups: green leafy vegetables, sprouts, fruits, salads, junk/fast foods (fried snacks) and bakery items (refined foods such as breads and biscuits). The frequency of consuming various food groups was further divided for analysis purposes into three categories: daily, more frequent (once or twice weekly) and less frequent (once or twice monthly). Test–retest reliability of these measures was calculated (intraclass correlation coefficient, r=0·93, P<0·05).
Dietary intakes were also assessed using the 24 h recall method for one day using the multiple-pass approachReference Guenther, DeMaio and Berlin (28) . Nutrient intakes were estimated by applying nutritive values from the database of Indian cooked foods using the nutrient analysis software C-Diet version 2.1 (Xenios Technology, 2012) comprising cooked and raw food databasesReference Chiplonkar and Agte (29) . Comparison of participants’ nutrient intakes with the Indian RDA for their age and gender were made to judge the adequacy (30) .
Physical activity
Daily physical activity was assessed with a validated, structured, 24 h activity questionnaireReference Chiplonkar, Agte and Tarwadi (31) . Type of exercise and total time spent in daily exercise were noted for each participant. Detailed information of time (minutes) spent in sleep, daily chores, meals, commuting, office and household work, reading, exercise time and watching television were recorded using a standardized questionnaire. Total exercise time included time spent in walking, jogging, playing a sport or at a gym. As per the guidelines of the Centers for Disease Control and Prevention (32) , time spent in activity was further divided into the categories of 30–60 min/d and >60 min/d.
Nutrition and physical activity knowledge assessment
A standardized NK and PK questionnaire was adapted for Indian circumstances( Reference Parmenter and Wardle 21 , Reference Thakur and D’Amico 22 ). The questionnaire was used to elicit information on nutrition and physical activity knowledge.
1. NK questionnaire: Consisted of questions on NK regarding dietary recommendations, sources of nutrients and diet–disease relationships (covering declarative knowledge) and on food choices and cooking practices (covering procedural knowledge). There was a total of twenty questions in this section.
2. PK questionnaire: Consisted of questions on knowledge of physical activity such as types of activity, facts and myths related to exercise. There were ten questions in this section.
Reliability of the questionnaire was assessed by Pearson’s correlation coefficient at two time points, with a gap of 8 d. For NK, results indicated acceptable reproducibility for the tool with intraclass correlation coefficient r=0·81 (P<0·05) and Cronbach’s α=0·83. Similarly, for PK questionnaire, intraclass correlation coefficient was r=0·84 (P<0·05) and Cronbach’s α=0·89.
One point was given for each acceptable (correct) answer and the sum of scores was calculated to define the knowledge score. For NK, the maximum score was 20 points, as there were twenty questions. Similarly, for PK, the maximum score was 10 points, as there were ten questions. When the NK and PK scores of participants were arranged in ascending order of magnitude, the two points that divided each of these ordered distributions into three parts were identified, each containing a third of the population (tertiles). The first tertile (low scores), second (average scores) and third tertile (high scores) were termed ‘low’, ‘average’ and ‘good’ knowledge for nutrition and physical activityReference Pon, Noor-Aini and Ong (33) .
Statistical methods
Analyses were performed using the statistical software package SPSS for Windows version 11.0 (2001). Prior to the statistical analyses, all study parameters were tested for normality using the one-sample Kolmogorov–Smirnov test. Descriptive statistics, including mean and sd or se for continuous variables, were calculated. Non-normal data were presented as median and interquartile range. Differences in means between two groups were tested using Student’s t test, while ANOVA was used to test for differences between three groups. The t test and ANOVA were used to examine group differences as appropriate. Multivariate generalized regression model analysis was performed for NK and PK scores, adjusting for sociodemographic factors. Level of statistical significance was set at P<0·05.
Results
Mean age of participants was 42·7 (sd 9·4) years. Mean age, weight, height, waist circumference, systolic and diastolic blood pressures were significantly higher in men compared with women, whereas BMI, hip circumference and total body fat percentage were higher in women (P<0·05). About 49 % of participants (53·5 % of men and 44·9 % of women) were overweight (BMI greater than the Asian cut-off of 23 kg/m2) and about 25 % (20·0 % of men and 29·9 % of women) were obese (BMI>28 kg/m2). More than half of the study participants (52·9 %) were adipose (i.e. had high body fat percentage) when measured using bioelectrical impedance analysis (Table 1).
General characteristics of the study participants: apparently healthy adults aged 35–50 years, Pune, India, 2014–2015

* Significant difference between genders: P<0·05 (t test).
† Overweight, BMI=23–28 kg/m2; obese, BMI>28 kg/m2 (Asian Indian BMI cut-offs)( Reference Misra 24 ).
‡ Adipose, body fat percentage >25 % for men and >35 % for women (Williams’ body fat cut-offs)( Reference Williams, Going and Lohman 25 ).
Data on sociodemographic factors showed that 70 % were graduates and postgraduates, more than a quarter (28·1 %) had studied up to high school (12 years of schooling) and the remaining 2 % had studied up to middle school (10 years of schooling). For the majority of participants (88·3 %), their primary occupation was service (i.e. either government or a private job). Four per cent were self-employed in their own business, 6 % were homemakers and the remaining 1·3 % were students.
Average minutes of PA was 30 for both men and women (Table 2). Almost half (47·3 %) of the participants reported no physical activity or exercising for less than 30 min/d, 33·6 % reported exercising for 30–60 min/d and only 19·1 % exercised for at least 60 min/d, on 6 d/week. To explore association of physical activity with obesity, average time spent in physical activity was compared across BMI categories. It was observed that daily time spent in physical activity was similar across all three categories: median (interquartile range) was 30 (0–120) min in overweight, 30 (0–200) min in obese and 30 (0–90) min in normal-weight participants (P>0·1).
Daily physical activity of the study participants: apparently healthy adults aged 35–50 years, Pune, India, 2014–2015
IQR, interquartile range.
* Significant difference between genders: P<0·05 (non-parametric Kruskal–Wallis test).
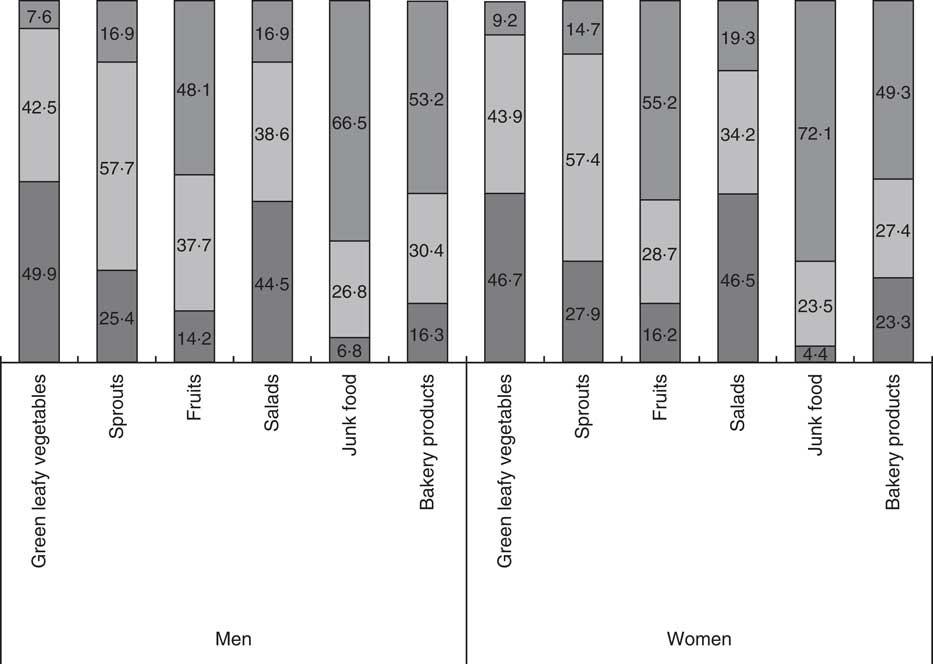
Figure 1 illustrates participants’ consumption frequencies of the different food groups. Almost half of the participants reported daily intake of green leafy vegetables (48·7 %) and salads (45·9 %), while many participants reported frequent intake of sprouts (57·6 %). Conversely, fruit intake was decreased, with 15·2 % of participants reporting daily intake and 33·4 % reporting frequent intake. Consumption of junk foods and bakery products was also reported by a lower percentage of participants on a frequent basis (25·2 % and 29·0 %).
Consumption frequency (![]() , daily;
, daily; ![]() , more frequently, i.e. once or twice weekly;
, more frequently, i.e. once or twice weekly; ![]() , less frequently, i.e. once or twice monthly) of different food groups, by gender, among 720 apparently healthy adults (361 men) aged 35–50 years, Pune, India, 2014–2015. Values presented are the percentages of men and women consuming the food groups at the respective frequencies
, less frequently, i.e. once or twice monthly) of different food groups, by gender, among 720 apparently healthy adults (361 men) aged 35–50 years, Pune, India, 2014–2015. Values presented are the percentages of men and women consuming the food groups at the respective frequencies
Mean intakes of energy, protein, fat and carbohydrates were significantly higher in men than women (P<0·05; Table 3). Micronutrients were expressed as energy-adjusted values. Micronutrient intakes were similar in men and women (P>0·1; Table 3). Furthermore, energy intake was 64 % of the RDA and protein was 68 % of the RDA, indicating inadequacy of these nutrients, whereas fat intake was more than double (144 %) the Indian RDA in both men and women. Ca and vitamin C were 73 and 99 % of the RDA, respectively; whereas β-carotene, folic acid, Zn and Fe intakes were less than 50 % of the RDA (33, 42, 43 and 37 % of the RDA, respectively), indicating micronutrient deficiency.
Daily nutrient intakes of the study participants: apparently healthy adults aged 35–50 years, Pune, India, 2014–2015
* Significant difference between genders: P<0·05 (t test).
Daily fat intake was found to be significantly different across BMI categories (P<0·05). Overweight participants had significantly a higher mean intake of fat (41·2 (sd 17·8) g/d) compared with obese (37·2 (sd 14·5) g/d) and normal-weight participants (37·3 (sd 14·2) g/d; P<0·05).
Nutrition knowledge score
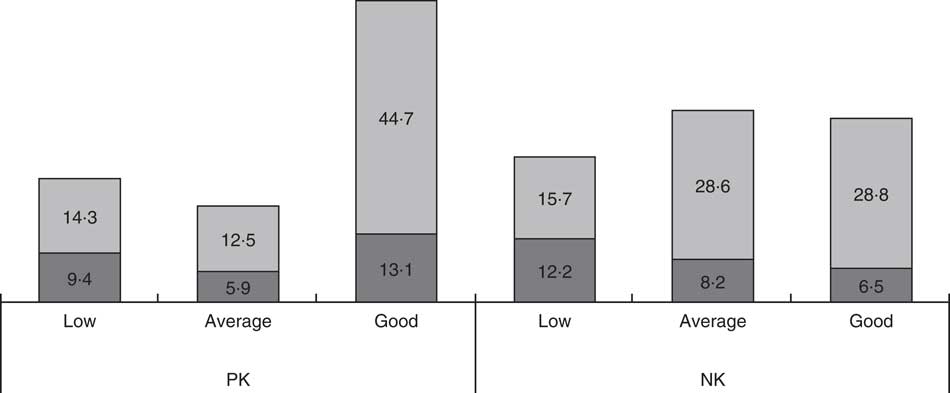
Mean NK score was 10·2 (sd 2·9) and was similar among men (9·9 (sd 3·0)) and women (10·4 (sd 2·7); P>0·1). Tertiles of NK score were used for further analysis as low knowledge (<9 points, lowest tertile), average knowledge (9–12 points, middle tertile) and good knowledge (>12 points, highest tertile). Figure 2 illustrates NK across educational categories. It was observed that a significantly higher percentage of participants who were highly educated (graduates and postgraduates) were in the good knowledge group compared with less educated participants (undergraduates; P<0·05). This indicates that the higher the education, the better was the knowledge on nutrition.
Physical activity knowledge (PK) and nutrition knowledge (NK), by educational level (![]() , undergraduates;
, undergraduates; ![]() , graduates and postgraduates), among 720 apparently healthy adults (361 men) aged 35–50 years, Pune, India, 2014–2015. Values presented are the percentages of the population with low, average and good knowledge on physical activity (PK score <6, 6–7 and >7 points, respectively, out of a maximum of 10) and nutrition (NK score <9, 9–12 and >12 points, respectively, out of a maximum of 20) by level of education
, graduates and postgraduates), among 720 apparently healthy adults (361 men) aged 35–50 years, Pune, India, 2014–2015. Values presented are the percentages of the population with low, average and good knowledge on physical activity (PK score <6, 6–7 and >7 points, respectively, out of a maximum of 10) and nutrition (NK score <9, 9–12 and >12 points, respectively, out of a maximum of 20) by level of education
When age was compared across NK groups, a decreasing trend of age was noticed with increasing (ascending) knowledge from low to good (P<0·05). Mean age was 45·1 (sd 10·8) years in the low knowledge group (i.e. NK score <9 points) as opposed to 40·7 (sd 8·7) years in the good knowledge group (i.e. NK score >12 points; P<0·05), indicating that younger age groups had significantly higher nutritional knowledge than older participants.
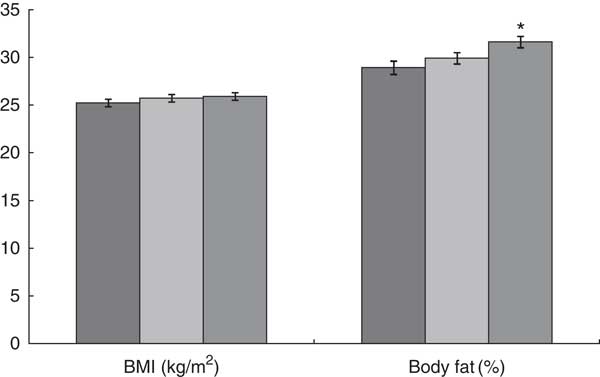
To evaluate the relationship of BMI and body fat with NK, mean BMI and body fat percentage were compared across the NK groups (Fig. 3). Mean BMI was observed to be similar in all knowledge groups (P>0·1). However, mean body fat percentage increased with increasing (ascending) knowledge (from low to good), being significantly higher in the group with good nutritional knowledge; thus, NK was higher in high fat individuals.
BMI and body fat percentage, by nutrition knowledge (NK) category (![]() , low, i.e. NK score <9 points;
, low, i.e. NK score <9 points; ![]() , average, i.e. NK score=9–12 points;
, average, i.e. NK score=9–12 points; ![]() , good, i.e. NK score >12 points; out of a maximum of 20), among 720 apparently healthy adults (361 men) aged 35–50 years, Pune, India, 2014–2015. Values presented are means with their standard deviations represented by vertical bars; *P<0·05
, good, i.e. NK score >12 points; out of a maximum of 20), among 720 apparently healthy adults (361 men) aged 35–50 years, Pune, India, 2014–2015. Values presented are means with their standard deviations represented by vertical bars; *P<0·05
Apart from food groups, dietary energy, fat and protein intakes were also compared across NK score categories. Although not statistically significant, an increasing trend was observed across the three knowledge groups (<9, 9–12 and >12 points) for mean intake of energy (6255 (sd 170) kJ/d (1495 (sd 40·7) kcal/d), 6355 (sd 149) kJ/d (1519 (sd 35·7) kcal/d) and 6565 (sd 166) kJ/d (1569 (sd 39·7) kcal/d), respectively; P>0·1) and fat (39·6 (sd 1·4), 40·5 (sd 1·3) and 42·3 (sd 1·4) g/d, respectively; P>0·1). Mean protein intake was significantly higher in the good knowledge group (i.e. NK score >12 points; 42·3 (sd 1·4) g/d) than in the other groups (36·9 (sd 13·2) and 40·5 (sd 1·3) g/d, respectively; P<0·05).
Additionally, to explore the relationship between NK and dietary habits, a multivariate regression model was fitted with NK score as dependent variable and food consumption groups as explanatory variables, adjusting for sociodemographic factors (age and education). Results indicate that NK was positively associated with dietary intakes of green leafy vegetables, sprouts and salads but negatively associated with fruit intake even after adjusting for sociodemographic status (P<0·05). Intakes of bakery products and junk foods did not show any association with NK (P>0·05; Table 4).
Generalized multivariate regression models for nutrition and physical activity knowledge scores among 720 apparently healthy adults (361 men) aged 35–50 years, Pune, India, 2014–2015
Ref., reference category.
* P<0·05.
† Dependent variable for NK model is NK score; food groups are independent variables. Model is adjusted for sociodemographic status (age, education and occupation).
‡ Dependent variable PK model is PK score; food groups are independent variables. Model is adjusted for sociodemographic status (age, education and occupation).
Physical activity knowledge score
Mean PK score was 6·5 (sd 1·7) and was similar in men and women (6·6 (sd 1·7) and 6·5 (sd 1·8), respectively; P>0·1). PK scores were categorized into tertiles as ‘low’ (<6 points), ‘average’ (6–7 points) and ‘good’ (>7 points) knowledge.
PK score was compared across education categories and it was observed that a significantly higher percentage of participants who were graduates and postgraduates were in the good knowledge group as compared with undergraduates (P<0·05). This indicates that the higher the education, the better was the knowledge on physical activity (Fig. 2).
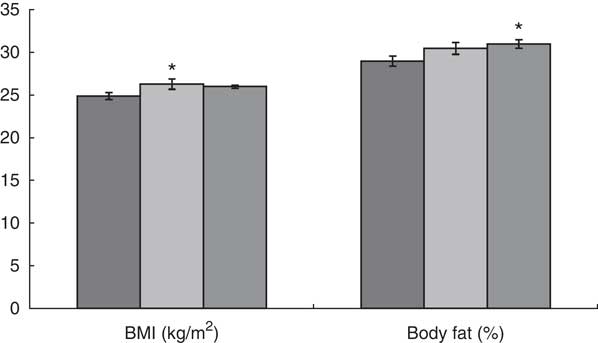
Further, to evaluate association of PK with anthropometry, mean BMI and body fat percentage were compared across PK groups (Fig. 4). Mean BMI showed an increasing trend with increasing (ascending) group of knowledge (low to good). BMI was significantly higher in the middle PK group as compared with other two groups (P<0·05). Also, mean body fat percentage increased with increasing (ascending) knowledge (low to good), being significantly higher in the group with highest knowledge on physical activity; thus, PK was higher in high fat individuals (Fig. 4). These results indicate that overweight and adipose individuals had better PK scores.
BMI and body fat percentage, by physical activity knowledge (PK) category (![]() , low, i.e. PK score <6 points;
, low, i.e. PK score <6 points; ![]() , average, i.e. PK score=6–7 points;
, average, i.e. PK score=6–7 points; ![]() , good, i.e. PK score >7 points; out of a maximum of 10), among 720 apparently healthy adults (361 men) aged 35–50 years, Pune, India, 2014–2015. Values presented are means with their standard deviations represented by vertical bars; *P<0·05
, good, i.e. PK score >7 points; out of a maximum of 10), among 720 apparently healthy adults (361 men) aged 35–50 years, Pune, India, 2014–2015. Values presented are means with their standard deviations represented by vertical bars; *P<0·05
PK scores were compared across participants who exercised and those who did not. Mean PK scores were the same (6·5 (sd 1·7)) in both groups, those who did and did not exercise. The differences were not statistically significant (P>0·05).
A generalized multivariate regression model was fitted with PK score as dependent variable and BMI and daily activity groups as explanatory variables adjusting for sociodemographic factors (age and education). Results indicate that PK was positively associated with BMI, office hours, and time spent watching television and reading, but negatively associated with household hours. This association persisted even after adjusting for sociodemographic status (P<0·05). This suggests that participants who spent more time in an office, watching television or reading and who were overweight had more knowledge on physical activity (Table 4). Overall, the results suggest that overweight and obese participants had good knowledge on physical activity and they also spent significantly more time in physical activity than normal-weight participants.
Discussion
The present study highlights the current status of nutrition and physical activity knowledge and their association with BMI, adiposity and dietary intakes in healthy Indian adults from Pune, a metropolitan city in western India. The city has a varied population due to migration, with diet and lifestyle diversity. Our results demonstrate that education was positively associated with NK and PK. Consumption of healthy foods such as green leafy vegetables, sprouts and salads was positively associated with NK. Television and reading time and BMI were positively associated with PK. BMI and body fat percentage were significant factors related to NK and PK.
Mean NK score in the present study was 10·2 (of 20 points). A similar study from Malaysia used cut-offs of 9 and 14 points out of 20 to define low (0–9) moderate (10–14) and high (15–20) score of NKReference Pon, Noor-Aini and Ong (33) . In their systematic review, Spronk et al. reported a mean score of 11·2 (of 17, range 2–17), with the validity of NK instruments scoring a mean of 2·5 out of 5 points (range 0–5)Reference Spronk, Kullen and Burdon (34) . Castro et al. Reference Castro, Dattilo and Lopes (35) in 2010 defined cut-offs as low (0–6), moderate (7–10) and high (>10) in a Brazilian study. Present study knowledge score cut-offs based on tertiles of the scores are on a par with the above two studies.
In the present study, NK was found to be associated with education levels. A possible explanation is that educated individuals may also have health education and they may implement the same in their lifestylesReference Parameter, Waller and Wardle (8) . Other researchers have also observed a positive association between educational level and the NK questionnaire score, which clearly shows that education is critical for obtaining knowledge on nutrition( Reference Nicastro, Dattilo and Santos 36 , Reference Obayashi, Bianchi and Song 37 ).
Lower age groups showed significantly higher scores for NK compared with the higher age groups. The reason for such differences may be that younger people are more aware and vigilant about nutritional knowledge due to easy access to the Internet and other sources of information. However, greater levels of NK have typically been found in middle-aged as opposed to younger or older persons in an English studyReference Parameter, Waller and Wardle (8) .
Reports of associations between NK and dietary intakes and patterns are variable; while some studies showed a positive association, others did not. Our study indicates that NK is not the only determinant of dietary intake( Reference Roberts and Marvin 3 ). In the present study, regression analyses showed that frequent intakes of green leafy vegetables, sprouts and salads were positively associated with NK, indicating good agreement between knowledge and eating practice. The above association also reflects their good procedural knowledge as the individuals consumed healthier options (frequent intake of healthy food groups). Despite the positive association, however, there was a high prevalence of overweight and obesity and increased body fat percentage. This shows no conversion of declarative knowledge into practice, which further emphasizes the need for more focused lifestyle intervention programmes and training on declarative knowledge especially the diet and health outcome relationship.
Studies by Parmenter and WardleReference Parmenter and Wardle (21) and Roberts and MarvinReference Roberts and Marvin (3) assessed the link between NK and its practical application. The authors observed a correlation between knowledge and healthy eating habits. Eating lots of fruit and vegetables was most frequently cited as a component of a healthy diet. Obese adults were significantly less likely to consider their diet to be very healthyReference Roberts and Marvin (3) , showing adequate knowledge conversion into healthy eating. In contrast, O’Brien and Davies( Reference O’Brien and Davies 9 ) described that obese individuals achieved highest NK compared with normal-weight individuals. Thus, studies investigating a possible association of NK with anthropometric data show varying results and do not suggest a protective effect of NK on BMI. In the present study, NK was similar for normal- as well as overweight and obese individuals; however, a positive relationship was noticed between NK and body fat. Energy and fat intakes showed increasing trend across the NK groups. Market penetration by convenience foods, easy availability and affordability of packed foods, fortification, processed foods, cultural and religious beliefs possibly influence the dietary intakeReference Heaney, O’Connor and Michael (38) .
For PK, in the present study it was noted that mean score was 6·5 out of 10 points. In a Chinese study, the authors observed that PK scores ranged from 19·4 to 90·7 % with higher scores in the well-educated, elderly and normal-weight participants. Participants with higher education levels demonstrated a higher likelihood of performing sufficient (moderate- or high-level) physical activityReference Hui, Hui and Xie (17) . These findings are consistent with present study where the PK score was higher in participants with higher education level. The present study showed that overweight or obese participants and high fat individuals more often had good knowledge than normal-weight participants, indicating disagreement between knowledge and practice. Our regression model also showed a positive association between overweight and activity knowledge. Some previous studies have shown a lack of association between knowledge of physical activity and reported weekly duration of physical activity( Reference Dishman, Sallis and Orenstein 39 , Reference Knox, Baker and Davies 40 ) which is supported by the results of our study.
Based on the above findings, it was deduced that overweight/obese participants were not putting their nutritional knowledge into practice. However, it may also be possible that after attaining excessive weight, these adults acquired the knowledge of nutrition and it would take a while for this knowledge to be reflected in their BMI.
A limitation of the present study was estimates of dietary pattern using a single 24 h diet recall, although administered by a trained investigator with optimum precision. A 3 or 7 d diet record would have been better representative of the dietary habits. However, it was difficult to collect accurate diet data on multiple days due to time constraints and length of the questionnaires.
Conclusion
In conclusion, BMI, age, education and diet pattern (intakes of food groups) were important determinants of nutrition and physical activity knowledge. Knowledge of food choices (core facts on essential skills for selection of an appropriate diet), nutritional functions and recommendations on size and frequency of consumption must be the primary goals of nutritional education programmes throughout the life of individuals. Despite the study participants’ good level of knowledge on nutrition and the positive association of NK score and healthy food groups, nutritional knowledge was higher in high fat individuals; conversion of knowledge on physical activity into practice was observed. Thus, there is need for increased effort towards developing programmes focusing on transforming nutritional knowledge into practice.
Acknowledgements
Acknowledgements: The authors would like to thank the director of Hirabai Cowasji Jehangir Medical Research Institute, Jehangir Hospital and other staff for providing necessary facilities and help for this project. Financial support: The authors thank the Department of Science and Technology, Delhi, for funding this project under the Women Scientist Scheme (WOS-B, D.P.-A.). The funder had no role in the design, analysis or writing of this article. Conflict of interest: The authors declare no conflict of interest. Authorship: Each author has made a substantial contribution to the concepts, design, definition of intellectual content, literature search, data acquisition, data analysis, statistical analysis, manuscript preparation, manuscript editing and manuscript review. D.P.-A.: definition of intellectual content, literature search, data acquisition, data analysis, statistical analysis, manuscript preparation. A.K.: concepts, design, definition of intellectual content, manuscript preparation, manuscript editing, manuscript review. S.C.: concepts, design, definition of intellectual content, data analysis, statistical analysis, manuscript review. V.K.: definition of intellectual content and manuscript review. Ethics of human subject participation: The research protocol was approved by the ethics committee of Jehangir Clinic Development Centre (JCDC), Jehangir Hospital, Pune, India.


