


Ultra-processed foods (UPF) tend to be high in refined sugars, sodium and fats (saturated and trans)( Reference Ludwig 1 – Reference Moubarac, Batal and Louzada 5 ). Therefore, their consumption has been identified as one factor related to the obesity and chronic non-communicable diseases pandemic( Reference Monteiro, Levy and Claro 6 – Reference Mendonca, de, Pimenta and Gea 12 ). In order to study the role of industrial food processing in the nutritional transition, the NOVA food framework has been proposed as a new approach to classify all foods and beverages into four groups according to the nature, extent and purpose of their processing: (i) unprocessed or minimally processed foods; (ii) processed culinary ingredients; (iii) processed foods; and (iv) UPF( Reference Monteiro, Cannon and Levy 13 ). The NOVA food framework defines unprocessed or minimally processed foods as parts of plants or animals that have not undergone any industrial processing nor have they been altered in ways that add or introduce any substance, but may involve the removal of inedible or unwanted parts of the food( Reference Monteiro, Cannon and Levy 13 ). Processed culinary ingredients are substances extracted and purified by industry from food constituents or obtained from nature for the purpose of being used to prepare foods (e.g. salt, sugar and oils)( Reference Monteiro, Cannon and Levy 13 ). Processed foods are products manufactured by adding sugar, oil, salt and other culinary ingredients to minimally processed foods to make them more durable and usually more palatable( Reference Monteiro, Cannon and Levy 13 ). UPF are industrial formulations ready to be consumed, that are manufactured from five or even more ingredients commonly used in food processing industries such as substances derived from foods (e.g. oils, fats, sugar, casein, lactose, whey and gluten) or synthesized from other organic sources (e.g. hydrogenated or interesterified oils, soya protein isolate, maltodextrin, inverted sugar and high-fructose corn syrup), preservatives and additives (e.g. humectants, emulsifiers, solvents, bulking agents, non-sugar sweeteners, colourings and flavourings)( Reference Monteiro, Cannon and Levy 13 ).
Studies conducted with this new framework indicate that dietary patterns based on meals and dishes prepared from unprocessed or minimally processed foods and processed culinary ingredients have been replaced by those that are based on UPF( Reference Crovetto and Uauy 14 – Reference Juul and Hemmingsson 17 ). Factors driving this development are market deregulation( Reference De Vogli, Kouvonen and Gimeno 18 ), transnational food industries( Reference Monteiro and Cannon 19 ), fast-food chains( Reference Longacre, Drake and MacKenzie 20 ), marketing( Reference Mallarino, Gomez and Gonzalez-Zapata 21 ), urbanization, increased proportion of women employed outside the home and economic growth( Reference Monteiro, Moubarac and Cannon 22 ). Furthermore, this dietary change is no longer affecting high-income countries only, but middle- and low-income countries as well( Reference Monteiro, Moubarac and Cannon 22 , 23 ).
In the last decade, a growth rate of 29·2 % in the sale of UPF placed Mexico as the number one retailer of these products in Latin America, and the number four among eighty countries around the world( 23 ). Along with this increase, there was a parallel increase in the prevalence of high BMI in adults( 23 ). In Mexico, overweight and obesity are a serious public health problem. In 2012, the prevalence of overweight and obesity was 9·7 % among children <5 years of age, 34·4 % in school-aged children, 35·0 % in adolescents and 71·3 % in adults( Reference Gutiérrez, Rivera-Dommarco and Shamah-Levy 24 ).
The Pan American Health Organization has suggested that strategies focusing on reducing the consumption of UPF can contribute to the control and prevention of overweight and obesity( 25 ). To achieve this purpose, these strategies need to be relevant to the social context of the population. However, the main drivers involved in the consumption of UPF in Mexico are unknown. Therefore, our aim was to identify the energy contributions of the four NOVA food groups and the associations between sociodemographic characteristics and the energy contribution of UPF to total energy intake in the Mexican population.
Methods
Data source and study population
The data analysed in the present study came from the 2012 Mexican National Health and Nutrition Survey (ENSANUT 2012) conducted between October 2011 and May 2012. The ENSANUT 2012 is a probabilistic population-based survey with a complex multistage and stratified sampling process, representative at national, regional and state levels, and in urban and rural areas. A detailed description of the design strategy is available elsewhere( Reference Romero-Martínez, Shamah-Levy and Franco-Núñez 26 ). The survey was approved by the Research, Biosafety, and Ethics Committees of the National Public Health Institute in Cuernavaca, Mexico, and written informed consent was obtained from each participant before information was collected.
Dietary information was collected through a 24 h recall from a sub-sample of 10 886 participants (~11 % of the total ENSANUT 2012 sample). For the present study, we excluded pregnant and lactating women (n 154), children <1 year old (n 411) and breast-fed children ≥1 year old (n 107), as well as participants with incomplete sociodemographic information (n 4). Subsequently, we also excluded participants with extreme energy intakes (n 123), which were defined as those values below −3 sd and above +3 sd the median according to the ratio of daily energy intake to estimated energy requirements( Reference López-Olmedo, Carriquiry and Rodríguez-Ramírez 27 ). Thus, our final sample included 10 087 participants.
Dietary intake and food classification according to NOVA
Dietary intake was obtained by trained interviewers through a 24 h recall with a multiple-pass method and collected between Monday and Sunday in order to capture the intake variability between weekdays and weekends( Reference López-Olmedo, Carriquiry and Rodríguez-Ramírez 27 ). Respondents, particularly those younger than 15 years, were assisted by the person who cooked and prepared their meals in the household. Participants could report their intake from the previous day as: (i) individual foods; (ii) custom recipes (individual ingredients that make up the recipe as reported by participants); and (iii) standard recipes (sets of default ingredients that make up a recipe when the informer was not able to provide one). For the present analysis, food recipes were disaggregated into their ingredients.
We classified all foods and beverages reported in the 24 h recall into four groups according to NOVA food framework: (i) unprocessed or minimally processed foods; (ii) processed culinary ingredients; (iii) processed foods; or (iv) UPF( Reference Monteiro, Cannon and Levy 13 ). In each of the four NOVA food groups, we also classified foods into subgroups based on their nutritional and cultural characteristics. We calculated the total energy intake (mean consumption) and the energy contribution (percentage of total energy intake) from each NOVA food group and subgroup using the food composition database compiled by the Center for Nutrition and Health Research of the Mexican National Institute of Public Health, which is primarily based on the US Department of Agriculture Standard Reference database, product labels and standard recipes (unpublished results).
Sociodemographic characteristics
Information on sex, age, residence area, region, socio-economic status (SES) and head of household educational level was collected by a team responsible for the collection of health and household information in ENSANUT 2012, using a structured questionnaire( Reference Romero-Martínez, Shamah-Levy and Franco-Núñez 26 ). Age groups were classified as pre-school-aged children (1–4 years old), school-aged children (5–11 years old), adolescents (12–19 years old) and adults (≥20 years old). Residence area was defined as rural (locations with <2500 inhabitants) and urban (locations with ≥2500 inhabitants). Geographical regions were divided into: South (States of: Campeche, Chiapas, Guerrero, Hidalgo, Oaxaca, Puebla, Quintana Roo, Tabasco, Tlaxcala, Veracruz and Yucatán); Central (States of: Aguascalientes, Colima, Estado de México, Mexico City, Guanajuato, Jalisco, Michoacán, Morelos, Nayarit, Querétaro, San Luis Potosí, Sinaloa and Zacatecas); and North (States of: Baja California, Baja California Sur, Chihuahua, Coahuila, Durango, Nuevo León, Sonora and Tamaulipas). Based on a well-being condition index estimated by principal component analysis, which included household characteristics and basic goods and services (e.g. building materials of floor, walls and roof, availability of public sanitary sewer system, public water network connected to household, electricity, motor vehicle, television, computer, refrigerator, etc.), participants were classified into tertiles of SES as low, medium and high( Reference Vyas and Kumaranayake 28 ). Head of household educational level was classified according to the maximum degree of studies as without education, elementary education, middle school education, high school education and college graduate education.
Statistical analyses
We estimated the distribution of sociodemographic characteristics to describe the study population. For each participant, we estimated the energy contributions from the four NOVA food groups and their subgroups. Then, we estimated the mean energy contribution from the four NOVA food groups of the whole sample and stratified it by sociodemographic characteristics: sex, age group, residence area, region, SES and head of household educational level. To assess the association between the energy contribution of UPF and sociodemographic characteristics, we ran a multiple linear regression model with energy contribution of UPF as the dependent variable and sex, age group, residence area, region, SES and head of household educational level as the independent variables. In the case of educational level, we used head of household educational level because children and adolescents have not completed their education. For adults, we compared a model with head of the household educational level and a model with adult’s educational level and found a similar trend; hence, for consistency, we used head of household education in all participants. A P value<0·05 was considered significant. All analyses were performed with the statistical software package Stata version 12.0, using the survey prefix command (svy) for complex surveys.
Results
We analysed information from 10 087 participants who represent 111 276 088 Mexicans at the national level. Characteristics of the study population are presented in Table 1. In our sample, 50·5 % of the participants were females, 61·8 % were adults, 73·0 % lived in urban areas, 48·7 % were from the Central region of the country, 37·6 % had a high SES and 41·6 % lived in a household where the head of the family had a maximum educational level of elementary school.
Sociodemographic characteristics of the Mexican population (n 10 087), 2012 Mexican National Health and Nutrition Survey (ENSANUT 2012)
* Pre-school-aged children: aged <5 years; school-aged children: aged 5–11 years; adolescents: aged 12–19 years; adults: aged ≥20 years.
† Rural: <2500 inhabitants; urban: ≥2500 inhabitants.
‡ South states: Campeche, Chiapas, Guerrero, Hidalgo, Oaxaca, Puebla, Quintana Roo, Tabasco, Tlaxcala, Veracruz and Yucatán; Central states: Aguascalientes, Colima, Estado de México, Mexico City, Guanajuato, Jalisco, Michoacán, Morelos, Nayarit, Querétaro, San Luis Potosí, Sinaloa and Zacatecas; North states: Baja California, Baja California Sur, Chihuahua, Coahuila, Durango, Nuevo León, Sonora and Tamaulipas.
§ Tertiles of an index based on household characteristics and basic goods and services.
Table 2 presents the intakes (mean consumption and energy contribution) of the four NOVA food groups and their subgroups. The total energy distribution was 54·0 % from unprocessed or minimally processed foods, 10·2 % from processed culinary ingredients, 6·0 % from processed foods and 29·8 % from UPF. The top two subgroups in each NOVA group were corn tortillas and red meat (unprocessed or minimally processed foods), oils and fats, and sweeteners (processed culinary ingredients), bread and cheeses (processed foods) and cookies, pastries and sweet breads, and carbonated sugar-sweetened beverages (UPF).
Absolute and relative energy contributions from unprocessed or minimally processed foods, processed culinary ingredients, processed foods and ultra-processed foods in the Mexican population (n 10 087), 2012 Mexican National Health and Nutrition Survey (ENSANUT 2012)
To convert to kJ, multiply kcal value by 4·184.
* Nuts and seeds (unsalted), other legumes, dried herbs.
† Chicken and beef broth, Mexican mole sauce and condiments.
‡ Nuts and seeds (salted), salted, dried or oil-preserved canned fish and meat, canned fruits, vegetables and legumes.
§ Baby food, ready-to-eat-meals, ultra-processed culinary ingredients.
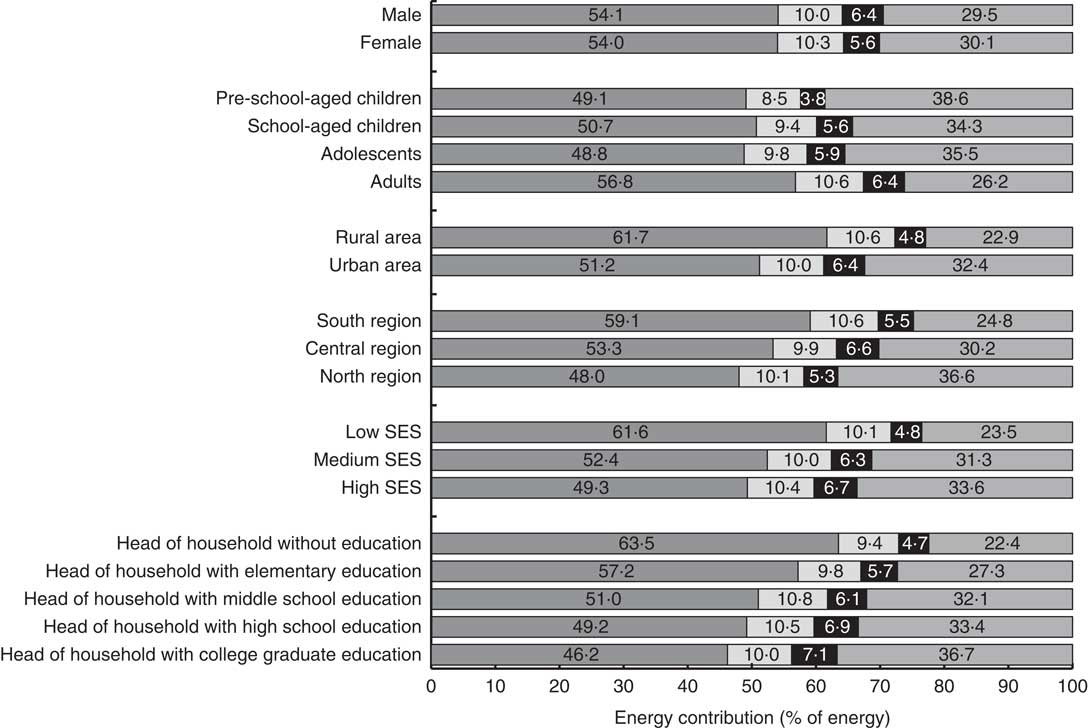
Table 3 presents the coefficients from the regression model, which can be interpreted as the differences in the energy contribution (percentage of total energy) from UPF (i.e. percentage points (pp) difference) between the reference and the other population groups. The energy contribution from UPF was 3·0 to 12·5 pp lower among older age groups compared with pre-school-aged children; 5·6 pp higher in urban compared with rural areas; 2·7 and 8·4 pp higher in the Central and North regions, respectively, compared with the South region; 4·5 pp higher in both medium and high SES compared with low SES; and 3·4 to 7·8 pp higher among those with a head of household with higher educational level compared with lower. As can be seen in Fig. 1, the differences in the energy contribution from UPF across sociodemographic groups were accompanied by differences in the energy contribution from unprocessed or minimally processed foods, whereas the energy contributions from processed culinary ingredients and processed foods remained relatively similar.
Energy contributions from unprocessed or minimally processed foods (![]() ), processed culinary ingredients (
), processed culinary ingredients (![]() ), processed foods (
), processed foods (![]() ) and ultra-processed foods (
) and ultra-processed foods (![]() ) by sex, age group*, residence area†, region‡, socio-economic status (SES)§ and head of household educational level in the Mexican population (n 10 087), 2012 Mexican National Health and Nutrition Survey (ENSANUT 2012). *Pre-school-aged children: aged <5 years; school-aged children: aged 5–11 years; adolescents: aged 12–19 years; adults: aged ≥20 years. †Rural: <2500 inhabitants; urban: ≥2500 inhabitants. ‡South states: Campeche, Chiapas, Guerrero, Hidalgo, Oaxaca, Puebla, Quintana Roo, Tabasco, Tlaxcala, Veracruz and Yucatán; Central states: Aguascalientes, Colima, Estado de México, Mexico City, Guanajuato, Jalisco, Michoacán, Morelos, Nayarit, Querétaro, San Luis Potosí, Sinaloa and Zacatecas; North states: Baja California, Baja California Sur, Chihuahua, Coahuila, Durango, Nuevo León, Sonora and Tamaulipas. §Tertiles of an index based on household characteristics and basic goods and services
) by sex, age group*, residence area†, region‡, socio-economic status (SES)§ and head of household educational level in the Mexican population (n 10 087), 2012 Mexican National Health and Nutrition Survey (ENSANUT 2012). *Pre-school-aged children: aged <5 years; school-aged children: aged 5–11 years; adolescents: aged 12–19 years; adults: aged ≥20 years. †Rural: <2500 inhabitants; urban: ≥2500 inhabitants. ‡South states: Campeche, Chiapas, Guerrero, Hidalgo, Oaxaca, Puebla, Quintana Roo, Tabasco, Tlaxcala, Veracruz and Yucatán; Central states: Aguascalientes, Colima, Estado de México, Mexico City, Guanajuato, Jalisco, Michoacán, Morelos, Nayarit, Querétaro, San Luis Potosí, Sinaloa and Zacatecas; North states: Baja California, Baja California Sur, Chihuahua, Coahuila, Durango, Nuevo León, Sonora and Tamaulipas. §Tertiles of an index based on household characteristics and basic goods and services
AssociationsFootnote * between the contribution of ultra-processed foods to total energy intake and sociodemographic characteristics in the Mexican population (n 10 087), 2012 Mexican National Health and Nutrition Survey (ENSANUT 2012)
* Performed with a multiple linear regression model that includes all variables in the table.
† Pre-school-aged children: aged <5 years; school-aged children: aged 5–11 years; adolescents: aged 12–19 years; adults: aged ≥20 years.
‡ Rural: <2500 inhabitants; urban: ≥2500 inhabitants.
§ South states: Campeche, Chiapas, Guerrero, Hidalgo, Oaxaca, Puebla, Quintana Roo, Tabasco, Tlaxcala, Veracruz and Yucatán; Central states: Aguascalientes, Colima, Estado de México, Mexico City, Guanajuato, Jalisco, Michoacán, Morelos, Nayarit, Querétaro, San Luis Potosí, Sinaloa and Zacatecas; North states: Baja California, Baja California Sur, Chihuahua, Coahuila, Durango, Nuevo León, Sonora and Tamaulipas.
║ Tertiles of an index based on household characteristics and basic goods and services.
Discussion
The present study is the first that identifies the energy contributions of the four NOVA food groups and the sociodemographic characteristics associated with UPF intake in a nationally representative sample of the Mexican population. In 2012, more than half of the energy intake of the Mexican population came from unprocessed or minimally processed foods and almost a third of the energy intake came from UPF. Many sociodemographic characteristics were associated with the energy contribution of UPF and the differences between sub-population groups were not only statistically significant but also considerable in magnitude (2·7 to 12·5 pp of difference). We found a higher energy contribution from UPF among pre-school-aged children (v. other age groups); in urban areas (v. rural areas); the North and Central regions of the country (v. the South); among those with higher SES; and in heads of household with a higher educational level.
Compared with other countries that have used 24 h recall, the energy contribution of UPF that we found in Mexico (29·8 % of energy) was higher than in Brazil (21·5 % of energy)( Reference Louzada, Martins and Canella 3 ); similar to Chile (28·6 % of energy)( Reference Cediel, Reyes and Louzada 29 ); but lower than in Canada (47·7 % of energy)( Reference Moubarac, Batal and Louzada 5 ) and the USA (57·9 % of energy)( Reference Martínez Steele, Baraldi and Louzada 4 ). Also, the energy contribution of UPF is higher in the UK (63·4 % of energy)( Reference Moubarac, Claro and Baraldi 30 ) than in Mexico. However, the latter study was conducted with household food expenditure data and is less comparable.
Our results on the association between UPF intake and sociodemographic characteristics were consistent with other previously reported findings. Studies in Brazil found a higher intake of UPF among individuals with a higher educational level( Reference Bielemann, Santos Motta and Minten 31 ), among children with mothers with high educational levels( Reference Sparrenberger, Friedrich and Schiffner 32 ) and among households with higher income( Reference Monteiro, Levy and Claro 6 ). Similarly, in Chile, the consumption of UPF tended to increase when the family’s income increased( Reference Crovetto, Uauy and Martins 2 ). However, in Canada the consumption of UPF was similar among income groups( Reference Moubarac, Martins and Claro 7 ). One possible explanation is that in Canada UPF might be a cheap source of energy compared with fresh or minimally processed foods; whereas in Latin American countries this might not be the case. Interestingly, in middle-income countries such as Brazil, UPF cost more compared with unprocessed or minimally processed foods( Reference Claro, Maia and Costa 33 ), whereas in high-income countries like the UK the price of UPF is lower( Reference Moubarac, Claro and Baraldi 30 ).
Furthermore, the targeting of many foods such as ready-to-eat cereals, baby foods, juices and dairy drinks to small children could explain the higher contribution of UPF in pre-school-aged children compared with other age groups.
In our results, unprocessed or minimally processed foods contributed more than half of the energy intake. An important portion of this food subgroup contribution comes from unpackaged corn tortillas (of the 54·0 % of energy that unprocessed or minimally processed foods contributed to energy intake, 19·0 % of energy was from corn tortillas). Unpackaged corn tortillas were classified as unprocessed or minimally processed foods; they are prepared at home or bought ready-to-consume (or re-heated and consumed) from tortillerías (small tortilla factories). In either case, these are prepared with corn and lime, or with corn flour. The ingredients of the main brands of corn flour only contain corn, lime and micronutrients. However, there are some brands of corn flour that also contain additives, and these belong to the UPF category. It was not possible to identify which brand of corn flour was used, therefore we classified all unpackaged corn tortillas in the unprocessed or minimally processed food group, as we believe this was the case for the majority, but this group might be overestimated. On the contrary, the majority of packaged corn tortillas, those that have a brand name and longer shelf-life, do contain ingredients from the UPF group and were classified accordingly (although their energy contribution is very small).
Although the mean energy contribution of UPF was 29·8 % of energy, the range of this intake in the Mexican population is wide. Based on our regression model, assuming 50·5 % of the population is female, a pre-school-aged child of high SES with a head of household with college graduate education, living in an urban area of the North has an energy contribution from UPF of 51·7 % of energy, whereas an adult of low SES with a head of household without education living in a rural area of the South has an energy contribution of 12·9 % of energy; a 38·8 pp difference between these two groups is found.
An important limitation of our analysis is that for some foods and beverages reported in the 24 h recall, the description is not detailed enough to correctly classify them into one of the four NOVA food groups. For example, cookies could be classified as unprocessed or minimally processed if they were made at home or as ultra-processed if they were packaged. Also, even among industrialized products, the classification could vary according to ingredients used in each brand and product; but we did not have that level of detail (e.g. for the item ‘industrialized tomato juice’ some brands only add salt and condiments, whereas other brands have additives and other ingredients that would classify them as UPF). The latter was the case for corn flour as explained above. In addition to the ambiguity for corn tortillas, an additional 5·2 % of the foods and beverages (which had a mean energy contribution of 12·5 % of energy) had ambiguous descriptions and could have been misclassified. Another limitation is that 24 h recalls, even if they are the best dietary collection method available to monitor the population’s diet, do not estimate individual usual intake. The inability to capture individual usual intake is irrelevant when estimating the population’s mean. However, when doing regression analysis, particularly when including many predictors, like in our study, this can become a bigger concern.
Despite these limitations, our study has several strengths as well. To our knowledge, it is the first study that uses the NOVA framework to classify food intake according to the nature, extent and purpose of processing in a representative sample of the Mexican population. We had individual-level information, as opposed to aggregated data( 23 ); therefore we were able to investigate the associations between the energy contribution of UPF and sociodemographic characteristics. Moreover, the dietary information was collected by 24 h recall using a multiple-pass method, which improves precision and reduces the degree of measurement error( Reference Steinfeldt, Anand and Murayi 34 ).
Conclusion
In summary, a third of Mexicans’ energy intake was composed by UPF in 2012. Furthermore, we found that sociodemographic characteristics are highly associated with the energy contribution from UPF intake. In Mexico, pre-school-aged children and individuals with high SES, who live in urban areas, in the North region of the country and in a household where the head of the family has a high educational level tend to have a higher energy contribution from UPF. Our study highlights the segments of the population that could benefit the most from public policies and programmes aimed at reducing the intake of UPF. Further research is needed to understand the impact of UPF intake on the dietary quality and health of the Mexican population.
Acknowledgements
Acknowledgements: The authors thank Lizbeth Tolentino for her advice on the food classification; Juan A. Rivera, Teresa Shamah and her team for designing and coordinating the dietary component of the ENSANUT 2012; and Carlos A. Monteiro for his advice on the manuscript and design of the analysis. Financial support: This work was supported by the National Institute of Public Health of Mexico; the Conselho Nacional de Desenvolvimento Científico e Tecnológico (grant number 443477/ 2014-0); the Fundação de Amparo à Pesquisa do Estado de São Paulo (grant number 2015/14900-9); and Bloomberg Philanthropies. J.A.M.-P. and T.G.S.-P. were supported by a scholarship from the CONACYT. None of the funding sources had a role in the design, analysis or writing of this article. Conflict of interest: None. Authorship: J.A.M.-P., T.G.S.-P., C.B. and M.L.C.L. classified and/or revised the food grouping classification; J.A.M.-P. conducted the analysis; J.A.M.-P., T.G.S.-P. and C.B. wrote the manuscript; M.L.C.L. revised the manuscript; J.A.M.-P. and C.B. had primary responsibility for final content. Ethics of human subject participation: All protocols, instruments and the process for obtaining informed consent for this study were approved by the Institutional Review Committees of the National Institute of Public Health, Mexico.


