

P is an essential mineral for animals, and it plays a critical role in nucleic acid synthesis and metabolism, energy metabolism, membrane integrity, lipid metabolism and bone mineralisation( Reference Berndt and Kumar 1 ). Chicks utilise about 60 % of the dietary P, and the remaining is excreted and may enter the environment leading to eutrophication of fresh water and environmental P pollution( Reference Liu, Li and Lu 2 – Reference Liu, Li and Lu 4 ). Therefore, a better understanding of intestinal P absorption in chicks will facilitate improving P utilisation and decreasing P excretion in the poultry industry. The P absorption in the small intestine includes transcellular and paracellular pathways( Reference Nakagawa and Ghishan 5 , Reference Bai, Collins and Ghishan 6 ). Paracellular P transport is dependent on passive diffusion, and active transport occurs through the sodium-dependent P co-transporters( Reference Hilfiker, Hattenhauer and Traebert 7 ). Transcellular permeation is the dominant mechanism for intestinal P absorption( Reference Nakagawa and Ghishan 5 , Reference Bai, Collins and Ghishan 6 , Reference Eto, Tomita and Hayashi 8 ) and involves three types of phosphate co-transporters( Reference Bai, Collins and Ghishan 6 ): type IIb Na-dependent phosphate co-transporter (NaPi-IIb); inorganic phosphate transporter 1 (PiT-1); and inorganic phosphate transporter 2 (PiT-2). The NaPi-IIb is primarily expressed in the duodenum of broilers and is considered to be the most important P transporter in their small intestine( Reference Yan, Angel and Ashwell 9 – Reference Liu, Hu and Liao 11 ). The PiT-1 and PiT-2 may play a potential role in intestinal P absorption in the mouse( Reference Bai, Collins and Ghishan 6 ) and rat( Reference Giral, Caldas and Sutherland 12 ); however, no information is available on the expression levels and physiological roles of PiT-1 and PiT-2 in the small intestine of broilers.
A previous study in broiler chickens has shown that dietary phytase supplementation significantly improved P absorption but has no effect on intestinal NaPi-IIb mRNA expression( Reference Olukosi, Kong and Fru-Nji 13 ). This suggests that NaPi-IIb might be not the only P transporter in the small intestine of broilers. The mechanisms underlying the response of P transporters to intestinal P absorption are therefore unclear. Dietary P deprivation is an important and effective regulator of intestinal P uptake and gene expression levels of NaPi-IIb ( Reference Fang, Xiang and Cao 14 , Reference Nie, Yang and Yuan 15 ). We hypothesise that PiT-1 and PiT-2 may be also expressed in the small intestine of broilers and play a role in the regulation of P absorption. Therefore, the objective of the current study was to test the above hypothesis by investigating the response of NaPi-IIb, PiT-1 and PiT-2 gene expression levels to different dietary non-phytate P (NPP) levels.
Methods
Animals, diets and experimental design
All experimental procedures were approved by the Animal Management Committee (in charge of animal welfare issue) of the Institute of Animal Sciences, Chinese Academy of Agricultural Sciences (IAS–CAAS), and performed in accordance with the guidelines. Ethical approval on animal survival was given by the animal ethics committee of IAS–CAAS. A total of 450 1-d-old commercial Arbor Acres male broilers were randomly divided into one of three treatment groups with ten replicate cages (15 chicks/cage) for each treatment in a completely randomised design. Broilers were housed in electrically heated, thermostatically controlled stainless steel cages (length 100 cm×width 50 cm×height 45 cm) equipped with fibreglass feeders and watering system and were maintained on a 24-h constant light schedule for 21 d. Birds were allowed ad libitum access to the experimental diets and tap water containing no detectable P. The experimental diets were formulated to meet or exceed the requirements of broilers (days 1 to 21) for all nutrients except for NPP (Table 1). One treatment group was fed the basal maize–soyabean meal diet with no inorganic P addition (containing 0·06 % NPP by analysis, control (C)), the second group was fed a diet with the required NPP content according to the recommendation of National Research Council( 16 ) (0·44 % NPP by analysis, normal (N)) and the third group was fed a diet containing half of National Research Council( 16 )-recommended NPP content (0·21 % NPP by analysis, moderate restriction (M)). All diets were fed in mash form, and the inorganic P in the feed was supplemented with CaHPO4.H2O. To eliminate the effect of dietary Ca on intestinal P absorption, all diets contained the same amount of Ca (1 %) by adjusting the supplementation of fine sand and limestone( Reference Liu, Liao and Lu 17 , Reference Jiang, Lu and Li 18 ). Bird weight and feed intake (FI) were measured and corrected for mortality to determine body weight gain (BWG), FI, feed conversion ratio (FCR) and mortality of each cage.
Ingredients and nutrient levels of diets for broilers from 1 to 21 d of ageFootnote *
C, control group; M, moderate restriction group; N, normal group.
* As-fed basis.
† Feed grade.
‡ Building sand was washed and then soaked overnight in 10 % nitric acid, and P content in the washed sand was too low to be detected. Sand was used to adjust amounts of CaHPO4.H2O and limestone in each treatment diet.
§ Provided per kg of diet: vitamin A (all-trans-retinyl acetate), 5·16 mg; cholecalciferol, 0·11 mg; vitamin E (all-rac-α-tocopheryl acetate), 16 mg; vitamin K (menadione sodium bisulfate), 3 mg; thiamin (thiamin mononitrate), 3 mg; riboflavin, 9·6 mg; vitamin B6, 3 mg; vitamin B12, 0·02 mg; calcium pantothenate, 15 mg; niacin, 39 mg; folic acid, 1·5 mg; biotin, 0·15 mg; choline (choline chloride), 700 mg; Cu (CuSO4.5H2O), 8 mg; Fe (FeSO4.7H2O) 80 mg; Mn (MnSO4.H2O), 110 mg; Zn (ZnSO4.7H2O), 60 mg; iodine (KI), 0·35 mg; and Se (Na2SeO3), 0·15 mg.
|| Determined values based on triplicate determinations.
¶ Crude protein contents were calculated as N (%, w/w)×6·25.
Sample collections and preparations
Diet samples from all experimental treatments were ground and passed through a 0·50-mm screen before analyses of crude protein, Ca, total P and phytate P. At 7, 14 or 21 d of age, three birds from each cage were selected according to average body weight within the cage after a 12-h fast. Birds were anaesthetised by intravenous injections of sodium pentobarbital (20 mg/kg of body weight) through a wing vein. Blood was collected from the hepatic portal vein and plasma was separated for P determination. The birds were then killed by cervical dislocation and the small intestine was exposed by a longitudinal abdominal incision. The duodenum (about 10 cm distal to the pylorus), jejunum (about 10 cm preceding the yolk stalk) and ileum (10 cm preceding the ileocaecal valve) were dissected out( Reference Bai, Lu and Wang 19 ) and mucosa was scraped with an ice-cold microscope slide and immediately frozen in liquid N2. After collection, the blood samples were stored at −20°C before P determination and the mucosa samples were transferred and stored at −80°C before the assays of NaPi-IIb, PiT-1 and PiT-2 mRNA and protein expression levels. The plasma and mucosa samples of the three individual broilers from the same cage were pooled before analyses.
Sample analyses
Dietary crude protein, calcium, total phosphorous and non-phytate phosphorous and plasma phosphorous
The crude protein in the diets was analysed using the Kjeldahl method( Reference Thiex, Manson and Anderson 20 ). Crude protein contents were calculated as N (%, w/w)×6·25. The Ca concentrations in the diets were determined by inductively coupled plasma spectroscopy (Thermal Jarrell Ash) after wet digestion with HNO3 and HClO4 ( Reference Liu, Liao and Lu 17 ). Total P concentrations in the diets and tap water were determined colorimetrically using the vanadate–molybdate method( Reference Liu, Liao and Lu 17 ). Validations of the Ca and total P analyses were conducted using bovine liver powder (GBW (E) 080193; National Institute of Standards and Technology) as a standard reference. The phytate P in the diets was determined using the ferric precipitation method( Reference Selle, Ravindran and Cadogan 21 ). Dietary NPP was calculated as the difference between total P and phytate P. The inorganic P concentration in plasma from hepatic portal vein blood was determined as described by Goldenberg & Fernandez( Reference Goldenberg and Fernandez 22 ).
RNA extraction, reverse transcription and real-time PCR
Total RNA in mucosa samples was extracted with Trizol reagent (catalogue no. 15596018; Life Technologies) according to the manufacturer’s instruction. The RNA concentration was determined by measuring UV light absorbance at 260 nm with a spectrophotometer (ND-2000; Gene Company Ltd) and the integrity of total RNA was checked using denatured RNA electrophoresis. A total of 1 µg of RNA was subjected to reverse transcription using a PrimeScript RT reagent kit with gDNA Eraser (catalogue no. RR047A; Takara Bio Inc.) according to the manufacturer’s protocol. Quantitative real-time PCR was conducted in triplicate on an ABI 7900 PCR system using Power SYBR Green Master Mix (catalogue no. 4367659; Life Technologies) according to the manufacturer’s instructions. The amplification reaction of PCR was performed as follows: 10 min at 95°C and forty cycles of 94°C for 15 s and 60°C for 1 min. The target genes and primers (Invitrogen) are shown in Table 2. The geometric mean of internal references, β-actin and glyceraldehyde-3-phosphate dehydrogenase (GAPDH), was used to normalise the expression of the targeted genes(
Reference Zhu, Lu and Li
23
,
Reference Zhang, Li and Liao
24
). Relative mRNA expression levels of target genes were calculated using the
 $$2^{{{\minus}\Delta \Delta C_{T} }} $$
method as previously described(
Reference Livak and Schmittgen
25
).
$$2^{{{\minus}\Delta \Delta C_{T} }} $$
method as previously described(
Reference Livak and Schmittgen
25
).
Primer sequences for real-time PCR amplification
PiT-1, inorganic phosphate transporter 1; PiT-2, inorganic phosphate transporter 2; NaPi-IIb, type IIb sodium-dependent phosphate co-transporter; GAPDH, glyceraldehyde-3-phosphate dehydrogenase; F, forward; R, reverse.
Tissue preparation and Western blotting
Frozen intestinal mucosal samples (40 mg) were homogenised in 0·5 ml of ice-cold Radio Immunoprecipitation Assay lysis buffer (catalogue no. P0013B; Beyotime Institute of Biotechnology) supplemented with a protease inhibitor cocktail (catalogue no. B14001; BioTool). After incubating on ice for 30 min, the homogenate was centrifuged at 10 000 g for 5 min at 4°C to harvest the supernatant. The total protein of supernatant was determined using a BCA Protein Assay kit (catalogue no. 23225; Pierce) before it was added to SDS-PAGE loading buffer (catalogue no. CW0027A; CWBio) and put into boiling water (100°C) for protein denaturation. The denatured proteins (20 μg) were separated by electrophoresis on a 10 % SDS-PAGE gel and transferred onto nitrocellulose membranes (catalogue no. IPVH00010; Merck Millipore). Thereafter, the membranes were blocked in blocking buffer with 5 % skimmed milk at room temperature for 1 h and then incubated overnight at 4°C with the following primary antibodies: NaPi-IIb (catalogue no. sc-160605; Santa Cruz Biotechnology), PiT-1 (catalogue no. sc-98814; Santa Cruz Biotechnology), PiT-2 (catalogue no. bs-8610R; Bioss Biotechnology) and GAPDH (catalogue no. HX1828; Huaxingbio). After four washes for 10 min each with TRIS-buffered saline with Tween, the membranes were incubated with horseradish peroxidase-conjugated secondary antibodies (1:5000) for 1 h at room temperature. After four washes for 10 min each, membranes were visualised and signals were recorded with an Image Quant LAS 4000 scanner (GE Healthcare Life Sciences) by enhanced chemiluminescence using a Super Signal West Pico Trail Kit (catalogue no. 34077; Pierce). Band density was analysed using TotalLab Quant software (Total Lab). Data were presented as the ratio of NaPi-IIb, PiT-1 and PiT-2 band intensity: GAPDH protein( Reference Liu, Hu and Liao 11 , Reference Zhang, Li and Liao 24 ), and the average protein expression of the C group was used as a calibrator( Reference Zhu, Lu and Li 23 ).
Statistical analyses
The sample size calculation was performed using software PASS 13 (NCSS, LLC). In our previous study( Reference Liu, Liao and Lu 17 ), the means of duodenal NaPi-IIb mRNA expression levels for moderately restricted and normal NPP level treatments were 2·32 and 1·03 with a pooled sd of 0·63. On the basis of the same effect size, five replicates per treatment are needed to achieve 80 % power using a two-sided two-sample t test at a significance level of 0·05. Our proposed sample size of ten replicates per treatment may provide more power when considering multiple comparisons( Reference Chow, Wang and Shao 26 ). Data from BWG, FI, FCR, mortality, plasma P concentration and protein expression levels of NaPi-IIb, PiT-1 and PiT-2 were analysed by one-way ANOVA using the GLM of SAS (v. 9.2; SAS Institute Inc.) with dietary NPP as the fixed effect. Data from mRNA expression levels of NaPi-IIb, PiT-1 and PiT-2 were analysed by two-way ANOVA using the GLM of SAS with dietary NPP, intestinal segments and their interaction as the fixed effects. Main effects were not analysed separately if the interaction was significant. Comparisons of NaPi-IIb, PiT-1 and PiT-2 protein distributions in different intestinal segments were not made, because the protein expression assays in different intestinal segments could not be replicated within one plate. Owing to the high mortality of birds in the C group caused by NPP deprivation, the number of surviving birds were not equal between replicate cages at 21 d of age, and the replicate cage (containing 3–9 birds) served as the experimental unit to determine the overall growth performance from 1 to 21 d of age. The replicate cage of three birds used for sample collections served as the experimental unit to determine the remaining indices at 7, 14 and 21 d of age. Data collected at 7, 14 and 21 d of age were analysed independently. Data from mortality of broilers were transformed using arcsin before statistical analysis. Differences among means were tested by the least significant difference, and statistical significance was set at P<0·05.
Results
Growth performance from 1 to 21 d of age
Dietary NPP level affected (P<0·0001) the BWG and overall FI, the mortality and FCR from 1 to 21 d of age (Table 3). With the increase of dietary NPP, the BWG and FI increased and the FCR decreased. In addition, the mortalities were lower (P<0·0001) in the M and N groups than in the C group, with no difference (P=0·68) between the M and N groups.
Effect of dietary non-phytate phosphorous (NPP) on body weight gain (BWG), feed intake (FI), feed conversion ratio (F:G, FCR) and mortality of broilers from 1 to 21 d of ageFootnote *
C, control group; M, moderate restriction group; N, normal group.
a,b,c Mean values within the same column with unlike superscript letters were significantly different (P<0·05).
* Each value represents the mean of ten replicates (n 10).
Inorganic phosphorous concentration in plasma from hepatic portal vein blood at 7, 14 and 21 d of age
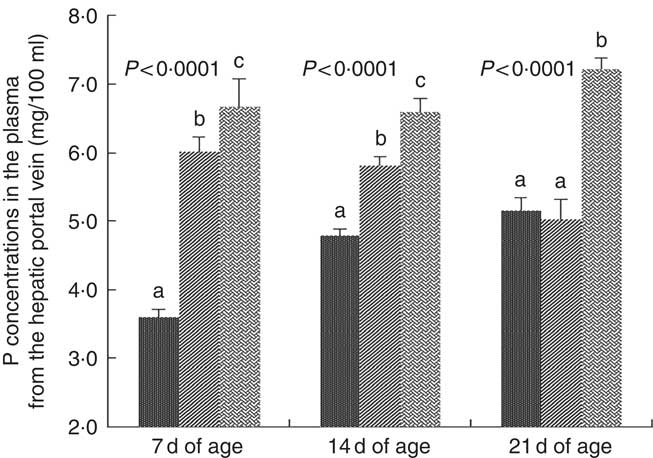
Inorganic P concentrations in plasma from the hepatic portal vein were affected (P<0·0001) by dietary NPP at 7, 14 and 21 d of age (Fig. 1). At 7 and 14 d of age, the concentration of inorganic P in plasma from the hepatic portal vein increased (P<0·05) with an increase in dietary NPP. At 21 d of age, the plasma P concentrations were significantly lower (P<0·0001) in the C and M groups than in the N group, but there were no significant differences (P=0·60) between the C and M groups.
Effect of dietary non-phytate phosphorous (NPP) on phosphorous contents in plasma from the hepatic portal vein at 7, 14 and 21 d of age. Values are means (n 10), with their standard errors represented by vertical bars. a,b,c Mean values with unlike letters between different dietary NPP levels at the same age were significantly different (P<0·05). ![]() , Control group (0·06% NPP);
, Control group (0·06% NPP); ![]() , moderate restriction group (0·21% NPP);
, moderate restriction group (0·21% NPP); ![]() , normal group (0·44% NPP).
, normal group (0·44% NPP).
Type IIb sodium-dependent phosphate co-transporter, inorganic phosphate transporter 1 and inorganic phosphate transporter 2 mRNA levels in different small intestinal segments of broilers at 7, 14 and 21 d of age
The results of NaP-IIb, PiT-1 and PiT-2 RNA levels are listed in Table 4. At 7 d of age, NaP-IIb mRNA expression was significantly different among intestinal segments (P<0·0001), but was not influenced by dietary NPP (P=0·28). The interaction between intestinal segment and dietary NPP was not significant (P=0·63). At 14 d of age, NaPi-IIb mRNA level was affected by dietary NPP (P<0·0001) and intestinal segments (P<0·0001), but the interaction between NPP and intestinal segment was not significant (P=0·16). The NaP-IIb mRNA level was higher (P=0·01) in C and M groups than in the N group, with no difference (P>0·05) between the C and M groups. At 21 d of age, there was a significant interaction between dietary NPP and intestinal segment on the NaP-IIb mRNA level (P<0·0001). In the duodenum, the NaP-IIb mRNA level was higher (P<0·0001) in the C group compared with that in the M and N groups and higher (P<0·0001) in the M group compared with that in the N group. In the jejunum, the NaP-IIb mRNA level was higher (P=0·02) in the C group than in the N group, but there was no difference between C and M (P=0·32) or N and M (P=0·13) groups. In the ileum, there was no difference (P>0·31) between C, M and N groups. On days 7 and 14, the highest NaPi-IIb mRNA level was found in the duodenum and the least was found in the ileum (P<0·0001).
Effect of dietary non-phytate phosphorous (NPP) on type IIb sodium-dependent phosphate co-transporter (NaPi-IIb), inorganic phosphate transporter 1 (PiT-1) and inorganic phosphate transporter 2 (PiT-2) mRNA expression levels in the small intestine of broilers at 7, 14 and 21 d of age (relative quantity (RQ))Footnote *
C, control group; M, moderate restriction group; N, normal group.
a,b,c,d,e,f Mean values within the same column with different superscript letters were significantly different (P<0·05).
A,B,C Mean values within the same column with different superscript letters were significantly different (P<0·05).
* Data are presented in the RQ as the ratio of target mRNA abundance:geometric mean of β-actin and glyceraldehyde-3-phosphate dehydrogenase mRNA abundances.
† Each value represents the mean of ten replicates (n 10).
‡ Each value represents the mean of thirty replicates (n 30).
On day 7, there was a significant interaction between dietary NPP and intestinal segment on the PiT-1 mRNA level (P=0·04). In the jejunum, the PiT-1 mRNA level in C group was higher (P<0·004) than that in M and N groups, with no difference (P=0·18) between M and N groups. In the duodenum or ileum, there was no difference (P>0·08) between the three groups. At 14 d of age, the PiT-1 mRNA level was affected by dietary NPP (P=0·02) and intestinal segments (P<0·0001) but not the interaction between the two (P=0·38). The PiT-1 mRNA levels in the C and M groups were higher (P<0·02) than that in the N group, with no difference (P=0·97) between C and M groups. At 21 d of age, the PiT-1 mRNA level was only affected by intestinal segments (P<0·0001), and neither dietary NPP (P=0·26) nor their interaction (P=0·33) had influence on PiT-1 mRNA expression. The highest PiT-1 mRNA level was found in the ileum and the least in the jejunum at 14 and 21 d of age.
At all times, the PiT-2 mRNA expression was affected by dietary NPP (P<0·004) and intestinal segment (P<0·007) but not by the interaction (P>0·12). At all time points, the C group always had lower (P<0·04) PiT-2 mRNA expression compared with the M and N groups, but there were no differences (P>0·18) between M and N groups. The highest PiT-2 mRNA was found in the ileum at 7 d of age, in the duodenum at 14 d of age and in the jejunum and ileum at 21 d of age.
Type IIb sodium-dependent phosphate co-transporter, inorganic phosphate transporter 1 and inorganic phosphate transporter 2 protein expression levels in different small intestinal segments of broilers at 7, 14 and 21 d of age
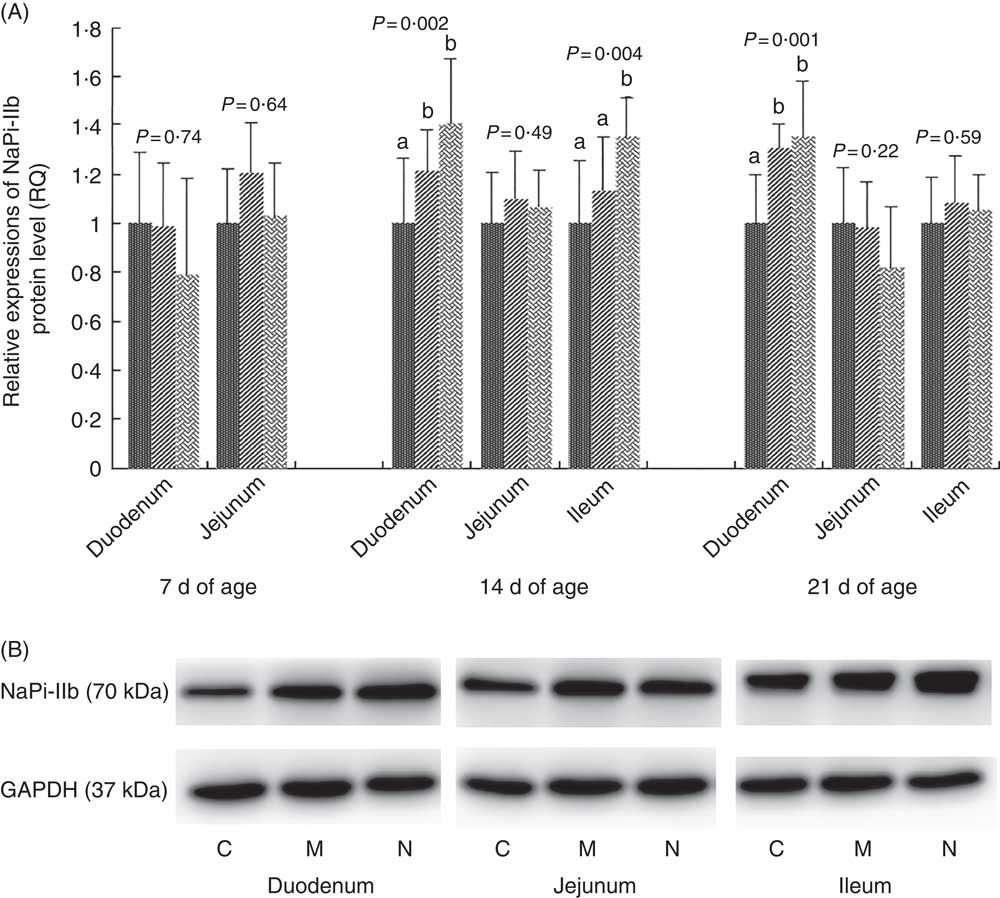
The results and representative immunoblots of NaPi-IIb protein expression levels are shown in Fig. 2. The NaPi-IIb protein level was affected by dietary NPP in the duodenum at days 14 and 21 (P<0·003) and in the ileum at day 14 (P=0·004). NaPi-IIb protein expression of the C group was lower (P<0·05) than that in the N and M groups in the duodenum at 14 and 21 d of age, with no difference (P>0·08) between N and M groups. In the ileum at 14 d of age, NaPi-IIb protein expression of the C and M groups was lower (P<0·03) than that of the N group, but there was no difference between C and M (P=0·18) groups. Dietary NPP did not affect the NaPi-IIb protein expression in the duodenum and jejunum at 7 d of age (P>0·64) or in the jejunum at 14 d of age (P=0·49), nor in the jejunum and ileum at 21 d of age (P>0·22). The NaPi-IIb protein level in the ileum at day 7 was too low to be detected.
Effect of dietary non-phytate phosphorous (NPP) on type IIb sodium-dependent phosphate co-transporter (NaPi-IIb) protein levels in small intestinal segments of broilers at 7, 14 and 21 d of age (A) and representative immunoblots that were used to detect NaPi-IIb protein expressions (B). Data are presented as relative NaPi-IIb band intensity normalised to glyceraldehyde-3-phosphate dehydrogenase (GAPDH) band intensity. Values are means (n 10), with their standard errors represented by vertical bars. a,b Mean values with unlike letters between different dietary NPP levels in the same intestinal segments at the same age were significantly different (P<0·05). RQ, relative quantity; ![]() , control group (0·06% NPP, C);
, control group (0·06% NPP, C); ![]() , moderate restriction group (0·21% NPP, M);
, moderate restriction group (0·21% NPP, M); ![]() , normal group (0·44% NPP, N).
, normal group (0·44% NPP, N).
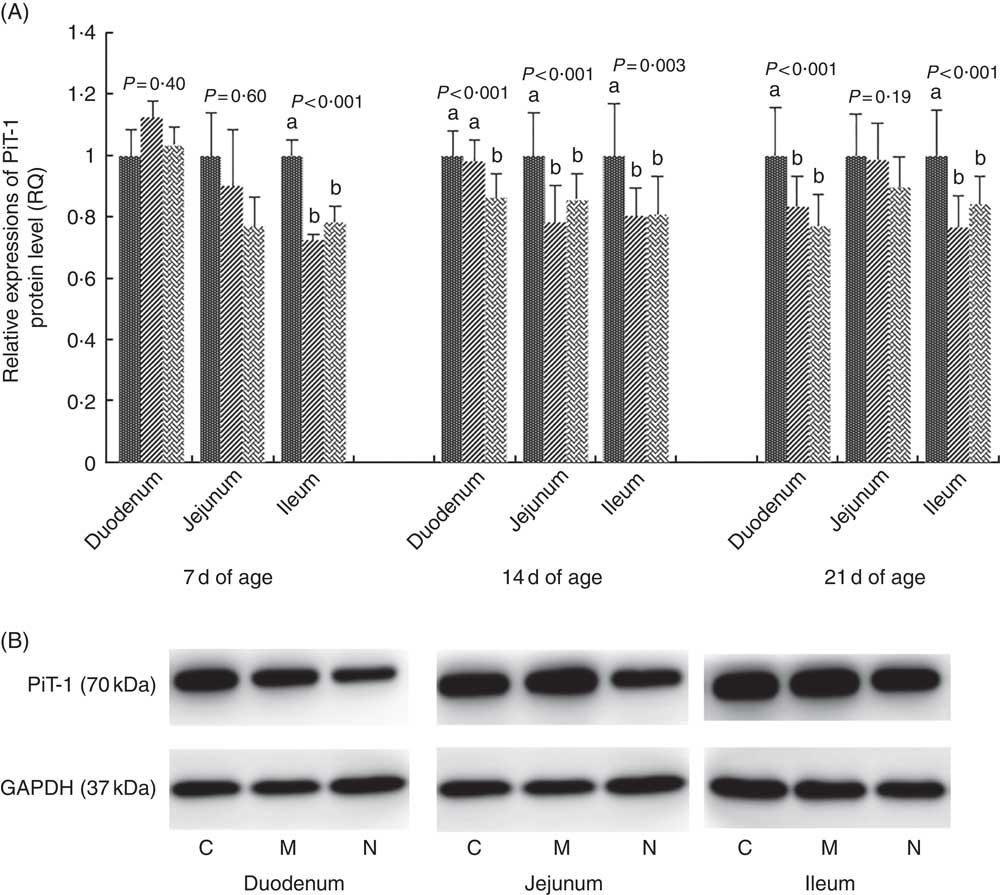
The results and representative immunoblots of PiT-1 protein expression levels are shown in Fig. 3. The protein expression of PiT-1 was affected by dietary NPP in all intestinal segments at all time points (P<0·003), except in the duodenum at 7 d of age (P=0·40) and in the jejunum at 7 and 21 d of age (P>0·19). Compared with the C group, the PiT-1 protein expression was lower in M and N groups in the jejunum at day 14 (P<0·01) and in the ileum at all time points (P<0·005), but there was no difference (P>0·14) between M and N groups. In the duodenum at day 14, PiT-1 protein expression of C and M groups was higher compared with that in the N group (P<0·02), but there was no difference between C and M groups (P=0·38).
Effect of dietary non-phytate phosphorous (NPP) on inorganic phosphate transporter 1 (PiT-1) protein levels in small intestinal segments of broilers at 7, 14 and 21 d of age (A) and representative immunoblots that were used to detect PiT-1 protein expressions (B). Data are presented as relative PiT-1 band intensity normalised to glyceraldehyde-3-phosphate dehydrogenase (GAPDH) band intensity. Values are means (n 10), with their standard errors represented by vertical bars. a,b Mean values with unlike letters between different dietary NPP levels in the same intestinal segments at the same age were significantly different (P<0.05). RQ, relative quantity; ![]() , control group (0·06% NPP, C);
, control group (0·06% NPP, C); ![]() , moderate restriction group (0·21% NPP, M);
, moderate restriction group (0·21% NPP, M); ![]() , normal group (0·44% NPP, N).
, normal group (0·44% NPP, N).
The results and representative immunoblots of PiT-2 protein expression levels are given in Fig. 4. Dietary NPP level influenced (P<0·04) PiT-2 protein expression levels in the duodenum at days 14 and 21, but not (P>0·06) in the duodenum at day 7 or in the jejunum or ileum at any time points. In the duodenum at day 14, the PiT-2 protein expression in the N group was higher (P<0·0001) than in the C and M groups, with no difference (P=0·93) between the C and M groups; however, at day 21 it was higher (P=0·01) in the N group than in the C group, with no differences (P>0·11) between the C and M groups or between the M and N groups.
Effect of dietary non-phytate phosphorous (NPP) on inorganic phosphate transporter 2 (PiT-2) protein levels in small intestinal segments of broilers at 7, 14 and 21 d of age (A) and representative immunoblots that were used to detect PiT-2 protein expressions (B). Data are presented as relative PiT-2 band intensity normalised to glyceraldehyde-3-phosphate dehydrogenase (GAPDH) band intensity. Values are means (n 10), with their standard errors represented by vertical bars. a,b Mean values with unlike letters between different dietary NPP levels in the same intestinal segments at the same age were significantly different (P<0.05). RQ, relative quantity; ![]() , control group (0.06% NPP, C);
, control group (0.06% NPP, C); ![]() , moderate restriction group (0.21% NPP, M);
, moderate restriction group (0.21% NPP, M); ![]() , normal group (0.44% NPP).
, normal group (0.44% NPP).

Discussion
The hypothesis that NaPi-IIb is not the only P transporter in the small intestine and that PiT-1 and PiT-2 are also expressed and may play a role in the regulation of P absorption in broilers is supported by the results of this experiment. The Na-dependent phosphate transport mechanism plays a major role in P absorption in the intestine of animals( Reference Nakagawa and Ghishan 5 , Reference Eto, Tomita and Hayashi 8 , Reference Murer and Burckhardt 27 ). However, increasing dietary NPP also promoted PiT-2 mRNA and protein expression and inhibited PiT-1 mRNA and protein expression. It may be that PiT-1 was more sensitive to P accumulation and acting as P sensor with down-regulated mRNA and protein expression levels to prevent potentially toxic accumulation of P in the mucosa. This is speculative, and mechanisms underlying P sensing need further research. In mammals, PiT-1 and PiT-2 are widely expressed in the kidney, brain, heart, liver, muscle and bone marrow, and their amino acid sequences are approximately 59 % identical( Reference Kavanaugh and Kabat 28 ). Recent studies have also shown that PiT-1 and PiT-2 might have normal cellular functions as phosphate transporters in the rat( Reference Kavanaugh, Miller and Zhang 29 – Reference Tatsumi, Segawa and Morita 31 ), rabbit and hamster( Reference Boyer, Baines and Beaulieu 32 ). Compared with PiT-2, PiT-1 seems to be more sensitive to extracellular P concentration and serves as an extracellular P-sensing protein in the cell surface of parathyroid gland in response to the circulating 1,25-(OH)2 vitamin D3 and dietary P level in rat( Reference Tatsumi, Segawa and Morita 31 ). Studies with the rat fibroblast cells showed that PiT-1 mRNA expression was up-regulated under P deprivation and down-regulated when the cell was transfected with PiT-2, suggesting that PiT-1 would be more sensitive to cell P status, which regulates its mRNA expression to achieve P homoeostasis( Reference Kavanaugh and Kabat 28 ).
The NaPi-IIb is the most extensively studied Na-dependent P transporter in terms of function( Reference Kaneko, Segawa and Furutani 33 ), structure( Reference Yan, Angel and Ashwell 9 ) and regulation( Reference Stauber, Radanovic and Stange 34 – Reference Berner, Kinne and Murer 36 ), and is considered to be responsible for most of the active P absorption in the small intestine( Reference Xu, Bai and Collins 37 ). Numerous studies have been carried out to investigate the effect of dietary NPP restriction on NaPi-IIb mRNA expression levels in broilers( Reference Li, Yuan and Guo 10 , Reference Yan and Waldroup 38 , Reference Han, Yang and Zhang 39 ), and results have shown that relatively lower NPP diets promote NaPi-IIb mRNA expression. Therefore, the efficiency of intestinal P absorption is higher when dietary NPP level is limiting( Reference Saddoris, Fleet and Radcliffe 40 ). These reports are in agreement with the results of the current study but appear inconsistent with the positive relationship between dietary NPP level and P concentrations in plasma from the hepatic portal vein. Previous studies in goats( Reference Huber, Walter and Schröder 41 ), pigs( Reference Saddoris, Fleet and Radcliffe 40 ) and mice( Reference Hattenhauer, Traebert and Murer 42 ) have shown that NaPi-IIb gene expression was mediated through post-transcriptional processes. In the current study, compared with the C group, the birds in the N group had lower NaPi-IIb mRNA levels, but higher plasma P concentrations and NaPi-IIb protein levels. This indicates that transcriptional processes may regulate NaPi-IIb protein expression in broilers, too. The higher NPP diet promoted intestinal P absorption and increased plasma P concentration by increasing NaPi-IIb protein expression and possibly reducing its protein turnover to inhibit NaPi-IIb mRNA expression. Studies in rats( Reference Giral, Caldas and Sutherland 12 ) and chicks( Reference Fang, Xiang and Cao 14 ) demonstrated that both the abundance and activity of NaPi-IIb increased when animals were switched from a low-P diet to a higher-P diet, further indicating that a higher NPP diet promoted intestinal P absorption by increasing NaPi-IIb protein expression.
The NaPi-IIb mRNA was reported to be exclusively expressed in the small intestine of broilers, with the highest expression in the duodenum, followed by the jejunum, and was almost negligible in the ileum( Reference Yan, Angel and Ashwell 9 ). A previous study( Reference Liu, Hu and Liao 11 ) in our laboratory with ligated intestinal loops of broilers has shown that the duodenum is the main site of P absorption, and P absorption in the duodenum occurred mainly by a saturated carrier-mediated process and in the ileum or jejunum occurred with a non-saturated diffusion process. These reports are in accordance with our results, and the NaPi-IIb seems to be the main transporter responsible for most of the active P translocation. However, the relative importance of NaPi-IIb, PiT-1 and PiT-2 in different small intestinal segments is not totally dependent on their gene expression levels, as the affinity of these transporters for P is highly dependent on luminal pH, which determines the distribution of H2PO4 1−/HPO4 2− ( Reference Forster, Hernando and Biber 43 ). The preferable P form for NaPi-IIb is HPO4 2−, whereas for PiT-1 and PiT-2 it is H2PO4 1− ( Reference Forster, Hernando and Biber 43 ), and thus the different pH in the duodenum, jejunum and ileum may be another important factor to regulate the amount of P absorbed through these transporters. Therefore, the relative importance of these transporters in different small intestinal segments may be different, depending on their gene expression levels, P concentrations, luminal pH and so on. In addition, the mechanisms underlying the different gene expression levels of PiT-1 and PiT-2 at the three ages remain unknown.
As reported in other studies( Reference Liu, Liao and Lu 17 , Reference Jiang, Lu and Li 18 ), low NPP is associated with a much higher mortality and lower BW and FI. This confirms that P is essential for animal health and that the broilers in the C group were under physiological stress from P deficiency. Other studies in chicks have shown that serum P increased proportionately with increasing dietary NPP levels( Reference Keshavarz 44 , Reference Rao, Reddy and Reddy 45 ). These reports agree with our findings and indicate that intestinal P absorptions are not the same when chicks are fed diets containing different concentrations of NPP. However, the effects of different FI between the three groups on intestinal P absorption and gene expression levels of NaPi-IIb, PiT-1 and PiT-2 are unclear and need further research.
In summary, our findings from the present study indicate that PiT-1 and PiT-2 are expressed in the small intestine of broilers, and regulate intestinal P absorption. NaPi-IIb, PiT-1 and PiT-2 may be important transporters responsible for P absorption in the small intestine, but PiT-2 is likely to be involved in active P translocation, whereas the PiT-1 may be more sensitive to P accumulation and contribute to the regulation of intestinal P absorption. Higher intestinal P absorption may be achieved by up-regulating the protein expression levels of NaPi-IIb and PiT-2 and down-regulating the protein expression of PiT-1. The results from the present study also suggest that NaPi-IIb protein expression might be mediated by a post-transcriptional process. These findings provide a novel insight into P absorption and its mechanisms in the small intestine of broilers, and will contribute to progress in modulating P absorption and decreasing P excretions of poultry in the future.
Acknowledgements
The authors highly appreciate Dr David Masters in the University of Western Australia for assisting with the English editing of this manuscript. In addition, the authors thank Dr Jie Wen for his generous and valuable assistance in the RT-qPCR assays of samples.
This work was supported by the National Natural Science Foundation of China (project no. 31472116; Beijing, P. R. China), the Key Program of the National Natural Science Foundation of China (project no. 31630073; Beijing, P. R. China), the National Key R&D Program of China (project no. 2017YFD0502200; Beijing, P. R. China), the Agricultural Science and Technology Innovation Program (ASTIP-IAS08; Beijing, P. R. China) and the China Agriculture Research System (project no. CARS-41; Beijing, P. R. China).
The authors’ contributions are as follows: X. L. designed the experiment and was responsible for all issues related to this paper. Y. H., Q. W. and L. Z. conducted the research and analysed the samples. Y. H. and X. L. drafted the paper, and L. L. participated in paper writing and editing. All authors have read the paper and agreed with the final content.
The authors declare that there are no conflicts of interest.


