



Dietary trans-fatty acids (TFA) are strongly associated with adverse cardiovascular effects, even at low levels of intake(Reference Mozaffarian, Katan and Ascherio1–Reference Ganguly and Pierce3). Naturally occurring TFA produced by the action of bacteria in the stomach of ruminants (rTFA)(Reference Mozaffarian, Katan and Ascherio1,Reference Stender, Astrup and Dyerberg4) have reported minimal health risks(Reference de Souza, Mente and Maroleanu2,Reference Jakobsen, Overvad and Dyerberg5,Reference Gebauer, Chardigny and Jakobsen6) , although more recent publications(Reference Stender7,Reference Gebauer, Destaillats and Dionisi8) conflict with previous findings, contributing to a lack of consensus among experts on the effect of rTFA on health. In contrast, health effects of industrially produced TFA (iTFA) are well established(Reference Stender7,Reference Gebauer, Destaillats and Dionisi8) . iTFA are produced by incorporating H2 under high pressure and temperatures into the double bonds of unsaturated fatty acids(Reference L’Abbé, Stender and Skeaff9,Reference Hernandez and Kamal-Eldin10) . These oils, commonly known as partially hydrogenated oils (PHO), are the main source of TFA in packaged foods(Reference Ganguly and Pierce3,11) .
Initiatives at reducing TFA in foods began in the early 2000s when the Danish Government limited the use of iTFA to 2 % of total fats, in conjunction with mandatory TFA labelling in the Nutrition Facts(12). In 2009, the World Health Organization (WHO) Scientific Review on TFA recommended that TFA should be greatly limited or eliminated from the food supply(Reference Uauy, Aro and Clarke13), due to their known associations with increased risk of CVD(Reference Mozaffarian, Katan and Ascherio1–Reference Ganguly and Pierce3,Reference Mozaffarian, Aro and Willett14) . Many countries have now taken diverse actions to reduce the content of TFA in foods, including labelling (voluntary or mandatory)(11,15–28) and/or limiting the addition of iTFA in foods(Reference L’Abbé, Stender and Skeaff9,11,12,15,29–51) (Fig. 1; detailed information in online Supplemental Table 1). For instance, some Latin American countries introduced similar interventions, which already have shown promising results(Reference Monge-Rojas, Colón-Ramos and Jacoby17). In the USA, the Food and Drug Administration determined in 2015 that PHO were no longer generally recognised as safe and therefore prohibiting their use in foods(45). In 2018, the WHO launched the REPLACE programme, which is an action package and guide aimed at eliminating TFA globally by 2023(52), released draft guidelines showing health benefits of TFA intakes <1 % of energy(53) and recently reported worldwide progress(54). The European Commission also limited TFA in foods by 2021(55). Four recent systematic reviews have consistently shown that limiting the use of iTFA (i.e. PHO) was the most effective strategy aiming at reducing TFA in foods, while TFA labelling on foods has shown a more limited effectiveness(Reference Downs, Thow and Leeder56–Reference Downs, Bloem and Zheng59).
Evolution of interventions aimed at eliminating trans-fatty acids in foods worldwide. Open figure denotes the intervention has passed; full filled figure denotes the intervention is in force
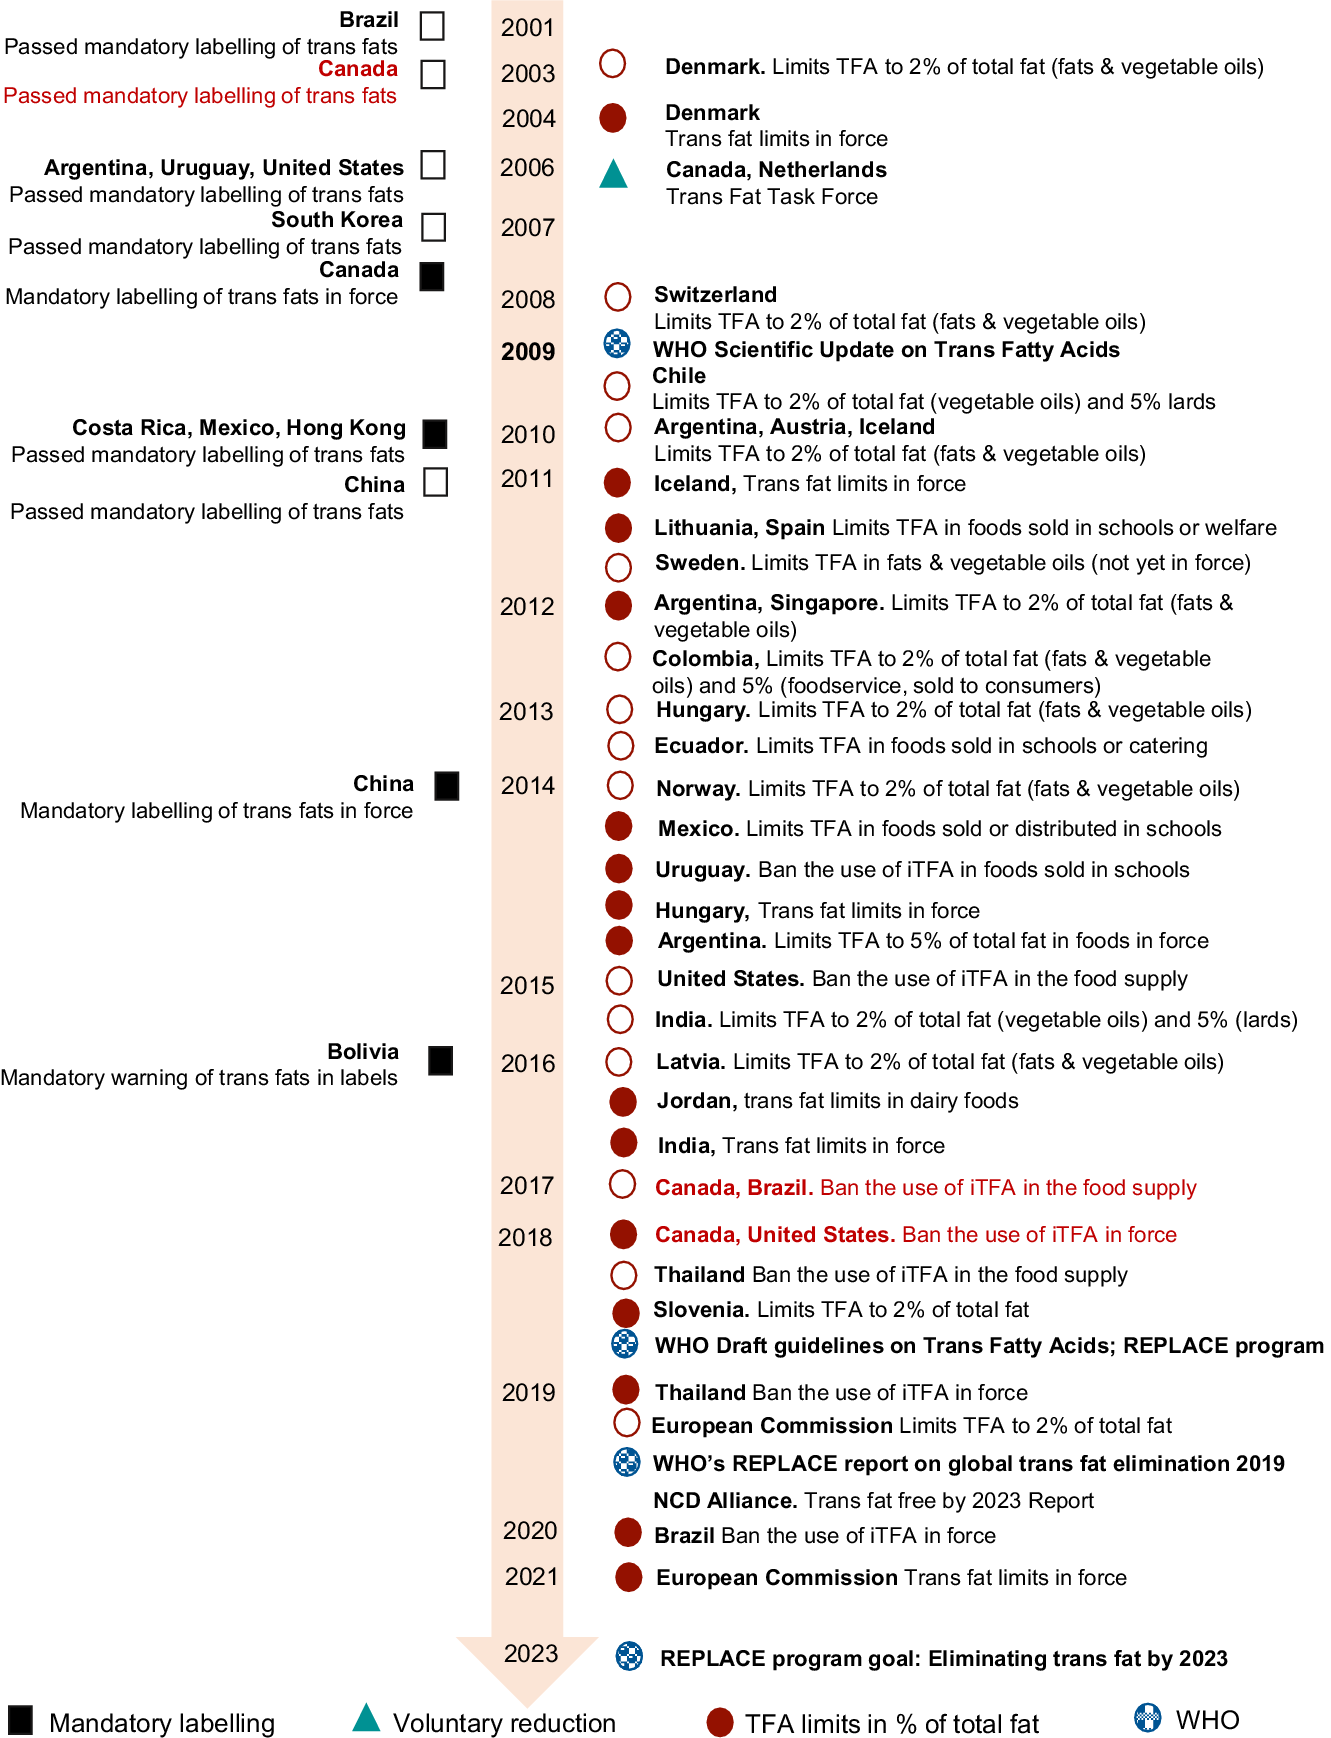
Earlier research in the mid-1990s highlighted that TFA intakes in Canada were among the highest intakes worldwide(Reference Ratnayake and Chen60), which led to: (1) mandatory declaration of TFA on the Nutrition Facts table (NFt) in packaged foods and beverages, even if the TFA amount is negligible(19); (2) the development of voluntary limits on the TFA content in foods, established at <2 % of total fat content for fats and oils, and <5 % for all other foods(29) and (3) creation of the Trans Fat Monitoring Program(61) to conduct periodic monitoring of TFA content in the food supply. Despite these efforts, foods with TFA in 2010 were still found in the Canadian marketplace, and in some cases, at particularly high levels(Reference Arcand, Scourboutakos and Au62). In September 2017, the Canadian government added PHO, which were defined as ‘fats and oils that have been hydrogenated, but not to complete or near complete saturation, and with an iodine value greater than 4’(63), to the List of Contaminants and Other Adulterating Substances in Foods(63) that no longer would be permitted in foods by September 2018(49), an approach already taken by many countries, even though Canada was one of the first countries to mandate the declaration of TFA in the NFt in 2003(19) and set voluntary limits in 2006(29) (Fig. 1). Moreover, fats and oils that have been fully hydrogenated or partially hydrogenated are required in Canada to be labelled as ‘hydrogenated vegetable oil’ or ‘hydrogenated vegetable fat’ or ‘hydrogenated’ along with the specific name of the oil or fat; however, it is not required to identify the nature of the hydrogenation (fully or partially hydrogenated)(64); therefore, fats and oils that have been labelled only as ‘hydrogenated’ could also be another potential TFA contributors.
Although the content of TFA in Canadian packaged foods in 2010 has been previously reported(Reference Arcand, Scourboutakos and Au62), little is known about the use of PHO or hydrogenated oils (HO) in the food supply and the levels of TFA associated with their use. The objective of this study was to update data on the prevalence of PHO, HO and/or both in packaged foods collected in 2013 and 2017 and to determine the mean TFA content of products containing such oils. These data can assess the overall progress towards the elimination of TFA in Canada and provide baseline data prior to the prohibition of PHO, which came in force in September 2018.
Methods
Food Label Information Program database
This analysis was a repeated cross-sectional study of the Food Label Information Program (FLIP) databases 2013 and 2017. FLIP is a food label database containing label information of Canadian packaged foods, created and maintained at the University of Toronto. The purpose of FLIP is to monitor and evaluate changes in nutritional quality and label information of foods and beverages in Canada(Reference Schermel, Emrich and Arcand65). Three collections of FLIP have been completed with the following number of unique products per collection: FLIP 2010/2011 (n 10 487)(Reference Schermel, Emrich and Arcand65), FLIP 2013 (n 15 342)(Reference Bernstein, Schermel and Mills66) and FLIP 2017 (n 17 671), for which details of the 2017 collection are outlined in this paper.
Data collection
FLIP 2017 followed similar collection methods as those established for 2013(Reference Bernstein, Schermel and Mills66). Data on prepackaged foods and beverages were collected from the top selling grocery retailers using a mobile data collector app. FLIP 2013 data were collected in the Greater Toronto Area, Ottawa and Calgary during May to September 2013 (Loblaws, Metro, Sobeys and Safeway)(Reference Bernstein, Schermel and Mills66), while 2017 data were collected during July and September 2017 from Loblaws, Metro and Sobeys in the Greater Toronto Area. Together, these chains represented 75(Reference Bernstein, Schermel and Mills66) and 68 %(67) of grocery retail sales in Canada for 2013 and 2017, respectively. A mobile data collector app and web-based software and database, developed by researchers at the University of Toronto with technical support from Dietitians of Canada, were used to collect, store and analyse photos of food packages and label data(Reference Bernstein, Schermel and Mills66) (online Supplemental Fig. 1). Grocery store shelves were systematically scanned, from which universal product codes and photographs of product labels were taken (i.e. front-of-pack, back-of-pack, right side, left side, top, bottom, ingredients close-up, NFt close-up, barcode and shelf tag (regular price)) using the mobile collector app. Every food and beverage with an NFt was included for collection. Food products sold at multiple retailers (e.g. national brand products) were captured only once(Reference Bernstein, Schermel and Mills66). Although multiple package sizes of the same product were collected and linked in 2017, products were counted only once in the present study. All flavours and varieties of a product were collected and evaluated. Products were excluded if they were natural health products (e.g. supplements in pill format, protein powders), seasonal products (e.g. Easter chocolates), gum, herbs and spices (e.g. cinnamon, unless it was prepackaged mix such as a steak spice), plain water and any product without a mandatory NFt (e.g. breads baked in-store), as previously established(Reference Bernstein, Schermel and Mills66).
Data entry and matching
Basic data, including product name, company, NFt (as purchased), Ingredients List, price, brand, container size and universal product code, were entered by trained staff onto the FLIP web-based database platform(Reference Bernstein, Schermel and Mills66). Products that were present in both collections were matched through their universal product codes, although not used or reported in this paper.
Data processing and validation
Likewise in 2013(Reference Bernstein, Schermel and Mills66), if products in FLIP 2017 required preparation before consumption (e.g. canned soups, muffin mixes), nutrition information was calculated as consumed using the ESHA Food Processor software and food composition data from the Canadian Nutrient File, which is the standard reference food composition database of nutrients in foods commonly consumed in Canada(68). Grams/millilitres conversions were also calculated based on similar products and/or the Canadian Nutrient File. Quality assurance measures, including Atwater calculations and data entry verification by a second team member, were conducted to ensure data completeness and accuracy. Products (2013 and 2017) were classified into twenty-four food categories, as defined by the Table of Reference Amounts(69).
Identification and classification of partially hydrogenated oils and hydrogenated oils
For the purpose of this study, we classified PHO ‘as those hydrogenated fats and oils, specifically labelled as partially hydrogenated’ and HO ‘as hydrogenated fats and oils without level of hydrogenation specified’. The presence of PHO and HO was determined in foods using the Ingredients List. Terms that were searched for in the Ingredients List included partially hydrogenated vegetable oil, hydrogenated vegetable oil or any other variations of these using different types of oils (e.g. rapeseed, soyabean, sunflower and cottonseed), or any vegetable fat that was labelled as partially hydrogenated or hydrogenated.
Analyses
From 33 013 unique products collected in 2013 and 2017, meal replacements (n 137) and natural health products (n 1) were excluded for analysis, giving a total of 32 875 products analysed in this study. Proportions of products containing PHO, HO or both were calculated by year and by TRA food category(69). The percentage contribution of TFA (g) to total fat (g) was calculated and compared against the recommended limits, defined as <2 % of total fat content for fats and oils, and <5 % for all other foods. Foods exceeding such limits were identified(29). The mean TFA content (declared as g TFA/serving on the NFt) was calculated for products declaring PHO, HO or both and stratified by level of TFA content: (a) ≤0 g TFA/serving in the NFt, (b) products with >0 g TFA/serving in the NFt but not exceeding TFA limit and (c) products exceeding TFA recommended limits. χ 2 (or Fisher test) and Mann–Whitney–Wilcoxon tested for differences in proportions and mean TFA content of products carrying these oils between years. Analyses were conducted using R-Studio(70).
Results
The use of PHO, HO or both has significantly decreased in the Canadian food supply from 2013 to 2017 (Table 1). Overall, PHO use was reduced from 0·8 (n 117/15 286) to 0·2 % (n 36/17 589), HO use decreased from 5 % (n 766/15 286) to 2·4 % (n 419/17 589) and the use of PHO, HO and/or both in foods also decreased from 5·7 % (n 871/15 286) to 2·6 % (n 450/17 589), respectively, for 2013 and 2017 (all P < 0·001). The largest decrease in the use of PHO was seen in desserts (2·7–0 %), salads (2·9–0·8 %) and combination dishes (1·9–0 %), all significant (P ≤ 0·004). The use of HO was reduced mostly in potatoes, sweet potatoes and yams from 16·4 to 1·5 %, combination dishes from 10·3 to 2 % and desserts from 11·7 to 4 % (all P < 0·001). However, we also observed an increase in the use of HO in dessert toppings and fillings from 10·2 to 13·8 %, although it was not statistically significant. We also found twelve foods that had both PHO and HO declared in the Ingredients List. The mean TFA per food category is also shown in Table 1. Although for most food categories, the TFA content decreased for foods with PHO between 2013 and 2017, we observed a significant increase in bakery products (P = 0·03). We also observed an increasing but not statistically significant trend in the mean TFA of products with HO in the following categories: dessert topping and fillings, fats and oils and salads (due to the accompanying dressings). The mean TFA content of products containing PHO slightly increased (0·34 to 0·57 g TFA/serving), but it was not statistically significant. The TFA content significantly decreased in foods with HO (0·24 to 0·16 g TFA/serving, P < 0·05) from 2013 to 2017 (Table 2).
Prevalence of foods and beverages declaring partially hydrogenated oils (PHO), hydrogenated oils (HO) and/or both in the Ingredients List and trans-fatty acid (TFA) levels in Food Label Information Program (FLIP) 2013 and 2017 by food category (n 32 875)

TRA, table of reference amounts.
* Differences in proportions of products carrying PHO, HO and/or both between years were determined using χ 2 test or Fisher test.
† As defined in the TRA(69).
Mean trans-fatty acid (TFA) content of products declaring partially hydrogenated oils (PHO), hydrogenated oils (HO) and/or both in the Ingredients List in Food Label Information Program (FLIP) 2013 and FLIP 2017 stratified by products meeting or exceeding recommendations (n 32 875)

TFA, trans fatty acids; FLIP, food label information program; PHO, partially hydrogenated oils; HO, hydrogenated oils; NFt, Nutrition Facts table.
* Mean TFA (g/serving) as declared on the NFt. In Canada, products with more than 0·2 g per serving of trans fat must declare trans fats on the label(19).
† Foods with partially hydrogenated oils, hydrogenated oils and/or both declared in the Ingredient List.
‡ TFA limits were set at <2 % total fat for fats and oils and <5 % total fat for all other foods for the percentage calculated as TFA (g) to total fat (g)(61). Values were calculated from the TFA declared on the NFt.
§ In 2018, the use of PHO in foods was prohibited in Canada(63).
‖ TFA data not available on the NFt.
** Mann–Whitney–Wilcoxon statistically significant at P < 0·05 between years.
Discussion
In light of the recent ban of PHO in Canadian foods, this study assessed the prevalence of PHO, and HO and/or both in packaged foods, and the mean TFA levels of products containing such oils, sold in 2013 and 2017, before the regulations were fully in force in 2018. Analyses showed encouraging results towards the elimination of PHO as 0·2 % of foods in 2017 contained such oils, which represents a quarter of the prevalence observed in 2013 (0·8 %). HO were also less often used in 2017 compared with 2013 (5–2·4 %). These results are consistent with other studies that have observed a decrease in the use of fats and oils containing TFA in recent years(Reference Costa, Cruz and Graça71–Reference Zupanič, Hribar and Pivk Kupirovič73). Although for most food categories, a decrease in the use of PHO and HO also showed a decrease in the mean TFA content, we found that in the bakery category, products with PHO, the amount of TFA significantly increased from 0·88 to 2·99 g/100 g in 2017. Data from other countries showed that products within similar categories, such as pastries, cookies and other bakery products, presented levels ranging from 0·03 to 0·78 g/100 g(Reference Costa, Cruz and Graça71,Reference Becker, Eriksson and Haglund72) . Therefore, our finding is concerning as a third of products with PHO in 2017 belonged to this category. We also found that in products exceeding limits, the levels of TFA were considerably higher compared with recommended limits of <5 % TFA of total fat for foods. For example, the percentage of TFA in relation to total fat for products with PHO, HO and/or both in 2017 was 19 %. Our assessment of the mean TFA content of products with HO, and particularly those exceeding recommended limits, suggests that such products are most likely products manufactured with PHO, although not labelled as such in the Ingredients List. Oils that have near-complete hydrogenation present similar TFA concentrations as those non-hydrogenated (i.e. <2 % of total fat)(45). Thus, more work is needed to achieve the WHO recommendation of eliminating trans fats due to their harmful health effect and it is likely that banning the use of PHO would result in a further reduction of TFA, as seen in other countries where similar approaches have been taken(Reference Monge-Rojas, Colón-Ramos and Jacoby17,Reference Kakisu, Tomchinsky and Victoria Lipps33,Reference Otite, Jacobson and Dahmubed74–Reference Pearson-Stuttard, Critchley and Capewell77) . Our results also highlight that monitoring the prevalence of HO and their TFA content in foods remains critical to assess unintended consequences, such as substantially higher levels of TFA in foods exceeding recommendations, a phenomenon observed in the present study, and particularly as the current labelling regulations do not require to differentiate between levels of hydrogenation(64).
Strength of this study is the use of a large database of food labels available in Canada (which includes the Ingredients List) that allowed us to evaluate the presence of PHO and HO in many food categories and to assess progress overtime resulting from voluntary efforts. Data regarding the prevalence of the use of PHO and especially HO in foods have been limited in Canada and elsewhere; thus, this research also highlights the importance of monitoring the use of HO in foods. Limitations of this study include that it is not possible to distinguish in the NFt the amount of TFA derived from each source (i.e. PHO/HO or ruminant sources). However, using the Ingredients List to identify food containing PHO and HO, we were able to establish a relationship between the presence of such oils and TFA in foods. Another limitation is that we only identified fats and oils that explicitly mentioned if they were ‘partially hydrogenated’ or ‘hydrogenated’, but certain fats and oils such as margarine, shortening or lard are exempted from declaring subcomponents (i.e. ingredients of ingredients) when they are used as ingredients in a product(78); therefore, these fats could also contain PHO or HO. Additionally, the overall decrease in proportion of foods with TFA could have been attenuated because we included all foods available in our database, which also has foods that are not potential sources of TFA, and which prevalence could fluctuate overtime. However, we have tried to moderate this limitation by including analyses by food category. A final limitation is differences in food categorisation, which may restrict comparisons between countries.
Conclusions
The use of PHO, a major contributor of TFA in processed foods, continues to be present in the Canadian marketplace, despite voluntary efforts to eliminate it. Foods containing HO should also be monitored, as the TFA content of such products could exceed, in some cases, recommended limits. The action taken by the Canadian government to restrict the use of PHO will likely further reduce TFA in the Canadian food supply to negligible levels, thereby ensuring maximal health benefits for all segments of the population.
Acknowledgements
Acknowledgements: The authors wish to acknowledge Daniela Kutlesa, Katherine Jefferson, Susan Trang, Ferdeela Shah, Calvin Mach, Chelsea McPherson, Hana Hmeidan, Sarah Kassel, Meghan O’Neill, Renita Lam, Jacqueline On, Rachel Wong, Oguz Aras and Sahar Goorang for their assistance in data collection and processing. Authors also acknowledge Marie-Ève Labonté, Kacie Dickinson, Mavra Ahmed, Christine Mulligan and Laura Vergeer for their assistance in data validation. Financial support: Specific contribution was made by the World Health Organization. This work was supported by research grants from the Canadian Institutes of Health Research (CIHR) Strategic Operating Grant (201103SOK-118150 and 2016PJT-152979) (M.R.L.); Earle W. McHenry Research Chair unrestricted research grant from the University of Toronto (M.R.L.); CIHR Frederick Banting and Charles Best Canada Graduate Scholarship (GSD-152299) (B.F.-A.); Department of Nutritional Sciences Graduate Student Fellowship (B.F.-A.); Research Fellowship and National New Investigator award from the Heart and Stroke Foundation of Canada (J.A.). Conflict of interest: Prior coming to the University of Toronto, B.F.-A. was a PepsiCo Mexico employee. The company had no connection or funding to the research. M.L. declares that she has received research grants from the Canadian Institutes of Health Research, Canadian Stroke Network, Burroughs Wellcome Fund, Heart and Stroke Foundation of Canada, International Development Research Centre, University of Toronto. J.A. has no conflicts of interests. She receives funding from the Canadian Institutes of Health Research, Heart and Stroke Foundation of Canada and International Development Research Centre. The rest of the authors have no conflicts of interest. Authorship: M.R.L., B.F.-A., J.A. and M.A.K. formulated the research questions and designed the study. A.S. collected and administrated data entry. B.F.-A. and M.A.K. identified partially and hydrogenated oils in all the foods in the Food Label Information Program database. B.F.-A. validated data extraction and conducted the final analyses. B.F.-A and J.A. drafted the manuscript. All authors contributed to the revision of the final manuscript. Ethics of human subject participation: Not applicable.
Supplementary material
For supplementary material accompanying this paper visit https://doi.org/10.1017/S1368980019004816



