
I. INTRODUCTION
Speech and audio coding technologies have been investigated since the 1960s and have made very big contributions to various communications systems, such as telephony, broadcasting, and storage. An historical view of the main developments in speech and audio coding is shown in Fig. 1. We can roughly categorize the schemes for speech and audio coding into four types: the vocoder, speech coding for two-way communication, audio coding for one-way communication, and lossless compression, or reversible compression.
Historical view of the progress in speech and audio coding schemes. Vertical axis roughly corresponds to bit rates. Arrows represent rough influence of fundamental technologies.

The vocoder (voice coder) is based on a structure with a simple source and filter model. It tries to keep only the spectral envelope and some features of the excitation source, such as voiced or unvoiced and the fundamental frequency. To synthesize signal, the decoder uses some parameters of the source in combination with parameters of power spectrum characterized by the shape of the vocal tract. Thus, the waveform of the output signal of the decoder is different from that of the input signal. For the purpose of representing the power spectrum efficiently, the linear prediction coding (LPC) filter [Reference Itakura and Saito1–Reference Atal3] and LPC parameters, such as partial autocorrelation (PARCOR) [Reference Itakura and Saito4] and line spectrum pair (LSP) [Reference Itakura5,Reference Itakura, Kobayashi and Honda6], were invented and extensively studied for the optimization.
Speech coding designed for two-way communication, such as telephony, requires low delay and low bit rates. Most of the coding schemes in this category rely on time-domain LPC analysis and synthesis technologies. Most of the cellular phone systems in the world still use the code excited liner prediction (CELP) more specifically, algebraic CELP (ACELP) scheme, which is based on a simple excitation source and LPC filter. Audio coding for one-way communication is mainly used for broadcasting and in audio players. Traditionally, coding schemes in this category rely on frequency-domain coding, especially efficient quantization of modified discrete cosine transformation (MDCT) coefficients. This category is also referred to as perceptual coding because the compression performance is significantly enhanced by using perceptual characteristics on top of the compression to remove signal redundancy.
Lossless compression, or reversible compression schemes, are devised for the application of long-term archiving or high-quality audio delivery. Their objective is to reduce bit rate as much as possible under the constraint of perfect signal reconstruction without any digital distortion.
Note that coding schemes in the second and third categories are also called high-compression waveform coding because they aim to reconstruct the same, or perceptually the same, waveform as accurately as possible within the constraint of the given bit rates. Recent developments and standardization are aiming at integrated speech and audio coding by making use of both time and frequency domain coding. In addition, entropy coding tools for lossless compression and efficient quantization tools for LPC parameters have been incorporated into the latest speech and audio coding schemes. Thus, most of the coding schemes in all categories shown in Fig. 1 depend on LPC technology.
In the following sections, we review LPC technology, in particular frequency-domain coding. We focus on the enhancement of rate-distortion performances and intentionally skip the perceptual optimization although it is obvious that the enhancement of the perceptual quality depends on the use of various perceptual characteristics. We have commonly used a conventional perceptual control scheme based on the smoothed LPC envelope in this paper.
The common framework of the LPC-based MDCT coding scheme as a baseline is shown in the next section. On top of the baseline, we describe three enhancement tools for efficient and accurate representation of LPC envelope. Note that they have been constructed on slightly different baseline systems with independent implementation, although they have a common structure.
The first enhancement tool is the harmonic model in combination of the LPC envelope [Reference Moriya, Kamamoto, Harada, Baeckstroem, Helmrich and Fuchs7]. The second is frequency-resolution warping of the LPC envelope [Reference Sugiura, Kamamoto, Harada, Kameoka and Moriya8,Reference Sugiura, Kamamoto, Harada, Kameoka and Moriya9]. The third is powered all-pole spectrum estimation (PAPSE) [Reference Sugiura, Kamamoto, Harada, Kameoka and Moriya10,Reference Sugiura, Kamamoto, Harada, Kameoka and Moriya11], for LPC modeling of the envelope, which takes the distribution of quantized MDCT coefficients into account. All tools are intended to enhance the efficiency of entropy coding of quantized MDCT coefficients. Rate-distortion performances have been enhanced by means of reduction of average bit consumption or reduction of quantization distortion with these tools. All tools are summarized in Table 1.
Summary of new enhancement tools for LPC envelope.

II. ROLE OF LPC
Digital signal processing has been used to process speech signals since the 1960s, and LPC has been investigated almost from the beginning. LPC coefficients can be derived by the fast Levinson–Durbin algorithm and can be efficiently quantized in the form of PARCOR coefficients or LSP parameters. These quantization tools for speech coding have been extensively investigated and have influenced audio coding.
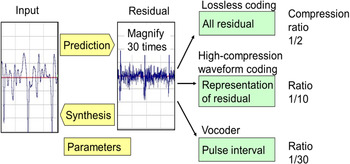
As shown in Fig. 2, the structure of the LPC prediction filter and synthesis filter is used for lossless coders, high-compression coders, and vocoders. The LPC inverse filter converts the input signal to a prediction residual signal, whose value is the difference between the input signal value and the predicted value. The spectrum of the residual signal is almost flat and its variance is significantly reduced from that of the original signal. The original signal can be reconstructed from the residual signal by the LPC synthesis filter with the same LPC coefficients as the inverse filter.
LPC synthesis for three types of coding schemes: lossless coder, high-compression waveform coder, and vocoder.
The LPC models the signals with the all-pole representation:
 $$H(z) = {\sigma \over 1 + \sum_{n = 1}^p a_n z^{-n}}$$
with its model parameters, or LPC coefficients, $\{a_{n}\}^{p}_{n = 1}$
, and the normalized residual gain σ. σ2 represents normalized variance of the prediction residuals. When the original signal has a variance of 1, the variance of the prediction residual becomes σ2. This can be written by
$\{a_{n}\}^{p}_{n = 1}$
, and the normalized residual gain σ. σ2 represents normalized variance of the prediction residuals. When the original signal has a variance of 1, the variance of the prediction residual becomes σ2. This can be written by
 $$\sigma^2 = \prod_{n=1}^{p} (1 - k_{n}^2),$$
where k n denotes nth PARCOR coefficient.
 $$Gain_{prediction} = {1 \over \sigma^2}.$$
Gain prediction is the prediction gain indicating the effect of the prediction, or the energy-reduction rate by the prediction.
For vocoders, the residual signal is replaced with a synthetic excitation signal with a simple pitch pulse train or white noise component. Output signal can be reconstructed by combining the excitation signal and LPC synthesis filter at the decoder. Transmitted information includes only the LPC coefficients and excitation parameters. Since there is no need for transmitting information for representing individual signal samples, the compression ratio can be 1/30.
For lossless coders, residual signal values are represented by integer numbers and losslessly compressed by entropy coding. Bit rates for speech and audio signal can be reduced by roughly half owing to the reduction in the variance of the residual.
For high-compression waveform coders, residual signals are quantized and compressed with the constraint of the trade-offs between the bit rates and quantization distortion. LPC prediction gain plays a main role in reducing quantization distortion or bit rate reduction. In either the time domain or frequency domain, we can roughly compress bit rates to 1/10 of the original while keeping the practically acceptable quality of the output signal.
In the frequency domain, we can make use of the deviation in the spectrum caused by the time-domain sample correlation to reduce quantization distortion by means of adaptive bit allocation or adaptive weighted distortion measure on the frequency axis. As long as a smooth spectral envelope generated by the same LPC coefficients is used for adaptive bit allocation or for adaptive weighting, we get the frequency-domain (transform) gain, which is the same as the prediction gain Gain prediction in the time domain [Reference Moriya and Honda12].
The fundamental categories of the decoder part of speech and audio coding (high-compression coder) is shown in Fig. 3 in view of the LPC process.
Classification of coding schemes: (a) conventional audio encoder [upper branch]/decoder[lower branch], (b) LPC-based audio encoder/decoder, (c) LPC-synthesis audio encoder/decoder (original transform coded excitation: TCX), and (d) time-domain LPC encoder/decoder.

Category (A) includes typical frequency-domain audio coding schemes, such as MP3 [13] and AAC [14]. These normally use scale-factor-band wise energy to characterize the power spectrum of the signal, namely, approximation of variance of MDCT coefficients.
Schemes in category (B) use the LPC envelope to characterize the power spectrum. This category includes transform domain weighted interleave vector quantization (TwinVQ) [Reference Iwakami, Moriya and Miki15,Reference Moriya, Iwakami, Ikeda and Miki16], the TwinVQ tool in MPEG-4 general audio [17], a low-delay coding in [Reference Schuller, Yu, Huang and Edler18], low-bit rate modes in MPEG-D unified speech and audio coding (USAC) [19–Reference Neuendorf21], and some of the modes in 3GPP enhanced voice services (EVS) [Reference Fuchs, Multrus, Neuendorf and Geiger22–Reference Bӓckström and Helmrich27].
Coders in category (C) use the LPC synthesis filter at the decoder, and the excitation signals are represented in the frequency domain. Discrete cosine transform (DCT) is typically used since the LPC synthesis filter can remove frame boundary discontinuity, while MDCT has been used in schemes in categories (A) and (B) to avoid it. This category includes transform coding with weighted vector quantization (TCWVQ) [Reference Moriya and Honda12], transform coded excitation (TCX) [Reference Lefebvre, Salami, Laflamme and Adoiil28,Reference Lefebvre, Salami, Laflamme and Adoul29], and 3GPP extended adaptive multi-rate wideband (AMR-WB+) [30,Reference Salami, Lefebvre, Lakaniemi, Kontola, Bruhn and Taleb31]. We need to be careful that the term “TCX” has been commonly used in both category (B) and (C).
Category (D) includes typical speech coders such as CELP [Reference Schroeder and Atal32] based on LPC synthesis. Excitation signals for the filter are represented by a random or trained vector, but mostly the algebraic structure used in ACELP [Reference Adoul, Mabilleau, Delprat and Morissette33,Reference Salami34], where the excitation signal is constructed by a summation of several tracks with a sparse unit-amplitude pulses. Note that even when time-domain codes are used, frequency-domain or autocorrelation-domain code searches are carried out to reduce complexity [Reference Trancoso and Atal35,Reference Trancoso and Atal36].
Although there have been no quantitative comparisons of schemes based on the scale factor band in category (A) and the LPC-based ones in category (B), MPEG-D USAC, for example, uses schemes in category (A) for higher-bit-rate modes and in (B) for low-bit-rates modes. The 3GPP EVS standard for mid-range bit-rates modes [23] switches both types of transform coding frame by frame, in category (A) and (B). It is based on the observation that the scale-factor-band energy representation can efficiently compress the side information for a flat spectrum when sub-band wise differential coding and entropy coding of energy are combined. In contrast, side information represented by LPC, in particular, by LSP parameters can efficiently quantize a spectral envelope even with a high dynamic range.
Considering the status of these standards, the schemes in category (B), in particular the types used in combination with entropy coding of scalar-quantized (SQ) MDCT coefficients, seem to be the most promising for low-rate and low-delay coding. Therefore, they will be used as the baseline coding for investigating the additional tools.
III. LPC-BASED MDCT CODING AS BASELINE
The baseline encoder and decoder are shown in Figs 4 and 5. The yellow shades represent regions of processing of noise shaping of MDCT spectra with LPC envelope, where some enhancement tools are mainly applied in this paper.
Baseline encoder for LPC-based MDCT coding.

Baseline decoder for LPC-based MDCT coding.

At the encoder, original spectra, which are MDCT coefficients, are noise-shaped to get weighted spectra. Noise shape means that spectra are multiplied by perceptual weight P k for each frequency bin k=0,…,N−1, where N is the frame length. Note that P N−1 is the weight at the half sampling frequency, since 2N by N transform is used. These weights are calculated from the LPC envelopes.
The spectral envelopes are given by the frequency response of the LPC filter:
 $$H_k = \left\vert 1 + \sum^{p}_{n = 1} a_ne^{-{j}({\pi k}/N) n} \right\vert^{-1}$$
with pth order LPC coefficients $\{a_{n}\}^{p}_{n = 1}$
and the imaginary unit j distinguished from a variable j. The weights are given from the same coefficients as
$\{a_{n}\}^{p}_{n = 1}$
and the imaginary unit j distinguished from a variable j. The weights are given from the same coefficients as
 $$P_k = 1/\tilde{H}_k=\left\vert 1 + \sum_n a_n\gamma^ne^{-{j}({\pi k}/N) n} \right\vert,$$
where 0<γ<1. Coefficient $\{\tilde{H}_{k}\}^{N-1}_{k=0}$
in equation (5) corresponds to the smoothed form of the envelope
$\{\tilde{H}_{k}\}^{N-1}_{k=0}$
in equation (5) corresponds to the smoothed form of the envelope $\{H_{k}\}^{N-1}_{k=0}$
. These relations are shown in Fig. 6.
$\{H_{k}\}^{N-1}_{k=0}$
. These relations are shown in Fig. 6.
Example of LPC envelope and smoothed one. Envelope of frequency domain residue to be quantized is estimated to H k /H̃ k . γ=0.92 is used for smoothing in this figure.

Weighted spectra are scaled and SQ to get an integer sequence of quantized codes. The integer sequence is compressed by entropy coding. As shown in Fig. 7, the amplitude distribution of codes can be estimated by the modified LPC envelope. Since the original spectra have the envelope of $\{H_{k}\}^{N-1}_{k=0}$
, the quantized sequence has the shape
$\{H_{k}\}^{N-1}_{k=0}$
, the quantized sequence has the shape $\{H_{k}/\tilde{H}_{k}\}^{N-1}_{k=0}$
. The combination of scalar-quantization and adaptively controlled entropy coding can naturally allocate more bits for a spectral component with larger amplitude. This mechanism gives the same effect of reduction of quantization noise as the original adaptive transform coding [Reference Zelinski and Noll37] schemes with adaptive bit allocation or the adaptive weighting measure for vector quantization.
$\{H_{k}/\tilde{H}_{k}\}^{N-1}_{k=0}$
. The combination of scalar-quantization and adaptively controlled entropy coding can naturally allocate more bits for a spectral component with larger amplitude. This mechanism gives the same effect of reduction of quantization noise as the original adaptive transform coding [Reference Zelinski and Noll37] schemes with adaptive bit allocation or the adaptive weighting measure for vector quantization.
Relationship between LPC envelope and variance of MDCT spectra for quantization. LPC envelope information assists efficient compression of entropy coding for SQ MDCT spectra. When LPC envelope has large value, we expect MDCT spectra have large variance and they should be efficiently coded by Rice coding with the large Rice parameter, which consume many, say 5, bits. In contrast, MDCT spectra should be efficiently coded with fewer bits when LPC envelope is small.

At the decoder, $\{\tilde{H}_{k}\}^{N-1}_{k=0}$
is multiplied to the reconstructed spectra to get the same spectra as the input. Since the quantization noise has the flat shape in the frequency domain, reconstructed spectra have quantization noise whose envelope is expected to have a smoothed shape of
$\{\tilde{H}_{k}\}^{N-1}_{k=0}$
is multiplied to the reconstructed spectra to get the same spectra as the input. Since the quantization noise has the flat shape in the frequency domain, reconstructed spectra have quantization noise whose envelope is expected to have a smoothed shape of $\{\tilde{H}_{k}\}^{N-1}_{k=0}$
. This shape is an approximation of the noise level masked by the target signal, in which results the perceptual concealment of the quantization noise.
$\{\tilde{H}_{k}\}^{N-1}_{k=0}$
. This shape is an approximation of the noise level masked by the target signal, in which results the perceptual concealment of the quantization noise.
When the rate for every frame is fixed, we need to adjust the number of used bits to be less than the target bits by using repeated trials of changing the gain (step size), called “rate loop” as shown in Fig. 8 since the result of the code length (used bits) by entropy coding varies. Proposing new tools can reduce the distortion through enhancing the efficiency of entropy coding and the rate loop.
Convergence process of code length and gain in a rate loop. If code length is longer than the target code length, gain is reduced, or step size is increased. Otherwise, gain is increased. Proposing new tools can enhance the efficiency of entropy coding, and can reduce the distortion subject to the same bit rates.

IV. HARMONIC MODEL FOR TCX
In cases of a shorter frame size and a shorter overlap window size, one of the most obvious quality degradations was observed for tonal music signals. This seems to be caused by insufficient compression performance of entropy coding for high peaks in the MDCT coefficients, which cannot be followed by a smooth LPC envelope. We, therefore, proposed a harmonic model on top of the LPC envelope to enhance the efficiency of the entropy coding, in particular, arithmetic coding. The aim of the harmonic model is to enhance the probability modeling for the arithmetic coding. Unlike long term prediction (LTP) used in AAC [14], which exploits the irrelevance of tonal signals by shaping the quantization noise, this method exploits the redundancy of the harmonic structure. Both concepts can be combined, which is actually the case in the 3GPP EVS codec, where the LTP postfilter is also present.
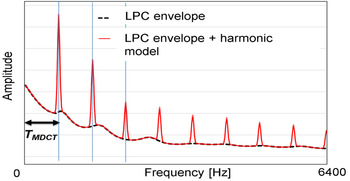
The baseline system assumes that variances of the quantized spectra have smooth shapes across the frequency axis and they follow the shape of the normalized LPC envelope. There are, however, strong peaks in the spectra, which demand many bits if the entropy coding has no information about these peaks. We have devised simple harmonic model that modifies the LPC envelope as shown in Figs 9 and 10. We construct peak shapes as shown in Fig. 11 only when they have a simple harmonic structure, namely, when they are aligned with equal intervals on the frequency axis. We frequently encounter this case for tonal sound in synthetic music used in holding tones, of which degradation due to compression coding is more apparent compared with complex sounds. In this case, we can encode the side information of the interval and relative gain of the peaks with small number of bits to modify the LPC envelope. The modified envelope shape can tell the appropriate variance parameter to the entropy coding and can greatly save bits.
Harmonic model combined with the baseline encoder.

Harmonic model combined with the baseline decoder.

Example of harmonic model used in combination with the LPC envelope.
If we combine this harmonic model with a forward adaptive LTP postfilter, we can further improve the efficiency of compression of side information for the harmonic model. “Forward adaptive” means that the postfilter uses side information which have been extracted in the preprocessing at the encoder. Time-domain pitch lag parameterized for LTP can be used as a good estimate of the frequency-domain interval and can reduce bit consumption for the interval.
Subjective listening tests by MUSHRA [38], have been carried out to compare the quality with the harmonic model and the baseline without it. Seven input items covering various kinds of music and mixtures of music and speech were encoded with a sampling rate of 16 kHz, bit rate of 9.6 kbps, and frame size of 20 ms. The number of listeners was seven. Item-by-item differential averaged scores over listeners are shown in Fig. 12. We can see that the majority of items, including total average, got significantly better scores when the harmonic model was employed.
Differential scores (item-by-item average and 95% confidence intervals) of MUSHRA with and without the harmonic model and. Asterisks indicate the existence of significant difference at 5 % in a paired t-test.

V. RESOLUTION-WARPED LPC FOR TCX
Generally, the LPC envelope has a uniform frequency resolution over frequencies for fitting on the spectra since it is composed of linearly combined sinusoids as seen in equation (4). This limitation on the resolution causes, in some cases, a failure in representing the spectra, which ends up in unexpected bit allocations by the entropy coding. Of course, this resolution can be enhanced by increasing the order of LPC, but this also leads to an increase in the bits to code the LPC coefficients and computational complexity to estimate the LPC coefficients from the signal. In fact, most natural sounds have a relatively higher power at lower frequencies so that the information content of quantized signals, the diversity of the spectral values in other words, tends to concentrate in the lower band. Therefore, instead of using higher-order LPC, it is smart to modify the LPC model to warp the frequency resolution, for example, into a Mel-frequency scale [Reference Harrington and Cassidy39].
Taking into account that TCX requires only the spectral envelope and does not use an LPC filter as a time-domain filter, we devised a simple method with lower complexity compared to the earlier challenges (like [Reference Wabnik, Schuller, Kramer and Hirschfeld40–Reference Nakatoh, Norimatsu, Low and Matsumoto45]) of representing envelopes with warped frequency resolution. In this method [Reference Sugiura, Kamamoto, Harada, Kameoka and Moriya8,Reference Sugiura, Kamamoto, Harada, Kameoka and Moriya9], the power spectra of the signal, or squared MDCT coefficients, are first frequency warped and inverse Fourier transformed. Then, as in the conventional LPC, coefficients are estimated by performing the Levinson–Durbin algorithm, with the transformed spectra regarded as a pseudo-auto-correlation function. The LPC envelope given from the coefficients shows uniform resolution over the “warped” frequencies. Therefore, resetting the frequency by the inverse warping results in an envelope with its frequency resolution warped. This warping and inverse warping can be approximated by sparse non-negative matrices, which can prevent increases in computation costs.
This method differs from the conventional LPC only in the additional matrix operations, which costs little complexity when the matrices are sparsely designed. In addition, the Levinson–Durbin algorithm enables us to check the stability of the LPC coefficients easily during the estimation just as in the conventional one.
The resolution-warped LPC was integrate into the baseline coder as in Fig. 14 and its effects on the subjective quality were evaluated by an informal AB test. Seven participants were blindly provided with items with a 16-kHz sampling rate, each coded in 16 kbps by both the baseline coder and integrated coder. After listening to the references, the participant chose the method they preferred by scoring from −2 to 2 points for each item. The item-wise result in Fig. 13 proves the resolution-warped LPC actually enhanced the subjective quality of the coder. The resolution-warped LPC envelope represented the shape of the spectra more precisely in the lower band when we used the Mel-frequency warping, which enhanced the compression efficiency of the entropy coding.
Differential scores (item-by-item average and 95% confidence intervals) of AB test with and without resolution-warped LPC. Asterisks indicate the existence of significant difference at 5% in a t-test.

Resolution-warped LPC combined with the baseline encoder/decoder.

VI. PAPSE FOR TCX
In designing coders, we have the option of assuming distributions for the spectra, and the more likely the actual spectra belong to the assumed distribution, the more efficiently we can compress it by the entropy coding. For audio coders, the Laplacian distribution has been well used: for example, USAC and EVS use the distribution with the arithmetic coding for the entropy coding, and SHORTEN [Reference Robinson46,Reference Hans and Schafer47], MPEG-4 audio lossless coding (ALS) [48–Reference Salomon and Motta55], and ITU-T G.711.0 [56–Reference Harada, Kamamoto and Moriya58] assume the Laplacian by using Golomb–Rice coding [Reference Golomb59–Reference Sayood61] for the bit allocations. Of course there are some merits to assuming the Laplacian because of its simplicity, but the distribution of the target may vary depending on both the acoustic properties of the target and the conditions of the coding frame length for the frequency representation, for example. To fully use the statistical properties of the target, we need to be able to deal with a wider variety of distributions.
As a class of such distributions, the generalized Gaussian is well known not only in audio analysis, but also in image and video analysis [Reference Yu, Lin, Rahardja and Ko62–Reference Parisot, Antonini and Barlaud67]:
 $$f_{GG}(X \Vert \phi, \alpha) = {C_1(\alpha) \over \phi} \exp \left(-\left\vert C_2(\alpha) {X \over \phi} \right\vert^{\alpha} \right),$$
where C
1 and C
2 are constants written by the gamma function $\Gamma(x) = \int^{\infty}_{0} e^{-t}t^{x-1} \hbox{d}t$
as
$\Gamma(x) = \int^{\infty}_{0} e^{-t}t^{x-1} \hbox{d}t$
as
 $$C_1(\alpha) = {\alpha C_2(\alpha) \over 2\Gamma(1/\alpha)}, \quad C_2(\alpha) = \sqrt{{\Gamma(3/\alpha) \over \Gamma(1/\alpha)}}.$$
This model has a shape parameter α that makes the model represent the Gaussian (when α=2) and Laplacian (when α=1). Although using this distribution, with an appropriate α, at the entropy coding as in Fig. 7 seems to enable more practical bit allocations, it is known that the LPC envelope is not optimal for the code length when α≠2.
To guarantee the optimality of the envelope with low computational costs, we extended LPC in [Reference Sugiura, Kamamoto, Harada, Kameoka and Moriya11] using a powered model as
 $$H_{k, \alpha} \equiv \left({\alpha C_2(\alpha)^{\alpha} \over \left\vert 1 + \sum_{n = 1}^p a_n e^{-{j}({\pi nk}/N)} \right\vert^2} \right)^{1/\alpha} \equiv \alpha^{1/\alpha} C_2(\alpha) H_k^{2/\alpha},$$
which leads to the code length ${\cal L}$
of a frame of quantized MDCT coefficients
${\cal L}$
of a frame of quantized MDCT coefficients $\{X_{k}\}_{k=0}^{N-1}$
as
$\{X_{k}\}_{k=0}^{N-1}$
as
 $${\cal L} \propto \sum_{k = 0}^{N-1} - \log f_{GG}(X_k \Vert H_{k,\alpha}, \alpha) \propto \sum_{k = 0}^{N - 1} D_{\rm IS} (H_k^2 \Vert \vert X_k \vert^\alpha),$$
written in Itakura–Saito (IS) divergence $D_{\rm IS} (x \Vert y) = y/x-\ln (y/x)-1$
. The minimization of this code length can be solved just as LPC by regarding α-th-powered spectra as power spectra since the algorithm gives coefficients that minimize the IS divergence between the squared LPC envelope and power spectra. Figure 15 depicts the procedure for this method and the integration into the baseline coder. The extraction of the envelope only requires powering operations before and after the conventional LPC. We therefore call this method powered all-pole spectrum estimation (PAPSE). Note that PAPSE becomes equivalent to LPC when α=2 and to [Reference Sugiura, Kamamoto, Harada, Kameoka and Moriya10] when α=1.
$D_{\rm IS} (x \Vert y) = y/x-\ln (y/x)-1$
. The minimization of this code length can be solved just as LPC by regarding α-th-powered spectra as power spectra since the algorithm gives coefficients that minimize the IS divergence between the squared LPC envelope and power spectra. Figure 15 depicts the procedure for this method and the integration into the baseline coder. The extraction of the envelope only requires powering operations before and after the conventional LPC. We therefore call this method powered all-pole spectrum estimation (PAPSE). Note that PAPSE becomes equivalent to LPC when α=2 and to [Reference Sugiura, Kamamoto, Harada, Kameoka and Moriya10] when α=1.
PAPSE combined with the baseline encoder/decoder.

We compared the signal-to-noise ratio (SNR) of the quantized spectra using both LPC and PAPSE with the generalized Gaussian assumed for the spectra in the arithmetic coding. The bit rate was fixed at 16 kbps. The MDCT spectra of audio data were compressed for each shape parameter α. The average SNR of the data for each α is plotted in Fig. 16. The peak of the curve for the proposed PAPSE seems to be in between 0.5 and 1 with α=0.7 attaining the maximum average SNR in this test. On the other hand, with the LPC, introducing the generalized Gaussian was less effective since LPC does not guarantee the optimality of its coefficients in the sense of description length.
SNR of the quantized spectra by the shape parameter α for the arithmetic coding using each method. A total of 24 720 frames of MDCT coefficients were tested at 16 kbps.

A subjective evaluation was organized using MUSHRA [38] with nine participants. The baseline coder used Laplacian for the arithmetic coding as the conventional coders do, while the coder integrated with PAPSE used the generalized Gaussian of α=0.7. The relative scores of the integrated coder compared to the baseline coder are presented in Fig. 17. The baseline coder was actually enhanced by introducing the generalized Gaussian and the PAPSE optimized for it, with the average score having a significant difference at 5%.
Differential scores (item-by-item average and 95% confidence intervals) of MUSHRA with and without PAPSE. Asterisks indicate the existence of significant difference at 5% in a paired t-test.

VII. CONCLUSION
Progress in frequency-domain LPC-based coding schemes was described. Coding schemes in relation to LPC were reviewed historically, and recently proposed tools for improving compression efficiency were shown. The proposed tools include the harmonic model, frequency resolution warping, and PAPSE. The first tool has already been incorporated into the 3GPP EVS standards, and the remaining tools are promising for future development. All of the tools can be combined. Frequency-domain LPC-based coding might be a candidate for truly unified speech and audio coding in the future.
ACKNOWLEDGEMENTS
Authors are grateful to Professor Tom Bäckström, Dr. Christian Helmrich, and Dr. Guillaume Fuchs at FhG for variable supports of this work.
Takehiro Moriya received the B.S., M.S., and Ph.D. degrees in Mathematical Engineering and Instrumentation physics from the University of Tokyo, in 1978, 1980, and 1989, respectively. Since joining NTT Laboratories in 1980, he has been engaged in research on medium to low bit rate speech and audio coding. In 1989, he worked at AT&T Bell Laboratories as a Visiting Researcher. Since 1990 he has contributed to the standardization of coding schemes for the Japanese Public Digital Cellular System, ITU-T, ISO/IEC MPEG, and 3GPP. He is currently Head of the Moriya Research Laboratory in NTT Communication Science Laboratories, and is NTT Fellow, IEEE Fellow, and Institute of Electronics, Information and Communication Engineers (IEICE) Fellow. He is a member of the IEEE Speech Technical Committee of the Signal Processing Society (SPS), and a chair of the IEEE SPS Tokyo Joint Chapter. He received number of awards including IEEE James L. Flanagan Speech and Audio Processing Award in 2016.
Ryosuke Sugiura received the B.S. and M.S. degrees in Information Physics and Computing from the University of Tokyo in 2013 and 2015, respectively. In 2015, he joied NTT Communication Science Laboratories. His research interests include audio coding, signal processing, and information theory. He received IEEE SPS Japan Student Journal Paper Award from IEEE SPS Tokyo Joint Chapter in 2015 and the Telecom System Student Award from the Telecommunications Advancement Foundation (TAF) in 2016. He is a member of Acoustical Society of Japan (ASJ) and IEEE.
Yutaka Kamamoto received the B.S. degree in Applied Physics and Physico-informatics from Keio University in 2003 and the M.S. and Ph.D. degrees in Information Physics and Computing from the University of Tokyo in 2005 and 2012, respectively. Since joining NTT Communication Science Laboratories in 2005, he has been studying signal processing and information theory, particularly lossless coding of time-domain signals. He additionally joined NTT Network Innovation Laboratories, where he developed the audio-visual codec from 2009 to 2011. He has contributed to the standardization of coding schemes for MPEG-4 ALS, ITU-T Recommendation G.711.0, and 3GPP EVS.
Hirokazu Kameoka received B.E., M.S., and Ph.D. degrees all from the University of Tokyo, Japan, in 2002, 2004, and 2007, respectively. He is currently a Distinguished Researcher and a Senior Research Scientist at NTT Communication Science Laboratories, Nippon Telegraph and Telephone Corporation and an Adjunct Associate Professor at the National Institute of Informatics. From 2011 to 2016, he was an Adjunct Associate Professor at the University of Tokyo. His research interests include audio, speech, and music signal processing and machine learning. Since 2015, he has been an associate editor of the IEEE/ACM TRANSACTIONS ON AUDIO, SPEECH, AND LANGUAGE PROCESSING. He received 13 awards over the past 10 years, including the IEEE Signal Processing Society 2008 SPS Young Author Best Paper Award. He is the author or co-author of about 100 articles in journal papers and peer-reviewed conference proceedings.
Noboru Harada received the B.S. and M.S. degrees from the Department of Computer Science and Systems Engineering of Kyushu Institute of Technology, in 1995 and 1997, respectively. He joined NTT in 1997. His main research area has been lossless audio coding, high-efficiency coding of speech and audio, and their applications. He additionally joined NTT Network Innovation Laboratories, where he developed the audio-visual codec for ODS from 2009 to 2011. He is an editor of ISO/IEC 23000-6:2009 Professional Archival Application Format, ISO/IEC 14496-5:2001/Amd.10:2007 reference software MPEG-4 ALS and ITU-T G.711.0, and has contributed to 3GPP EVS. He is a member of IEICE, ASJ, the Audio Engineering Society (AES), and IEEE.


 Open access