


CVD remains the main cause of mortality globally, which is an enormous burden to public health. Obesity is considered to be a metabolic disease and a risk factor for CVD. Previous studies have explored the association of BMI with cardiovascular mortality and all-cause mortality(Reference Kim, Kim and Khera1–Reference Aune, Sen and Norat3). However, BMI does not account for fat distribution, while abdominal fat has been demonstrated closely associated with CVD(Reference Piché, Tchernof and Després4).
Fat distribution more than overall body weight has been a key determinant of the risk for CVD(Reference Koenen, Hill and Cohen5). Previous studies have shown visceral adipose tissue was an important obesity-related predictor of cardiovascular risk in 70-year-old men, and by implication, that decreasing visceral adipose tissue may potentially reduce their risk of CVD(Reference Ballin, Nordström and Niklasson6) and a higher visceral adipose tissue might be an early biomarker of cancer cachexia in multiple myeloma patients(Reference da Cunha Júnior, Silveira and Takahashi7). Body roundness index (BRI) was a new anthropometric index developed to predict both body fat and the percentage of visceral adipose tissue(Reference Rico-Martín, Calderón-García and Sánchez-Rey8). BRI maybe a good indicator for predicting fat distribution(Reference Thomas, Bredlau and Bosy-Westphal9). Previous studies have shown BRI revealed superior predictive capacity and significant association with accumulated cardio-metabolic risk factors(Reference Xu, Zhang and Wu10) than BMI and waist circumference (WC), was associated with hypertension and prehypertension in nonobese Chinese people(Reference Liu, Qian and Li11) and could detected insulin resistance among adults without diabetes(Reference Feng, He and Chen12).
Although BMI is the most used in clinical practice, BRI can provide additional value for CVD(Reference Wu, Yu and Xu13). As we have known, BMI and WC had J-shaped associations with overall mortality and most specific causes of death(Reference Bhaskaran, Dos-Santos-Silva and Leon14–Reference Song, Hong and Sung17) in without overt CVD or general population. The fact that depression, self-harm and interpersonal violence showed the strongest inverse associations with low BMI may the reason for raised risks of many outcomes in low BMI. Depression and related diseases leading to appetite suppression over a long time period could partly explain low BMI and high mortality(Reference Bhaskaran, Dos-Santos-Silva and Leon14).
BRI has shown its feasibility to identify CVD and mortality(Reference Xu, Zhang and Wu10,Reference Maessen, Eijsvogels and Verheggen18) . Nevertheless, previous data are mostly derived from single-centre studies, with relatively small sample size and short follow-up. Yet, the value of BRI in predicting cardiovascular mortality and all-cause mortality from a general US population has been less explored. Therefore, this study aims to investigate the association between BRI and all-cause mortality and cardiovascular mortality in general population by using a large-scaled population-based cohort study conducted in USA.
Methods
Study population
The National Health and Nutrition Examination Surveys (NHANES) were sponsored by the Centers for Disease Control and Prevention to assess the health status of USA citizens. We included a total of 47 356 participants from the NHANES 1999–2014 with age ≥18 years. Exclude criteria were pregnant at exam (n 1539), missing height, weight or WC data (n 4806) and missing follow-up data (n 52). After applying the criteria, we enrolled 40 959 participants for final analysis (Fig. 1). The survival status of participants was followed up to 31 December 2015. The NHANES study protocol was approved by the Institutional Review Board of the Centers for Disease Control and Prevention. All participants signed informed consent.
Study cohort

Data collection
Questionnaires were collected by a standardised manner at baseline to acquire demographics information (age, gender and race), smoking status, personal medical history (hypertension, CVD (CAD) and diabetes) and medication history (antihypertensive drugs, hypoglycaemic agents, lipid-lowering drugs and antiplatelet drugs). Physical assessments were performed to examine height, weight, WC, systolic blood pressure (SBP) and diastolic blood pressure (DBP). Body weight and height were taken with participants barefoot and in light clothing and measured to the nearest 0·1 kg and 0·1 cm, respectively. WC was measured with an inelastic tape to the nearest 0·1 cm at a midpoint between the bottom of the rib cage and the top of the iliac crest, following exhalation. BMI was calculated using weight (kg) divided by the square of height (m2). BRI = 364·2-365·5 ×
 $$\sqrt {{{1 - {{\left( {WC/2\pi } \right)}^2}} \over {{{\left( {0.5{\mkern 1mu} {\rm{Height}}} \right)}^2}}}} $$
(Reference Thomas, Bredlau and Bosy-Westphal9). BRI was divided in quartiles in some data analyses.
$$\sqrt {{{1 - {{\left( {WC/2\pi } \right)}^2}} \over {{{\left( {0.5{\mkern 1mu} {\rm{Height}}} \right)}^2}}}} $$
(Reference Thomas, Bredlau and Bosy-Westphal9). BRI was divided in quartiles in some data analyses.
Blood sample was collected in the morning, after 8 h empty in the evening, total cholesterol, TAG, LDL-cholesterol, HDL-cholesterol, fasting blood glucose, estimated glomerular filtration rate (eGFR). Hypertension was defined as the examined SBP ≥ 140 mmHg or/and DBP ≥ 90 mmHg, confirmed to be taking antihypertensive medications, or self-reported history of hypertension(Reference Chobanian, Bakris and Black19). Diabetes was defined as fasting blood glucose ≥ 126 mg/dl, self-report, haemoglobin A1c (HbA1C) ≥6·5 % or using hypoglycaemic drug(20). eGFR was computed using modification of diet in renal disease formula(21).
Clinical outcome
Death cases from all-cause, CVD or cerebrovascular disease until 31 December 2015 were the primary outcomes. Mortality data were extracted from the 1999–2014 NHANES public-use linked mortality files. We examined the time from enrollment to mortality or censoring. International Classification of Diseases, Tenth Revision codes (I00–I09, I11, I13, I20–I51) were used to define cardiovascular mortality. Participants who were not matched with any mortality records were considered alive throughout the follow-up period.
Statistical analysis
Continuous variables were expressed as mean ± sd for normally distributed variables or median (interquartile range) if the data were not normally distributed. Categorical variables were presented as number (n) and percentage (%). The ANOVA, Kruskal–Wallis H-test or χ 2 tests were used to assess differences according to baseline BRI (0·68∼3·58, 3·59∼4·87, 4·88∼6·38 and 6·39∼23·48) in quartiles. Multivariate Cox regression analysis was used to estimate adjusted hazard ratio (HR) and 95 % CI for mortality according to baseline BRI in quartiles. Model I was adjusted for none, and model II was adjusted for age, gender and race. Age, gender, race, smoking, SBP, DBP, eGFR, total cholesterol, HDL-cholesterol, comorbidities (hypertension and diabetes) and medicine use (antihypertensive drugs, hypoglycaemic agents, lipid-lowering drugs and antiplatelet drugs) were included in the model III. Standardized Kaplan–Meier (KM) curves and Log rank test were used to perform survival analysis between BRI and all-cause mortality and cardiovascular mortality. The association between BRI and all-cause mortality and cardiovascular mortality was then examined by multivariate adjusted Cox restricted cubic spline regression models and used a generalised additive model to explore the nonlinear relationship between BRI and mortality. If nonlinear relationships were identified, we used two-piecewise linear regression models to elucidate how the associations differed by the cut-off value. The cut-off value was estimated by trying all possible value and choosing the cut-off point with highest likelihood. R version 3.3.2 (R Foundation for Statistical Computing) was used for all statistical analyses.
Results
Baseline characteristics
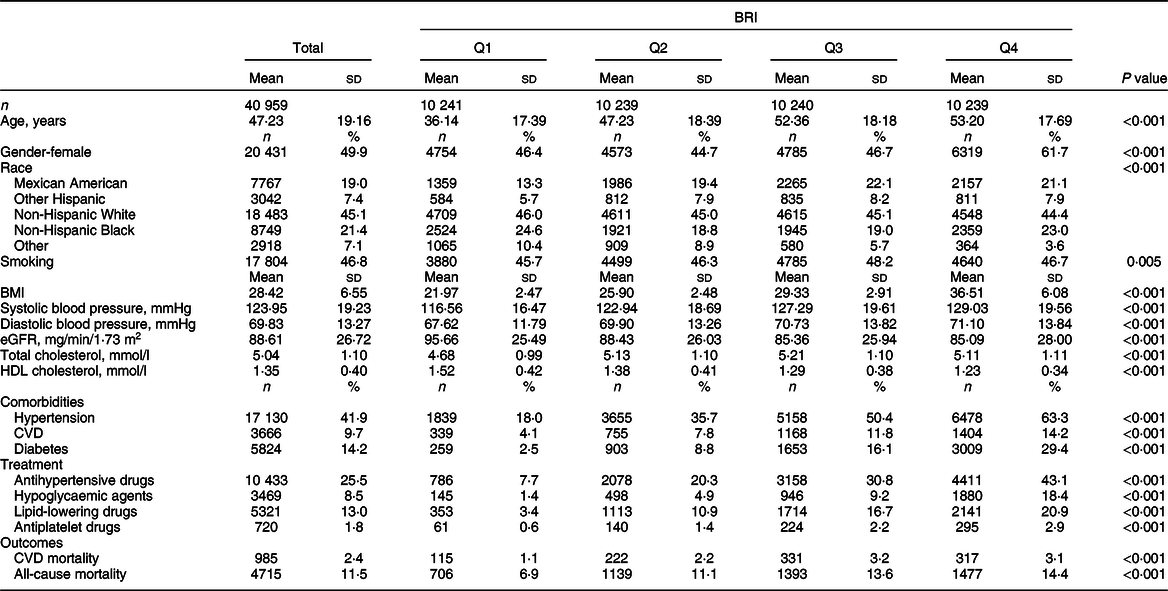
The baseline characteristics of the cohort study according to BRI in groups are shown in Table 1. In total, 40 959 patients (49·9 % females) were included in the current analysis with the mean age of 47·23 ± 19·16 years. Of these, 17 804 (46·8 %) participants were smokers, 17 130 (41·9 %) with hypertension, 3666 (9·7 %) with CVD and 5824 (14·2 %) with diabetes. The mean BMI, BRI, SBP, DBP, total cholesterol, HDL-cholesterol and eGFR were 28·42 ± 6·55 kg/m2, 5·20 ± 2·24, 123·95 ± 19·23 mmHg, 69·83 ± 13·27 mmHg, 5·04 ± 1·1 mmol/l, 1·35 ± 0·4 mmol/l and 88·61 ± 26·72 mg/min/1·73 m2.
Baseline characteristics

eGFR, estimated glomerular filtration rate; BRI, body roundness index.
Q1:0·68∼3·58, Q2:3·59∼4·87, Q3:4·88∼6·38, Q4:6·39∼23·48.
Values are mean with sd or number with percent.
Hazard ratios of body roundness index for all-cause mortality and cardiovascular mortality risk
During a median follow-up of 92 months, 4715 participants died from any cause, with 985 died of CVD. All baseline variables differed significantly among the BRI groups (all P < 0·05).
Table 2 revealed the estimated HR and CI of BRI for all-cause mortality and cardiovascular mortality. In the non-adjusted model, compared with lowest quartile of BRI, the HR for all-cause mortality from other quartiles were all significantly higher (1·72, 95 % CI (1·57, 1·89), 2·18, 95 % CI (1·99, 2·39), 2·46, 95 % CI (2·25, 2·69), respectively (P for trend < 0·001)). After adjusted age, gender, race, smoking, SBP, DBP, eGFR, HDL, total cholesterol, CVD, hypertension, diabetes, lipid-lowering drugs, antihypertensive drugs, hypoglycaemic agents and antiplatelet drugs in model III, compared with the lowest quartile of BRI, the HR for all-cause mortality from other quartiles were 0·83, 95 % CI (0·75, 0·92), 0·73, 95 % CI (0·65, 0·81) and 0·80, 95 % CI (0·72, 0·89), respectively (P for trend < 0·05), and the HR for cardiovascular mortality from other groups were 0·79, 95 % CI (0·62, 1·00), 0·78, 95 % CI (0·62, 0·99) and 0·79, 95 % CI (0·62, 1·01), respectively (P for trend > 0·05).
Cox regression analysis between body roundness index (BRI) and all-cause mortality and cardiovascular mortality

Data were showed by HR, 95 % CI and P value.
Q1:0·68∼3·58, Q2:3·59∼4·87, Q3:4·88∼6·38, Q4:6·39∼23·48.
Model I adjusted for none.
Model II adjusted for age, gender and race.
Model III adjusted for age, gender, race, smoking, systolic blood pressure (SBP), diastolic blood pressure (DBP), estimated glomerular filtration rate (eGFR), HDL, total cholesterol (TC), CVD, hypertension, diabetes, lipid-lowering drugs, antihypertensive drugs andhypoglycaemic agents, antiplatelet drugs.
In the restricted cubic spline regression models with full adjustment for confounders, the relationships between BRI and all-cause mortality (Fig. 2(a)), cardiovascular mortality (Fig. 2(b)) were U-shaped in general participants (Fig. 2). We performed the comparison of BMI, WC, BRI and a body shape index (ABSI) in Supplemental Fig. S1. It suggested U-shaped association between BMI, BRI and mortality in the population. WC and ABSI did not show obvious U-shaped association in the population.
Spline analyses of body roundness index (BRI) with all-cause (a) and CVD (b) mortality, and the probability distribution histogram is represented in the background. (Spline analyses were adjusted for age, gender, race, smoking, systolic blood pressure (SBP), diastolic blood pressure (DBP), estimated glomerular filtration rate (eGFR), HDL, total cholesterol (TC), CVD, hypertension, diabetes, lipid-lowering drugs, antihypertensive drugs, hypoglycaemic agents, antiplatelet drugs)

The results of two piecewise linear regression model are demonstrated in Table 3. After adjusted for potential confounders, the cut-off values of all-cause mortality and cardiovascular mortality were 4·99 and 3·60, respectively. The results suggested linear association in individuals with BRI < 4·99, and the HR for all-cause mortality was 0·67, 95 % CI (0·60, 0·75), P < 0·001. Similarly, the results suggested linear association in individuals with BRI more than 4·99, and the HR for all-cause was 1·11, 95 % CI (1·05, 1·16), P < 0·001). It was consistent with the U-shaped association in Fig. 2(a). For cardiovascular mortality, the association was linear with BRI < 3·60, the HR and CIs (0·32, 95 % CI (0·18, 0·56)) were significant (P < 0·001). For individuals with BRI more than 3·6, the HR and CI (1·08, 95 % CI (0·99, 1·19)) were no longer statisticallysignificant.
The results of two-piecewise linear regression model for BRI and all-cause mortality and cardiovascular mortality

Data were showed by HR, 95 % CI and P value.
The two-piecewise linear regression model was adjusted for age, gender, race, smoking, SBP, DBP, eGFR, HDL, TC, CVD, hypertension, diabetes, lipid-lowering drugs, antihypertensive drugs, hypoglycaemic agents and antiplatelet drugs.
Kaplan–Meier survival curve for all-cause (a) and cardiovascular (b) mortality by BRI quartiles. Q1:0·68∼3·58, Q2:3·59∼4·87, Q3:4·88∼6·38, Q4:6·39∼23·48

We performed the subgroups analysis for two-piecewise linear regression model for BRI and all-cause mortality and cardiovascular mortality in Supplemental Table S2. The P for interaction between age, gender, smoking and BRI showed no significant. However, the two-piecewise linear regression showed the U-shaped association between BRI and all-cause mortality seemed more obvious in male aged <65 years or smoker.
As showed in Kaplan–Meier survival curves (Fig. 3), there were significant differences in the occurrence of all-cause mortality and cardiovascular mortality (Log rank P < 0·001) among the four groups. Higher BRI was significantly and positively associated with lower survival probability for all-cause mortality (Fig. 3(a)), for cardiovascular mortality, quartile 3 and quartile 4 showed no difference, however, lower than quartile 1 and quartile 2 (Fig. 3(b)).
Discussion
We observed a U-shaped association between BRI and all-cause mortality, with lowest mortality around a BRI of 5, a U-shaped association between BRI and all-cause mortality, with lowest mortality around a BRI of 5. Additionally, we compared the association between BMI, WC, BRI and ABSI and mortality in the population. BMI and BRI showed U-shaped association for mortality. WC and ABSI did not show obvious U-shaped association in the population. BMI does not account for fat distribution. BRI can provide additional value for risk stratification in general population as important indicator for predicting body fat and the percentage of visceral adipose tissue. BRI outperformed WC and ABSI in our study. These results indicated that early reasonable BRI may have important implications for multiple health outcomes, including longevity.
The J-shaped association has been observed between BMI and all-cause mortality from some major studies(Reference Aune, Sen and Prasad22,Reference Global, Di Angelantonio and Bhupathiraju Sh23) , consistent with the U-shaped association we observed. The 20 years cumulative risk of death related to baseline BMI was U-shaped in the elderly(Reference Gulsvik, Thelle and Mowé24).The study has shown that a low BMI was an appreciable independent risk factor of total mortality in the elderly. Associations between high BMI and all-cause mortality have attenuated with age and were stronger in men than in women(Reference Bhaskaran, Dos-Santos-Silva and Leon14), and the strongest associations was found between low BMI and mortality to be in younger people. At higher BMI, all-mortality was attenuated in older individuals. The importance of nutritional reserves in older age has been confirmed. There are controversial on increasing weight in older for the increased risk of reverse causation causing the increased prevalence of obesity-related diseases. Below 22·5–25 kg/m2, the strongest inverse associations with BMI were mainly due to smoking-related respiratory disease (including cancer)(Reference Whitlock, Lewington and Sherliker15). It may the reason for low BMI and mortality in younger people, male and smoker.
Few studies have suggested a U-shaped relationship between BRI and mortality, but others have estimated subjects with higher levels of BRI over time were significantly associated with an increased risk of CVD(Reference Wu, Yu and Xu13). Reverse causality or residual confounding like smoking may partly explain the different results between studies(Reference Bhaskaran, Dos-Santos-Silva and Leon14). Associations between high BRI and all-cause mortality were stronger in aged <65, male or smoker. This is consistent with previous studies major on BMI. In the current population, either BMI or BRI can thus be used to assess the causal relevance of obesity to mortality, and each could well add some predictive information to the other.
Previous studies have shown BRI was associated with cardiovascular risk factors. BRI has been the strongest predictors of hypertension(Reference Adegoke, Ozoh and Odeniyi25). The BRI was correlated with metabolic syndrome (MS) and an effective indicator for the screening of MS in type 2 diabetes mellitus(Reference Liu, Liu and Wu26). BRI was found to have a close relationship with arterial stiffness in overweight and obesity people(Reference Li, Yao and Wu27). Previous study also has shown BRI was the parameter most closely related to the Gensini and SYNTAX scores and to significant CAD(Reference Yalcin, Ozsoy and Karabag28) than body fat percentage, WC and waist/height ratio. BRI has been shown to be associated with hypertension-mediated organ damage, left ventricular hypertrophy and lower limb atherosclerosis, in elderly population(Reference Tang, Zhao and Yu29). Lower limb atherosclerosis was often associated with lower limb pain, fatigue, decreased activity tolerance and muscle atrophy. All of these complains were risk factors for mortality for elderly population. BRI was used to assess the risk of malnutrition among older persons in both sexes(Reference Başıbüyük, Ayremlou and Saeidlou30). Lower BRI usually combined with malnutrition, fatigue, decreased activity tolerance, muscle atrophy, so demonstrated higher risk of all-cause mortality and cardiovascular mortality.
There are some strengths in the study. The large population-based sampling of NHANES is a nationally representative sample of persons living in the USA with age 18 years and over. As more attention has been given to primary health care. Our study has important implications for risk stratification in general population. BRI is complementary to BMI and reflect the development of abdominal obesity or body shape, superior to the WC. Therefore, raising the awareness of the health effects of BRI maybe useful for individual self-health management. There are several limitations to this study. First, despite adjustment for variables that were known or hypothesised to influence or confound the BRI and mortality relationship, we cannot exclude the possibility of residual confounding by unmeasured or unknown factors. Second, we did not conduct multiple-time monitoring of the BRI along the follow-up, which may provide more information. In the future, the association between BRI and CVD (heart failure with preserved ejection fraction or reduced preserved ejection fraction, atrial fibrillation) should be explored. Relationship between BRI, as important indicator for visceral adipose tissue, and circulating levels of inflammatory markers and plausible mechanisms of BRI-induced CVD should be investigated.
Conclusion
The BRI, quantified with widely utilised clinical variables, are associated with all-cause and cardiovascular mortality among a large population of males and females living in the USA. The prognostic capacity of the BRI provides complementary tools to assess the deleterious health effects of dysfunctional body composition. These results suggest the BRI may provide unique insight to visceral adipose tissue dysfunction as it relates to cardiovascular and all-cause mortality. We found a U-shaped association between BRI and all-cause mortality, a nonlinear relationship between BRI and cardiovascular mortality.
Acknowledgements
Acknowledgements: We gratefully acknowledge the contributions of all staffs who work on The National Health and Nutrition Examination Surveys. Financial support: This research was supported by Science and Technology Plan Program of Guangzhou (201803040012), the Key Area R&D Program of Guangdong Province (No.2019B020227005), Guangdong Provincial People’s Hospital Clinical Research Fund (Y012018085), the Fundamental and Applied Basic Research Foundation Project of Guangdong Province (2020A1515010738) and High-level Hospital Construction Project of Guangdong Provincial People’s Hospital (DFJH2020022). Authorship: Z.D. and F.Y.Q. contributed to the conception and design of the study. Z.D. drafted the manuscript. L.X.C. contributed to the acquisition of data, interpretation of data and analysis of data. H.Y.Q. contributed to the interpretation of data and critical revision of the article for important intellectual content. All authors gave final approval of the article. Ethics of human subject participation: The current study was conducted according to the guidelines laid down in the Declaration of Helsinki, and all procedures involving research study participants were approved by the Institutional Review Board of the Centers for Disease Control and Prevention. Written informed consent was obtained from all subjects.
Conflicts of interest:
The authors declared that they have no competing interests.
Supplementary material
For supplementary material accompanying this paper visit https://doi.org/10.1017/S1368980022001768


 Open access