


Introduction
Generalized trust, the belief that most people can be trusted, has long been considered a cornerstone of social cooperation and institutional performance. Societies rich in generalized trust enjoy more effective governance, higher economic growth, and greater civic engagement (Zak and Knack, Reference Zak and Knack2001; Beugelsdijk et al., Reference Beugelsdijk, de Groot and van Schaik2004; Berggren et al., Reference Berggren, Dauntfeldt and Hellström2016; Thompson, Reference Thompson2018; Bjørnskov, Reference Bjørnskov2021). Later studies confirmed that trust contributes to the efficiency of formal institutions and to the legitimacy of public policies (Rothstein, Reference Rothstein2005). Because institutions ultimately rely on citizens’ expectations about the cooperative behavior of others, understanding how such expectations are formed and sustained remains a central question for institutional economics.
Formal education occupies a prominent yet ambiguous position in this debate. Several studies have reported that the more educated express higher levels of generalized trust (Sønderskov and Dinesen, Reference Sønderskov and Dinesen2014; Borgonovi and Burns, Reference Borgonovi and Burns2015; Charron and Rothstein, Reference Charron and Rothstein2016; Zanin, Reference Zanin2017; Kan and Lai, Reference Kan and Lai2021). Education is often regarded as a source of both social and cognitive resources that should, in principle, foster cooperation and confidence in others. Yet the reasons for this association remain contested. Some authors argue that formal education enhances individuals’ ability to interpret others’ motives and behavior, promoting more accurate and less pessimistic expectations about human pro-sociality (Yamagishi, Reference Yamagishi and Cook2001; Knack and Zak, Reference Knack and Zak2002; Rothstein, Reference Rothstein2005; Sønderskov and Dinesen, Reference Sønderskov and Dinesen2014). By broadening people’s worldviews and exposing them to greater social diversity (Uslaner, Reference Uslaner2002; Sapienza et al., Reference Sapienza, Zingales and Guiso2006; Hooghe et al., Reference Hooghe, Marien and de Vroome2012), education may foster cognitive and social skills that reduce systematic errors in judging others’ cooperativeness.
Others emphasize that formal education shapes social environments and peer groups, exposing individuals to settings where cooperative norms are stronger (e.g., Huang et al., Reference Huang, van den Brink and Groot2011). Under this mechanism, the more educated would not be more accurate but would exhibit a systematic positive bias—an over-optimistic view of how pro-social people are. The two mechanisms hence yield opposite predictions. Examining these competing predictions enables us to assess whether existing theories adequately explain how education shapes beliefs about others and trust, or whether the observed link between education and trust (if indeed causal) must be accounted for through alternative mechanisms.
To test these two competing mechanisms, we designed an original online survey in which 800 adult respondents in Spain were asked to estimate how often “lost wallets” are returned in the experiments conducted by Cohn et al., (Reference Cohn, Maréchal, Tannenbaum and Zünd2019) across four countries: Spain, Sweden, the United Kingdom, and Morocco. In those experiments, the likelihood of returning the wallet varied depending on whether it contained no money, a small amount, or a larger amount of money inside (NoMoney, Money, and BigMoney scenarios). Because these provide externally validated measures of actual pro-social behavior under different incentive conditions, they allow us to compare individuals’ beliefs with real outcomes and to quantify both the accuracy and the direction of their errors.Footnote 1 Our design extends Cohn et al. (Reference Cohn, Maréchal, Tannenbaum and Zünd2019) by shifting the focus from behavior to beliefs and by linking belief accuracy to education, a dimension unexplored in prior work. In the empirical analysis, we account for respondents’ socioeconomic status, neighborhood, and other relevant factors such as cognitive reflectiveness, recognizing that cognitive and structural attributes are interrelated and could jointly influence trust-related beliefs.
Our results show that respondents systematically misjudged others’ pro-social behavior: they overestimated the likelihood of wallets being returned in the NoMoney scenario and underestimated it when money was present, in every country. Nearly 70 percent of participants expected honesty to decline across all countries as the amount of money increased, whereas in the original experiments the actual return rates rose across those conditions. At least beyond the secondary level (our focus here), formal education does not correct these errors. Individuals with university or postgraduate degrees are not systematically more accurate in predicting either the levels or the ordering of return rates across scenarios. Nor do we find consistent evidence that higher education produces systematic optimism, except for a modest tendency among postgraduates to expect greater honesty. These findings call into question both the social-intelligence and selection-or-exposure mechanisms. If education correlates with higher generalized trust, this may reflect a more abstract or institutionally grounded form of confidence rather than genuinely more optimistic beliefs about others’ behavior. Understanding these alternative pathways remains an important task for future research.
The rest of the paper is organized as follows. The next section reviews the literature on education and trust and proposes a theoretical framework together with several hypotheses. Section 3 introduces the survey design. Section 4 reports results. Section 5 concludes with a discussion of our findings, policy implications, and some ideas for further research.
Education, institutions, and the formation of generalized trust
Generalized trust, defined, according to Yamagishi (Reference Yamagishi2011: 114), as “the default expectation of another person’s trustworthiness in the absence of information about that person”, has long been viewed as a key condition for social cooperation and economic performance. A large body of research identifies several determinants of generalized trust, ranging from individual and socioeconomic characteristics to broader community, institutional, and cultural contexts. Education, income, and experiences of security or discrimination are among the personal factors most frequently associated with trust, while income inequality, ethnic heterogeneity, and social mobility characterize community environments where trust tends to be lower (Alesina and la Ferrara, Reference Alesina and la Ferrara2002; Helliwell and Putnam, Reference Helliwell and Putnam2007; Bjørnskov, Reference Bjørnskov2006). Institutional quality, civic participation, and perceived fairness in economic exchanges also play a central role (Guiso et al., Reference Guiso, Sapienza and Zingales2004; Gustavsson and Jordahl, Reference Gustavsson and Jordahl2008; Graafland and Lous, Reference Graafland and Lous2019). Recent studies even point to a genetic and evolutionary component (Spörlein et al., Reference Spörlein, Kristen and Schmidt2024), underscoring that both structural and dispositional factors contribute to cross-national variation in trust levels.
Within institutional economics, the relationship between trust and formal institutions has generated a longstanding debate. Elinor Ostrom (Reference Ostrom1990) emphasized that trust is not merely a by-product of institutions but a precondition for their effective functioning. In her framework, cooperative arrangements emerge and persist when individuals share norms of reciprocity and mutual confidence. Trust, in this view, enables collective monitoring and sanctioning that sustain institutional cooperation. In contrast, Oliver Williamson (Reference Williamson1985) treated trust as largely redundant once adequate contractual and governance mechanisms are in place. For him, institutions substitute for trust by mitigating opportunism through credible commitments and enforcement structures. Subsequent research highlights the role of institutional quality in shaping generalized trust. In particular, well-functioning institutions are associated with higher interpersonal trust (Rothstein, Reference Rothstein2005; Camussi and Mancini, Reference Camussi and Mancini2019; Lombardo and Ricotta, Reference Lombardo and Ricotta2022). Higher trust may in turn support compliance and legitimacy, as argued in the broader institutional literature (Rothstein, Reference Rothstein2005).
Education and trust: a complex relationship
A substantial body of research examines the relationship between formal education and generalized trust, often reporting a positive correlation. Early studies emphasized that educational institutions foster trust by promoting civic norms, reducing informational asymmetries, and facilitating interactions across social boundaries (Rothstein, Reference Rothstein2005; Uslaner, Reference Uslaner2002). Sønderskov and Dinesen (Reference Sønderskov and Dinesen2014) suggest that education equips individuals with cognitive tools that improve their assessments of others’ trustworthiness. Charron and Rothstein (Reference Charron and Rothstein2016) add that education strengthens trust primarily in contexts with high institutional quality, pointing to an interaction between individual resources and governance environments. Borgonovi and Burns (Reference Borgonovi and Burns2015) argue that education enhances cognitive skills such as literacy and numeracy, which are positively associated with trust. Other studies, such as Zanin (Reference Zanin2017) and Kan and Lai (Reference Kan and Lai2021), also confirm that higher educational attainment is associated with greater interpersonal trust and civic engagement. Complementing this evidence on interpersonal trust, recent cross-country results indicate that education is generally associated with greater trust in public institutions (OECD, 2024).
However, evidence from studies exploiting exogenous variation in education is more mixed. Oskarsson et al. (Reference Oskarsson, Dinesen, Dawes, Johannesson and Magnusson2017) used a natural experiment comparing identical twins, who share the same genes and family background but may differ in their educational attainment. They found that the effect of education on generalized trust disappears when controlling for these twin-specific factors. Yang (Reference Yang2019), using a regression discontinuity design based on the 1972 British compulsory schooling reform, finds that the causal effect of education on trust is small and statistically insignificant. Österman (Reference Österman2021), drawing on European schooling reforms, reaches similar conclusions: education as such has no consistent effect on generalized trust, although less rigid school tracking fosters it, possibly through increased intergroup contact. These findings echo the earlier results of Bjørnskov (Reference Bjørnskov2006), who found no significant effect of education or average years of schooling on trust once controlling for income inequality, religion, and ethnic diversity. At the same time, Bellemare and Kröger (Reference Bellemare and Kröger2007) report that more educated individuals display higher trust in experimental games, even though less educated participants tend to behave more trustworthily.
These apparently conflicting findings suggest that formal education and trust may be correlated for reasons that are not purely causal. Family background, early socialization, and genetic predispositions may influence both educational attainment and interpersonal trust (Oskarsson et al., Reference Oskarsson, Dinesen, Dawes, Johannesson and Magnusson2017). Likewise, institutional context moderates the link between education and trust: the same educational experience may foster civic cooperation in one setting and skepticism in another, depending on institutional quality and social equality (e.g., Wu, Reference Wu2021). Against this backdrop, it becomes essential to clarify through which mechanisms education might shape beliefs about others and, in turn, generalized trust.
Theoretical framework and hypotheses
This paper contributes to the literature by testing two prominent theoretical pathways through which education may influence trust. Both pathways rest on the premise that individuals’ beliefs about pro-social behavior (PSB beliefs) act as mediators between education and trust. A vast experimental and behavioral economics literature—most notably those using the Trust Game paradigm—supports the idea that expectations about others’ pro-sociality guide trust decisions (Berg et al., Reference Berg, Dickhaut and McCabe1995; Johnson and Mislin, Reference Johnson and Mislin2011; Sapienza et al., Reference Sapienza, Toldra-Simats and Zingales2013; Kovacs et al., Reference Kovacs, Dunaiski, Galizzi, Grimalda, Hortalá-Vallvé, Murtin and Putterman2024). For instance, Yamagishi et al. (Reference Yamagishi, Mifune, Li, Shinada, Hashimoto, Harita, Miura, Inukai, Tanida, Kiyonari, Takagishi and Simunovic2013) show that trustors’ choices depend strongly on their beliefs about trustees’ fairness, and that individuals who anticipate greater pro-sociality from others are themselves more likely to act cooperatively. Although PSB beliefs and generalized trust are distinct constructs, they are empirically correlated (Banerjee et al., Reference Banerjee, Galizzi and Hortalá-Vallvé2021; Kovacs et al., Reference Kovacs, Dunaiski, Galizzi, Grimalda, Hortalá-Vallvé, Murtin and Putterman2024).
The first theoretical pathway—the social intelligence hypothesis—argues that education improves individuals’ cognitive capacity to interpret others’ motives and behaviors. By enhancing certain facets of social intelligence such as reasoning skills and theory-of-mind capacities (Knack and Zak, Reference Knack and Zak2002; Yamagishi, Reference Yamagishi and Cook2001), education may help individuals to form more accurate mental models of social interactions. In this sense, education helps counteract the general pessimism about human pro-sociality found in studies such as Leibbrandt et al. (Reference Leibbrandt, López-Pérez, Pinter, Rodríguez and Santamaria2023). More educated individuals should thus make smaller prediction errors about others’ cooperative behavior. Since trust is partly based on these beliefs (Yamagishi et al., Reference Yamagishi, Mifune, Li, Shinada, Hashimoto, Harita, Miura, Inukai, Tanida, Kiyonari, Takagishi and Simunovic2013; Kovacs et al., Reference Kovacs, Dunaiski, Galizzi, Grimalda, Hortalá-Vallvé, Murtin and Putterman2024), greater education would lead to higher levels of trust. Formally:
H1: Individuals with higher education levels form more accurate beliefs about others’ pro-social behavior. As an implication, more educated people predict better the direction and extent of change in PSB across different scenarios, e.g., when the monetary cost of pro-sociality increases.
A related implication follows from intergenerational transmission: if parental education improves the accuracy of parents’ social perceptions and moral guidance, it may also enhance their children’s social intelligence. Additionally, there is typically a correlation between an individual’s education level and that of their parents (Hertz et al., Reference Hertz, Jayasundera, Piraino, Selcuk, Smith and Veraschchagina2008), further supporting the potential link between parental education and their children’s social intelligence. Hence:
H2: Higher parental education levels are associated with greater accuracy in predicting others’ pro-social behavior.
The second pathway—the selection or exposure hypothesis—emphasizes social environments rather than cognitive accuracy. More educated individuals are typically embedded in networks of similarly educated peers, who may display stronger cooperative norms and greater civic engagement. This selective exposure could lead the educated to over-generalize from their experiences and develop over-optimistic beliefs about others’ trustworthiness (Huang et al., Reference Huang, van den Brink and Groot2011; see also Glanville et al., Reference Glanville, Andersson and Paxton2013 on how informal social ties enhance trust). In this case, education fosters bias rather than accuracy:
H3: Higher education levels increase the tendency to overestimate the prevalence of pro-social behavior.
It must be stressed that belief miscalibration, whatever its causes, has important implications for institutional performance and compliance. If uneducated people hold overly pessimistic PSB beliefs, for instance, this is likely to undermine generalized trust—a key determinant of effective government and policy legitimacy (Zak and Knack, Reference Zak and Knack2001; Rothstein, Reference Rothstein2005). Low perceived trust, in turn, induces institutions to rely more heavily on monitoring and sanctions, thereby increasing transaction and compliance costs. In the terms of Denzau and North (Reference Denzau and North1994), institutions rest on shared mental models that make others’ behavior predictable and norm-guided. When those beliefs become systematically inaccurate, the shared models that sustain ideologies and institutional rules are distorted, weakening their capacity to coordinate expectations and reduce uncertainty, understood here as the unpredictability of others’ behavior and the resulting outcomes when information is incomplete and reliable probabilities are hard to specify.
Survey design
The study was conducted using the Netquest Online Survey Software (https://www.netquest.com/encuestas-online-investigacion) with a sample size of N = 800 Spanish respondents, with residence in Madrid. Each participant received from Netquest a lump sum payment of 1.93 Euros, and the survey took an average of 11.78 minutes. Participants were recruited through Netquest. After indicating their age and gender, respondents moved on to an estimation task. Specifically, respondents were given the following information:
Imagine the following situation in a large city in some country. Person A, a resident of the city, has lost in the street a transparent plastic card holder with three business cards, a grocery list, and a key. The cards include A’s full name and email. Person B, who does not know A, finds the card holder.
Scenario 1 (NoMoney henceforth): What do you think is the probability that B will contact A to return his card holder? Or to put it in equivalent terms: of every 100 B inhabitants of the city who could find the card holder, how many would contact A?
Every respondent had to answer to this scenario with an integer from 0 (nobody) to 100 (all), both inclusive, and for each of the following 4 countries, presented simultaneously: (i) Spain, (ii) United Kingdom, (iii) Morocco, and (iv) Sweden. We chose these countries because, according to the data from Cohn et al. (Reference Cohn, Maréchal, Tannenbaum and Zünd2019), they display different levels of return rates (Sweden comes first, then UK, then Spain, and finally Morocco). Assuming that people anticipate the ranking, therefore, the selection of countries allows us to test Hypotheses 1 to 3 above at different levels of expected pro-sociality. In addition, Spanish respondents are likely to be relatively familiar with the chosen countries but at the same time, these countries are not homogeneous from a cultural point of view; that is, our selection is relatively diverse. Including Spain, further, was important to check for potential differences between own country and a foreign one. Note also that Cohn et al. (Reference Cohn, Maréchal, Tannenbaum and Zünd2019) only run the BigMoney treatment (see below) in Poland, UK, and the USA, which somehow restricted our choices. After introducing their PSB beliefs in NoMoney, respondents faced Scenario 2 (Money), which was identical to Scenario 1 except that in this case the cardholder contained also 10 Euros (or an amount of equivalent purchasing power in the relevant country). In an additional Scenario 3 (BigMoney), finally, the cardholder contained 70 Euros.
Several clarifications follow. In this online survey, to start, respondents were not incentivized for accuracy. Leaving financial and practical considerations aside, there are four reasons for this choice. First, eliciting unincentivized beliefs is informative in itself, as many real-world beliefs—particularly those about social behavior—are formed and maintained without any explicit reward for accuracy. Testing our hypotheses in this context seems a must. Second, we do not expect that providing monetary incentives would systematically alter the relationship between education and belief accuracy regarding pro-social behavior. In this regard, therefore, we do not think that the lack of incentives creates a confound. Third, although the absence of incentives may increase individual-level noise, our large sample (N = 800) ensures that this does not affect the precision of our aggregate estimates. It is worth noting, fourth, that prior experimental evidence further suggests that incentives may reduce variability but do not eliminate systematic belief biases, particularly in domains involving social preferences (see Blanco et al., Reference Blanco, Engelmann, Koch and Normann2010; Charness et al., Reference Charness, Gneezy and Halladay2016). In summary, we do not believe that a lack of incentives undermines the relevance of the patterns we document. This is further supported by a within-sample diagnosis reported at the end of Section 4.
Our choice of a single presentation order for Scenarios 1–3 also merits justification. We acknowledge that order effects cannot be entirely ruled out. The critical question is whether such effects compromise the tests of Hypotheses 1–3. If they did, we would expect highly educated participants to exhibit the greatest accuracy—particularly in discerning the direction of change in PSB—in our “increasing” sequence, since natural reference points reinforce performance. Crucially, our post hoc analyses show that Hypotheses 1–3 are rejected even under this conditionally favorable ordering. Thus, introducing additional sequences would likely yield limited incremental value. Notably, Cohn et al. (Reference Cohn, Maréchal, Tannenbaum and Zünd2019) also conducted an online survey in the United States (N = 299) to elicit lay beliefs about return rates in each of the three possible scenarios (NoMoney, Money, and BigMoney), presented simultaneously to respondents. Despite presenting scenarios sequentially (rather than simultaneously, as Cohn et al., Reference Cohn, Maréchal, Tannenbaum and Zünd2019 did), we observe a similar pattern: roughly two-thirds of respondents anticipate a decline in return rates as stakes rise (see Section 4). Future research could, however, systematically vary presentation order to further validate these findings.
For additional clarification, it must be noted that the three scenarios in Cohn et al. (Reference Cohn, Maréchal, Tannenbaum and Zünd2019) are more complex than ours. In their study, B is not a random person but an employee at the counter of either a (i) bank, (ii) theater, museum, or other cultural establishment, (iii) post office, (iv) hotel, or (v) police station, court of law, or other public office. Our framing is therefore more concise and cognitively simpler, a relevant issue in online surveys. A downside is that this simplification may lead to underestimation, i.e., estimates lower than the actual return rates presented in Cohn et al. (Reference Cohn, Maréchal, Tannenbaum and Zünd2019), if respondents assume that a random person is less pro-social than the average employee from categories (i) to (v). In this regard, we note two things. First, underestimation is arguably inessential for testing whether educated respondents predict better the direction of change of PSB across scenarios.Footnote 2 Second, regarding accuracy, if educated respondents anticipate a substantially larger gap between a random person and employees from (i) to (v) compared to less educated respondents, we should consistently observe underestimation by the former group in all scenarios. This is a point that we examine below, finding little evidence to support it.
When respondents completed the BigMoney Scenario, they moved to a brief questionnaire where they indicated, in this order: (a) their major (if any), (b) their father’s and mother’s education level, (c) the zip code of the respondent’s place of residence during most of the last 5 years (as a proxy for income), (d) their religiosity on a scale from 0 (not religious) to 10 (very religious), (e) their political ideology, again on a scale from 0 (far left) to 10 (far right), with 5 as the theoretical center, and (f) their answer to the general trust question (“Generally speaking, would you say that most people can be trusted or that you can’t be too careful in dealing with people?”), from 0 to 10. Regarding this last question (f), respondents also indicated the period of their lives most influential in the formation of such beliefs; specifically, they introduced an age interval of at most 5 years. Respondents’ education levels were obtained from Netquest.
Continuing with the questionnaire, respondents also indicated their optimism about future prospects (1 = absolutely to 5 = not at all) and described their current occupation. The survey concluded with an expanded Cognitive Reflection Test (CRT; Frederick, Reference Frederick2005), including the three classical items plus Simon’s question (Toplak et al., Reference Toplak, West and Stanovich2014). In dual-process theories (Kahneman, Reference Kahneman2011), the CRT captures an individual’s willingness to engage in reflective rather than intuitive thinking. Controlling for life optimism and cognitive reflectiveness is theoretically motivated by prior research linking both traits to generalized trust. Uslaner (Reference Uslaner and Uslaner2018) emphasizes that optimism about the future is a psychological foundation of trust. Similarly, Hooghe et al. (Reference Hooghe, Marien and de Vroome2012) found that the education–trust association largely reflects differences in cognitive ability and occupational prestige, while Corgnet et al. (Reference Corgnet, Espín, Hernán-González and Kujal2016) showed that individuals with higher cognitive reflection are more likely to trust others in experimental settings.
Including our battery of controls was essential to ensure that any observed association between education and belief accuracy or optimism is not confounded by broader socioeconomic or attitudinal factors. As we have noted, for instance, we accounted for respondents’ income level, religiosity, and political ideology—variables that prior studies have linked to generalized trust (Alesina and la Ferrara, Reference Alesina and la Ferrara2002) and perhaps pro-social attitudes (but see Schubach and Thielmann, Reference Schubach and Thielmann2024). Controlling for these factors allows us to isolate, as far as possible within an observational framework, the specific contribution of education to belief formation. While we cannot claim causality, these robustness checks enhance confidence in the internal validity of our findings. Given that our results contradict the two theorized mechanisms, however, their consistency across specifications reinforces the conclusion that education’s link to trust is unlikely to operate through improved social intelligence or systematic optimism, but rather through other institutional or normative pathways explored in Section 5.
Data analysis
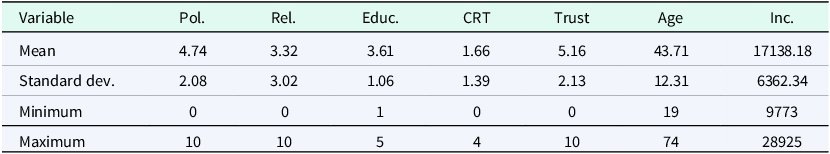
We begin by characterizing our sample, noting first that it was 49.88 percent female. In what regards education levels, we have the following distribution: (1) less than secondary (0.5%), (2) secondary (21.62%), (3) university, non-completed (15.38%), (4) university, completed (41.3%), (5) master’s or higher (21.12%). All “higher education” effects are thus estimated relative to the secondary-educated group. Because our sample obviously over-represents university and postgraduate holders, our findings primarily reflect contrasts within a relatively advantaged, online-survey population and may not generalize to the minority without secondary education or those less familiar with online surveys. Other variables are presented in Table 1.
Summary statistics

Note: Pol = Political ideology, Rel. = Religiosity, Educ. = Education level, from less than secondary (1) to master’s degree or higher (5), see above; CRT = Number of correct responses, Inc. = Average annual income in Euros in the respondent’s postal district (given zip code).
Trust and PSB beliefs
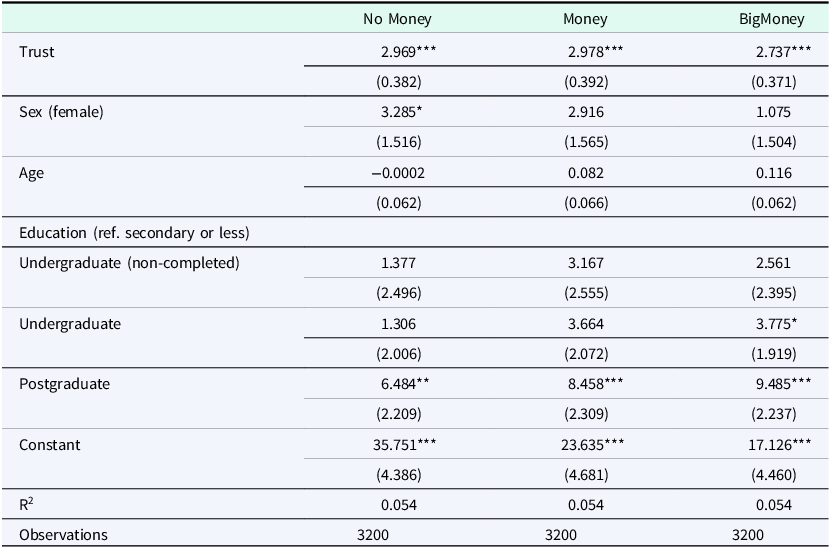
Before we explore accuracy (4.2) and its determinants (4.3), it is worth noting that our three scenarios give evidence in line with Yamagishi et al. (Reference Yamagishi, Mifune, Li, Shinada, Hashimoto, Harita, Miura, Inukai, Tanida, Kiyonari, Takagishi and Simunovic2013) and our “mediation” premise (see Section 2): trust and PSB beliefs are strongly correlated. In Table 2 we report the results from three OLS regressions, one per scenario. The Y-variable is the respondent’s estimation (PSB belief), stated as a percentage (0–100), and the independent variables include her level of general trust, sex, education level, and age. Education is measured as a categorical variable with the lowest level of education —secondary or less— as reference category; the table shows the coefficients for three levels of education: undergraduate (non-completed), undergraduate, and postgraduate (Master’s degree or higher). In line with mediation, we always observe a positive relationship between the estimation and general trust, significant at the 0.1% level.Footnote 3 Note that OLS with clustered, heteroskedasticity-robust standard errors is appropriate given the nature of the Y-variable, offering also two advantages: coefficients are directly interpretable as percentage-point differences in predicted return rates, and the same linear specification can be applied across scenarios, enhancing comparability.
Trust and the estimation of the rate of return (PSB beliefs) are strongly correlated

Note: Clustered standards errors at the individual level. ***p < .001; **p < .01; *p < .05.
Multicollinearity is modest: for each of the three models, the mean VIF is 2.10, and it is lower in our variable of interest: undergraduate non-completed (VIF = 1.55), undergraduate (VIF = 2.19) and postgraduate (VIF = 2.07). We also re-estimated these models using post-stratification weights based on Spain’s education shares (CIS barometer 3469); results are essentially unchanged (see online Appendix I, Table A1).Footnote 4 This confirms that our findings are not driven by the sample’s educational composition and remain robust when adjusted to the national distribution.
Our results are also replicated if we run the regressions at the country level (results available in Appendix I, Tables A2 to A5). In short, trustful people always predict relatively higher return rates, in line with our premise that trust depends (partly) on PSB beliefs. A systematically significant (and positive) effect is also observed for postgraduate education (but only for this level), a point to be commented in more detail in 4.3. Given potential cohort effects in educational experiences and trust formation, we tested for age–education interactions. Our results above are robust and all interaction terms (not shown in Table 2) are non-significant, except in the BigMoney model, where Undergraduate has a small significant effect ( $\beta = 0.364,\;SE = 0.178,\;p = 0.042$
).
$\beta = 0.364,\;SE = 0.178,\;p = 0.042$
).
Accuracy
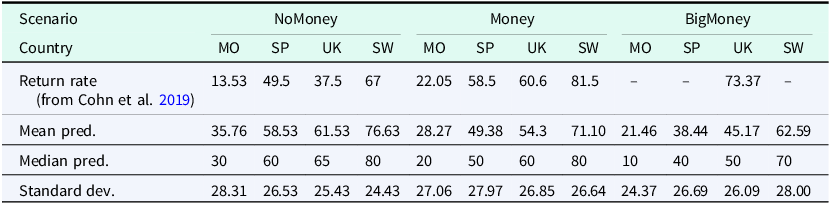
Table 3 depicts the mean and median PSB beliefs in each scenario for each country; the countries are ordered from lowest to highest expected return rate in NoMoney. For comparison, we also indicate the actual return rate (if available), taken from Cohn et al. (Reference Cohn, Maréchal, Tannenbaum and Zünd2019)—recall that the UK was the only country among the four considered where the BigMoney treatment was implemented. Additionally, the last row shows the standard deviation of the respondents’ estimations for each scenario. Several observations follow. Comparing actual and expected rates, first, the median (and mean) respondent (i) systematically overestimates return rates in NoMoney, (ii) is relatively accurate (though with a slight tendency to underestimate) in Money, and (iii) significantly underestimates the UK return rate in BigMoney. In short, there appears to be a shift from idealism to cynicism as the stakes increase.
Actual return rates, mean, and median prediction (PSB belief) by country

Note: MO = Morocco, SP = Spain, UK = United Kingdom, SW = Sweden. NoMoney: of every 100 inhabitants of the city who could find the card holder, how many would contact A if the cardholder contains no money? Money: Same as NoMoney, except that the cardholder contains 10 Euros (or equivalent amount in local currency). BigMoney: Same as NoMoney, except that the cardholder contains 70 Euros.
Second, respondents fail to anticipate the increase in actual return rates observed in all the selected countries from NoMoney to Money, and in the UK from Money to BigMoney. In fact, a decreasing trend is observed in beliefs across all countries as the monetary cost increases, i.e., from NoMoney to BigMoney. Specifically, when moving from NoMoney to Money, 50.12% of respondents believe that fewer people will return the wallet, while only 4.38% believe that the return rate will increase (the remaining 45.50% made the same estimation). In turn, 61.4% of respondents anticipated a lower return rate from Money to BigMoney, with only 3.34% believing that the return rate will be higher (the remaining 33.25% made the same estimation).
In other terms, 35.78% and 69.19% of the respondents respectively exhibit a strictly and weakly decreasing trend across all countries, 0.56% and 2.59% respectively show a strictly and weakly increasing trend, 21.66% predict the same return rate across all scenarios for any country, and the rest (6.51%) display a non-monotonic pattern. Consistent with our findings, we note that most respondents (64%) in the online survey conducted by Cohn et al. (Reference Cohn, Maréchal, Tannenbaum and Zünd2019) incorrectly expected return rates to fall as monetary stakes increased,Footnote 5 while only 18% predicted the correct positive pattern.
In short, most people wrongly believe that a law of demand applies in our scenarios, i.e., that PSB decreases with its monetary cost, whereas the opposite is actually true (people are more likely to return a wallet the costlier it is). This mental model partly explains the shift from idealism or overestimation (the modal case for NoMoney) to (slight) underestimation observed when moving from NoMoney to Money.
Although Table 3 offers some insight on the extent to which respondents’ guesses deviate from actual return rates, third, aggregate figures hide substantial heterogeneity. We define a respondent’s error in some scenario (and country) as the difference between her estimation of the return rate, and the corresponding actual value (if available). The box plots in Figure 1 represent the distribution of errors for each of the scenarios; the countries are ordered as in Table 2 above. Again, we observe overestimation in the NoMoney scenario, which tends to be reversed in the rest of scenarios. Another point that is apparent from Figure 1, is that the respondents’ errors are not only (often) biased, but also relatively substantial. Note also that the error rates are not systematically smaller (or more compressed) when the (Spanish) respondents evaluate Spain, rather than the other countries (for more evidence in this regard, consult Tables 4 and 5 below).
Distribution of errors in each scenario, for each country.

Determinants of error size

Note: Dependent variable: error in absolute terms. Clustered standard errors at the individual level. *** p < .001; ** p < .01; * p < .05.
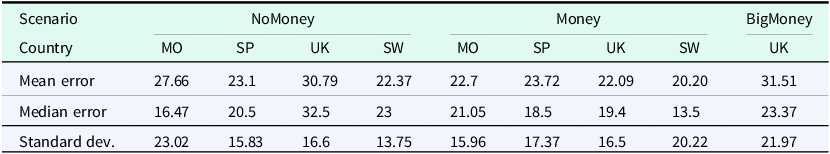
For more detail on the error size, Table 4 shows average and median values of the error, in absolute value, for each scenario (and possible country). To give some context, consider scenarios NoMoney and Money for Spain. Since the actual return rates are 49.5 and 58.5, respectively, and respondents’ responses take a value from 0 to 100, it follows that the maximum possible error is 49.5 in NoMoney and 58.5 in Money. These figures can be compared with the actual median errors, which are 20.5 and 18.5 respectively, thus representing around 40 and 32 percent of the corresponding maximum errors. For other countries, the errors also tend to be arguably significant.
Aggregate statistics of accuracy

Note: UK = United Kingdom, MO = Morocco, SP = Spain; SW = Sweden.
Result 1: People overestimate PSB in every country when it is monetarily costless but tend to underestimate it otherwise—possibly due to an inaccurate belief in a “law of demand.” Median errors are arguably substantial, compared with the maximum possible error.
The determinants of accuracy and over-estimation: the role of education
We present here several predictions relevant to our experimental setting, derived from the hypotheses in Section 2, and test them using a regression analysis. The first prediction derives from Hypothesis 1, claiming that more educated people anticipate better the return rate trend in any country, i.e., the direction of change of PSB across scenarios. From an institutional-economics perspective, whether education improves belief calibration is important to determine how societies economize on enforcement versus rely on social norms.
Prediction 1: A higher education level predicts less frequent belief in a law of demand in PSB (i.e., higher stakes, then strictly lower return rates).
Evidence: As the percentage of people with an increasing trend from NoMoney to BigMoney across all countries is very small (0.97%), we cannot find any meaningful connection between a higher education level and less frequent belief in a law of demand in PSB. Alternatively, we have estimated two logit regressions with value 1 for those who make an estimation consistent with a law of demand in PSB for at least one of the countries and value 0 for those who do not. As independent variables, we include the respondent’s trust, sex, age, education (as in all models, measured as a categorical variable with secondary education or less as reference category), optimism, ideology, religiosity, CRT score, district of residence in Madrid, income (as approximated by average annual income in postal district of residence),Footnote 6 and mother’s and father’s education level—results are unchanged if we exclude parents’ education from the models. We also add dummies for the country considered in the scenario (Spain is the reference country), being unemployed, as well as the respondent’s major (0 = any field but Business and Economics, Humanities, Social Sciences and Psychology, 1 = Business and Economics, 2 = Humanities, Social Sciences, and Psychology). The results (see Table A6 in Appendix I) show that people with postgraduate education are less likely to believe in a law of demand in PSB from NoMoney to Money, while those with (non-completed) undergraduate education are more likely to believe in a law of demand from Money to BigMoney. Given these non-systematic findings, the evidence for Prediction 1 (and hence Hypothesis 1) appears to be rather limited.
Note that the effects of schooling on social cognition may vary by field of study. Business and humanities training, for instance, emphasize distinct models of reasoning and human motivation that could affect belief calibration in opposite ways. In spite of this, the respondent’s major and its interactions with education level are not statistically significant in any logit model, suggesting that the content and orientation of education, at least as captured by broad disciplinary categories, do not drive belief accuracy.
While we cannot say that more educated people estimate systematically better the ordering of the scenarios according to the return rate, they may at least commit systematically fewer substantial mistakes, as Hypothesis 1 broadly states. This is what we explore in the next
Prediction 2: A higher education level leads to relatively lower errors, in absolute value.
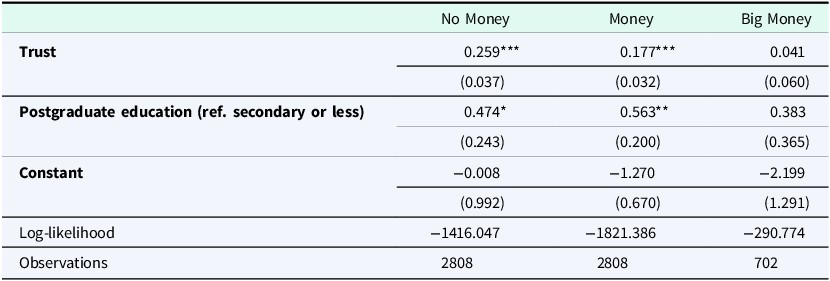
Evidence: To explore this question, we run several regression models. First, we estimate three OLS regressions, one for each scenario, where the dependent variable is the error of each participant’s estimation (i.e., the difference between her estimation and the actual return rate), in absolute value. We include all the independent variables mentioned in the analysis of Prediction 1 above. For NoMoney and Money, notice that the regressions include the errors for all countries, whereas for BigMoney, only the errors for the UK are included. Main results are reported in Table 5—for the complete estimates, see table A7 of Appendix I.
Regarding education in the NoMoney scenario, none of the education levels differ significantly from the secondary education baseline. Postgraduate education shows a positive but non-significant coefficient (p = 0.054), thus contradicting Prediction 2. Likewise, undergraduate education does not reduce errors in either Money or BigMoney. In contrast, postgraduate education significantly decreases errors in these two scenarios (p = 0.030 and 0.018, respectively). This pattern likely reflects that estimates increase with education in all scenarios (Table 2). Because few respondents increase their estimates from NoMoney to BigMoney (see Section 4.2), it follows that more educated individuals also adjust their expectations downward—but possibly less sharply than others. As actual return rates rise across scenarios, this slower adjustment mechanically produces smaller errors among the highly educated. Still, education reduces errors only at the top level, i.e., beyond undergraduate.
A relatively similar adjustment mechanism possibly explains the results in Table 5 for Trust. Note that trust is positively associated with the error size in NoMoney and negatively associated in Money and BigMoney. This apparent inconsistency is possibly explained by two factors: (a) trust increases estimations in all scenarios, as we noted in 4.1, (b) most people overestimate the actual rate of return in NoMoney but under-estimate it in Money and BigMoney, as they fail to anticipate the increase in return rates across scenarios. In short, high trust leads to inflated estimations in NoMoney but, as estimations and actual rates move in opposite directions, the estimations of those high in trust mechanically get closer to the actual rates, i.e., the size of their errors decrease.
Overall, the evidence provides limited support for Prediction 2. Weighted regressions using national education shares (CIS 3469) yield virtually identical results (Table A8, Appendix I). Further, interactions between age and education are non-significant in all models, indicating that the lack of systematic education effects on predictive accuracy holds across cohorts. Interaction between education and field of study also yield insignificant coefficients.
Result 2 (Education & Accuracy): In general, more educated people do not anticipate better the ordering of the scenarios according to the return rates. Postgraduate education decreases the error in the estimation in two scenarios —Money and Big Money. However, it non-significantly increases the error in NoMoney. Other education levels, e.g., undergraduate, display no significant effect.
The regressions in Table 5 above also include the respondent’s father’s and mother’s education level as independent variables (full estimates appear in Appendix I, table A7), which allows us to test Hypothesis 2 in Section 2. Specifically, H2 implies the following:
Prediction 3: A higher education level of the parents leads to relatively lower errors, in absolute value.
Evidence: Neither the father’s nor the mother’s education level predict accuracy in any scenario (p-value > 0.155 always). Hence, we reject Prediction 3.
So far, our analysis has focused on accuracy, leaving bias aside. Yet bias is informative in itself and directly relates to Hypothesis 3 on selection effects (see Section 2). Note though that if more educated respondents adjust their beliefs more slowly across conditions, starting with the same initial overestimation as others, they are likely to keep overestimating in later scenarios, especially BigMoney (recall our discussion of Table 5 above). Thus, both the selection-effect and slow-adjustment accounts yield the following straightforward prediction:
Prediction 4: A higher education level correlates with overestimation of return rates.
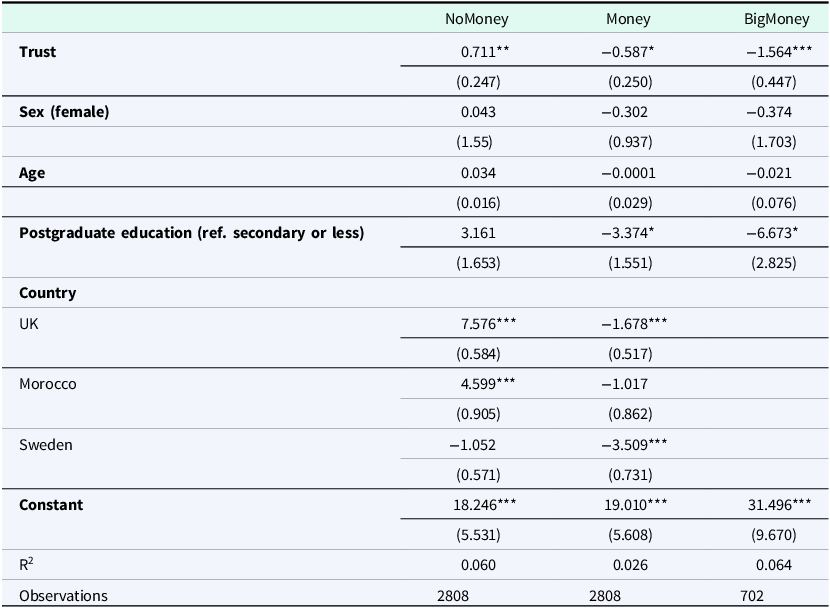
Evidence: To explore what influences the direction of bias, we run three logistic regressions, one per scenario, in which the dependent variable is a dummy taking value 1 when the respondent’s estimation is above the actual value, i.e., when she is optimistic, and zero otherwise (which in practice means under-estimation, as no respondent stated exactly the actual return rate). Logistic regressions accommodate the non-constant variance inherent in binary outcomes, while allowing to interpret covariates as probabilities of overestimation. We report log-odds coefficients in Table 6 and translate them into predicted probabilities for ease of interpretation. Standard errors are clustered at the respondent level. Again, for NoMoney and Money, the regressions include the errors for all countries, whereas for BigMoney, only the errors for the UK are included. We also include the same controls as in the regressions mentioned above (see the discussion regarding Prediction 1). Table 6 reports our main results, while Table A9 in Appendix I offers the complete estimates.
Determinants of overestimation

Note: Logit regressions. Dependent variable: positive vs. negative errors. *** p < .001; ** p < .01; * p < .05.
As we can see, postgraduate education correlates positively with overestimation in NoMoney and Money, but not in BigMoney. This is coherent up to a point to a selection effect, as we see overestimation in two of the scenarios, but overall more in line with the slow adjustment story. An additional signal against the selection effects story is that in fact overestimation in NoMoney and Money is not the majoritarian pattern, except in the top educational level (postgraduate education). People with a level of formal education above undergraduate have a 84% expected probability of over-estimating rates of return in the NoMoney scenario, and a 49% expected probability in the Money scenario (with the other variables of the models at their means). For the remaining education levels, overestimation is less frequent than underestimation (except in NoMoney, where overestimation occur in all education levels, and differences between those with secondary education or less and those with graduate education are small, even if significant). We also explored whether education effects vary by ideology by including interactions in these logit specifications; any evidence of moderation is not consistent across scenarios.
Among the rest of variables included in our logistic regressions, trust increases the probability of overestimating the actual rate of return in Money and NoMoney. For NoMoney, the probability of overestimating the rate of return is always higher than 50% for all levels of trust, and it is 92% for the highest level of trust. For Money, the probability of overestimating the rate of return increases with trust, but it is just above 50% for high levels of trust (8 in the 0–10 scale) and reaches 62% for the highest trust value. Re-estimating the overestimation models with CIS 3469-based education weights produces results that are substantively identical to those reported here (see Table A10, Appendix I).
Result 3 (Education & Overestimation): High educational levels are associated to a higher probability of overestimating return rates in NoMoney and Money, but not in BigMoney. This is evidence favorable to the slow adjustment story. Trust rises the probability of overestimation in Money and NoMoney.
We finally report a series of additional checks addressing potential concerns about our previous results. To start, the absence of accuracy incentives could introduce differential noise if more educated respondents exerted greater effort or attention. Although the survey did not include instructed-response attention checks, we can test this possibility through a number of comparisons across education levels. (1) Completion time does not vary by education (medians = 9.6–10.1 minutes; means = 11.6–12.2 minutes), and an ANOVA detects no mean differences (F(3,3196) = 0.69, p = 0.56). Although variances differ (Bartlett p < 0.001), Welch and Kruskal–Wallis tests likewise find no mean or median differences. (2) Models with education × completion-time interactions yield small, non-significant coefficients, indicating that longer completion time does not improve accuracy more among the highly educated. (3) Excluding “rapid completers” (below the 5th percentile of the completion-time distribution) leaves all main results unchanged. In summary, higher education is not associated with longer time-on-task, and the absence of incentives does not appear to bias response quality across education levels.
Given the conceptual proximity between reflectiveness and belief accuracy, we further examine whether cognitive reflection could account for or confound any observed education effects. To start, note that pairwise correlations, reported in Table A11 of Appendix I, show that education and CRT scores are only modestly related (r = 0.15, p < 0.001), while CRT’s raw association with absolute error is small and statistically weak across scenarios (|r| ≤ 0.07). Second, variance inflation diagnostics from the accuracy models confirm very low multicollinearity among predictors. In effect, CRT’s VIF is 1.14—well below conventional thresholds—and all other regressors show values below 2.2 (Table A12, Appendix I). These results indicate that CRT and education measure largely distinct constructs. Third, causal mediation analyses treating CRT as the mediator show no evidence of indirect effects: two education contrasts yield null natural indirect effects, and the highest-education contrast shows only a small positive indirect effect with a near-zero total effect (see Table A13 in Appendix I). Overall, these results indicate that CRT neither confounds nor mediates the limited association between education and accuracy in our data.
Finally, to address multiple testing across Tables 2, 5, and 6 (and A5–A7), we grouped the education coefficients into families by model and scenario (NoMoney, Money, BigMoney) and applied Holm’s step-down familywise error-rate correction (α = 0.05). In each model–scenario combination, the three education coefficients form one family, yielding 9 families and 27 tests in total in the main tables. Appendix Table A14 reports, for every education coefficient, the unadjusted and Holm-adjusted p-values and an indicator of significance after adjustment. After correction, only the strongest postgraduate effects remain statistically significant (Table 2 across scenarios; Table 5 BigMoney; Table 6 Money), and our substantive conclusions in Section 4.3 are unchanged.
Conclusion
Prior literature has proposed two competing explanations for the link between education and trust. The social-intelligence hypothesis suggests that education improves the accuracy of beliefs about others, while the selection-exposure hypothesis predicts greater optimism among the more educated. Using an online sample of Madrid-based, highly educated participants, we find that people systematically underestimate others’ pro-social behavior (PSB) as helping costs rise. Higher education neither enhances accuracy nor produces a consistent optimistic bias, offering little support for either hypothesis within this specific population.Footnote 7
An important implication of our findings for public policy stems from the strong association we document between generalized trust and beliefs about others’ pro-social behavior (PSB). Consistent with prior experimental evidence, we interpret this relationship as reflecting a causal effect of beliefs on trust. Our results accordingly suggest that policies aimed at strengthening trust should not rely exclusively on expanding formal education, at least insofar as the objective is to improve individuals’ beliefs about others’ behavior. While trust is closely linked to PSB beliefs, formal education does not appear to correct systematic pessimism or enhance belief accuracy. Consequently, trust-building interventions may be more effective if they target PSB beliefs directly. Programs that provide citizens with transparent information, structured feedback, or experiential exposure to evidence of cooperation in real-world, costly settings could help counter widespread misperceptions and foster more accurate expectations about others’ behavior. Such interventions may represent a more direct and potentially cost-effective way to promote trust—and thereby support democratic legitimacy, public goods provision, and collective action—than increases in educational attainment alone. More broadly, our findings suggest that evaluations of civic or trust-promoting educational programs should look beyond generalized attitudinal measures and examine their impact on concrete PSB beliefs. Finally, they suggest that when pessimistic beliefs persist, strong institutional enforcement may substitute for interpersonal trust in sustaining cooperation. However, in high-trust environments, accurate beliefs about others’ behavior and institutional credibility mutually reinforce each other.
We conclude by outlining several directions for future research. A first question concerns how individuals understand the origins of their own trust. Do people see their confidence in others as shaped more by education or by personal experience? Appendix III provides preliminary evidence from a question in our survey. While the findings suggest that respondents hold heterogeneous beliefs on this issue, they are in average less likely to attribute their trust to education as people accumulate new experiences. With age, that is, recent interactions weigh more heavily in shaping their beliefs about others’ trustworthiness. This aligns with Hardin’s (Reference Hardin2002, p. 113) view and analyses such as Glanville and Paxton (Reference Glanville and Paxton2007), which argue that ongoing experience during adulthood plays a primary role in the formation of trust. Further research could extend this approach by exploring how education and experience jointly influence belief updating over the life course.
A second issue for future research concerns why the expected effects of education on PSB beliefs are not observed in our data, even though education correlates with generalized trust. As noted by one reviewer, one plausible explanation is that education influences trust mainly through institutional rather than interpersonal channels. In institutionalized and highly regulated environments like Spain, confidence in political or legal institutions may substitute for interpersonal trust, thereby reducing the role of individual social learning. This interpretation is consistent with comparative research showing that the education–trust relationship depends on institutional risk and uncertainty (Wu, Reference Wu2021) and with cross-country evidence that institutional trust can substitute for interpersonal trust in sustaining cooperation and economic performance (Facchini et al., Reference Facchini, Masson and Brookes2024). Future work could therefore investigate how institutional quality moderates the education–trust relationship, testing whether education fosters confidence in institutional safeguards rather than optimism about others’ behavior.
Finally, it is crucial to understand how the education–trust relationship depends on educational systems and institutional contexts. Our findings indicate that formal attainment alone does not enhance the accuracy of PSB beliefs. Yet, different forms of education—such as inclusive, civic-oriented, or competitive curricula—may foster distinct social orientations (although in our data we find no systematic differences across broad fields of study). Comparative research could clarify whether the social-intelligence and selection mechanisms operate differently across pedagogical and institutional environments. Because institutions both rely on and shape interpersonal trust, identifying when they complement or substitute it remains essential. Future work should examine how education interacts with institutional credibility and civic norms to reveal the conditions under which it contributes to trust as both a social and institutional asset. As our measure captures attainment rather than educational content, these distinctions remain beyond the scope of this study but warrant further investigation.
Data availability statement
The data that support the findings of this study are openly available in the online supplementary repository OSF at https://osf.io/twk8q/
Acknowledgements
We are grateful to Turkay Nefes, Blaine Robbins, and Gert Svendsen for helpful comments and suggestions, and the research assistance by Mattias Corrasco and Vlasta Martínez.
Funding statement
We have received financial support from the Spanish Ministry of Science through research project PID2021-125155NB-100 and CSIC through research project 190342.
Competing interests
The author(s) declare none.


 Open access