


Over the past two decades, there has been a growing interest in restudying archaeological excavations conducted during the twentieth century. Legacy collections housed in museum archives hold immense potential for education and research; consequently, it is imperative to explore sustainable strategies to enhance their accessibility to the public (MacFarland and Vokes Reference MacFarland and Vokes2016; Swain Reference Swain, Skeates, McDavid and Carman2012). There is also a pressing need to address the digital preservation of legacy data associated with historical excavations. Such preservation efforts must ensure that these datasets are well organized, comprehensible to third parties, enriched with metadata detailing the methodologies of data collection and recording, and made openly accessible online. Yet, the integration of this data into contemporary archaeological research poses challenges (Allison Reference Allison2008; Aspöck et al. Reference Aspöck, Štuhec, Kopetzky and Kucera2020; Baird and McFayden Reference Baird and McFayden2014; Dell’Unto and Landeschi Reference Dell’Unto and Landeschi2022; Loy et al. Reference Loy, Stocker and Davies2021; Raja Reference Raja2023, Reference Raja2024).
When twentieth-century excavations were systematically documented and comprehensively published, they serve as invaluable resources for addressing twenty-first-century research questions (e.g., Kucera et al. Reference Kucera, Neubauer, Müller, Novak, Torrejón-Valdelomar, Wallner and Hinterleitner2020; Nys Reference Nys2009; Wylie Reference Wylie2017). Conversely, if an excavated site was not published but was thoroughly documented and archived, it remains feasible to study and discuss the site in view of contemporary debates, thereby laying the groundwork for further investigation (e.g., Smith Reference Smith2008; Webb Reference Webb2013). However, in cases where unpublished archaeological research lacks systematic documentation, or where the documentation methodology has been lost or rendered incomprehensible, it is significantly more challenging to derive meaningful insights from the excavation. As D’Andrea (Reference D’Andrea2024) notes, even digital legacy formats such as CAD often lack sufficient semantic structure for seamless integration, thus requiring human interpretation and careful recontextualization. This challenge is magnified when dealing with analog archives, in which spatial inaccuracies and missing metadata limit the applicability of automated solutions.
By integrating archival data and metadata preserved in museum repositories into a geographic information system (GIS) environment, De Benedictis and Meneghetti (Reference De Benedictis and Meneghetti2024) successfully contextualized previously fragmented assemblages. However, their methodology does not enable the differentiation of successive habitation layers at a site because of a problem inherent in stratigraphical legacy data: the physical layers of the site have long been excavated and are hence long gone. Textual and schematic drawings of the excavated layers provide the only remaining reference to these layers. However, these sources are prone to errors and are often incomplete.
To address these constraints, we adopted a transparent and flexible method for integrating heterogeneous archival materials directly into a 3D-GIS environment. We demonstrate how the integration of unpublished legacy data within a 3D-GIS framework, combined with photogrammetric 3D models of new test pits, can address discrepancies in legacy data. Specifically, this approach resolves height inconsistencies in legacy datasets and facilitates the identification of successive habitation layers, thereby enhancing understanding of the site’s chronological development. In this way, we aim to overcome the previously inherent problem of textual and schematic legacy data being the sole remaining physical data available by bringing the long-gone stratigraphic layers of the site back to life in a virtual environment.
The Use of 3D Modeling in Archaeological and Heritage Research
3D modeling enables the creation of comprehensive, measurable, and analyzable representations of a site, addressing the limitations of traditional 2D methods (e.g., Katsianis et al. Reference Katsianis, Tsipidis, Kotsakis and Kousoulakou2008; Loy et al. Reference Loy, Stocker and Davies2021). By capturing the full dimensionality of spatial objects, including surface and subsurface elements, 3D models provide an accurate and holistic depiction of a site (Apeh and Rahman Reference Apeh and Rahman2023). This is especially vital for understanding the inherently 3D nature of archaeological records and the processes that shape them over time (Gavryushkina Reference Gavryushkina2021). A virtual reconstruction enables the interactive re-excavation of layers and volumes, thereby providing deeper insight into complex spatial relationships and facilitating an integrated analysis of diverse datasets, such as geophysical and pedological information (Magnani et al. Reference Magnani, Douglass, Schroder, Reeves and Braun2020). This approach aligns with recent advancements in 4D GIS methodologies that emphasize the integration of temporal and spatial stratigraphic sequencing (Kucera et al. Reference Kucera, Neubauer, Müller, Novak, Torrejón-Valdelomar, Wallner and Hinterleitner2020).
Moreover, 3D modeling supports detailed postexcavation analysis by enabling measurements and observations directly from a digital environment, thus maximizing the usability of legacy data and minimizing reliance on outdated archives (Allison Reference Allison2008; Douglass et al. Reference Douglass, Lin and Chodoronek2015). It also enhances interpretation by generating new cross sections and profiles that offer varied perspectives on site features (Emmitt et al. Reference Emmitt, Sefton, Phillipps, Wendrich and Holdaway2017; Gavryushkina Reference Gavryushkina2021). In addition to their research applications, 3D outputs are invaluable for data sharing, digital archiving, and public engagement, ensuring the accessibility and longevity of site documentation (Magnani et al. Reference Magnani, Douglass, Schroder, Reeves and Braun2020). Additionally, tools like orthophotos and textured 3D models streamline documentation processes, saving both time and resources (Dell’Unto and Landeschi Reference Dell’Unto and Landeschi2022).
Recent advances in Heritage Building Information Modeling (HBIM) have demonstrated the potential of structured, semantically enriched 3D environments to support architectural analysis, conservation, and digital heritage research (e.g., Martinelli et al. Reference Martinelli, Calcerano and Gigliarelli2022; Salah et al. Reference Salah, Ajttayné Károlyfi, Szép and Géczy2025). Although these frameworks are especially powerful for well-preserved standing architecture, their application to excavated stratigraphy—particularly in the case of legacy data—remains challenging. HBIM typically relies on clearly defined geometric elements and consistent documentation standards, which are rarely available in archival excavation records. In contrast, archaeological stratigraphy is dynamic and fragmented, often demanding interpretive flexibility to accommodate heterogeneous legacy data. Our GIS-based approach prioritizes spatial flexibility and interpretative transparency, allowing us to reconstruct and recontextualize fragmentary, schematic, and often inconsistent legacy datasets without requiring extensive data normalization. Although recent work has explored hybrid integrations of scanned data into HBIM workflows (e.g., Muñoz-Cádiz et al. Reference Muñoz-Cádiz, Mariotti, Nespeca and Bolognese2025; Pepe et al. Reference Pepe, Costantino, Alfio, Restuccia and Papalino2021), these typically focus on architectural surfaces, rather than stratified archaeological deposits. As such, we position our method as complementary to HBIM: grounded in spatial accuracy and interdisciplinary collaboration but better suited to bottom-up data integration from fragmented archives and re-excavated sondages. This makes GIS a more suitable platform for archaeological workflows focused on diachronic stratigraphic analysis, contextual integration, and exploratory modeling (Pepe et al. Reference Pepe, Costantino, Alfio, Restuccia and Papalino2021).
Case Study: The Late Bronze Age Site Hala Sultan Tekke in Cyprus
Our case study focuses on the Late Bronze Age site located near the Hala Sultan Tekke mosque, situated on the shores of the Larnaca Salt Lake in Cyprus. Although tombs dating from the end of the Middle Cypriot period to Late Cypriot IIC (sixteenth to thirteenth century BC) were first discovered by two British expeditions in the late nineteenth century AD, the settlement itself was only identified in the mid-twentieth century. From 1971 to 2005, Swedish archaeologist Paul Åström (Reference Åström1986) conducted near-annual investigations of the site.
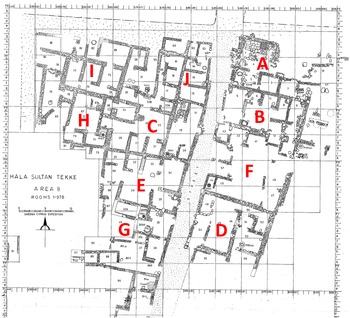
In the central Area 8, Åström’s team uncovered building units on both sides of a wide north–south oriented street (Figure 1). However, because Åström primarily focused on the latest habitation phase, dating to the LC IIIA period (ca. twelfth century BC) and opted not to excavate down to the bedrock, the site’s complete occupation history remains unknown. Furthermore, despite the publication of preliminary reports (Åström Reference Åström1976–2007) and occasional papers on specific finds, Area 8 has largely remained unpublished.
Building plan of Hala Sultan Tekke: Area 8, including building labels.

Figure 1 Long description
Insufficient visual information to describe this element accurately.
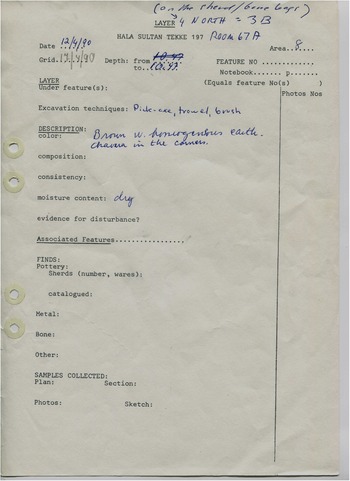
The Swedish team employed exclusively analog documentation methods, generating legacy data in the form of recording sheets, excavation plans, photographs of the excavation process, and images and drawings of artifacts. On examining these records, we observed inconsistencies in the quality of the documentation. Although standardized forms were used, the level of detail recorded varied depending on the individual responsible for documentation, leading to occasional gaps in contextual and stratigraphic information, particularly regarding precise find locations and elevation data (Figure 2). Additionally, several areas lack section drawings, and not all the excavation phases were photographed in detail.
Example of a standardized registration form for the Swedish excavations at Hala Sultan Tekke.

Figure 2 Long description
This is a scanned excavation context sheet for Hala Sultan Tekke, Room 67B, Layer 4. The document is a printed form with blue handwritten notes, some crossed out and three binder holes on the left. It records details such as date, grid location, depth and excavation techniques. The date is noted as 12/4/90, with grid location 9/10/90. Depth is marked from 0.00 to 0.32, though some values are crossed out. Excavation techniques include pick-axe, trowel and brush. The description notes brown with orangy-brown earth and cream in the corner, with dry moisture content. The form includes sections for finds, samples collected and associated features, though many fields are left blank. The tone is formal and technical, typical of archaeological recording.
Moreover, excavation and documentation methodologies evolved over the years, and certain locations were investigated intermittently through smaller trial trenches. Therefore, correlating stratigraphic layers between excavation campaigns from the 1970s and 1990s within the same area was often challenging, complicating efforts to establish a coherent stratigraphic sequence.
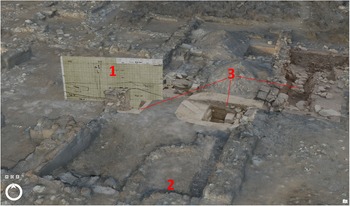
Addressing these research challenges is far from straightforward, given that earlier excavations were conducted with methodologies that ultimately resulted in the destruction of in situ evidence, leaving little opportunity for reanalysis. To mitigate this, a series of targeted sondages were conducted between 2011 and 2023, focusing on previously excavated areas while starting from the final layer that was documented by the Swedes. These sondages, recorded using more advanced equipment such as differential GPS (DGPS) for measuring the height dimension more accurately, yielded highly precise and detailed datasets, especially for stratigraphic sequences. Crucially, the sondages took off in stratigraphic layers corresponding to the lowest levels depicted in the legacy sections (Figure 3). In a few cases, these lowest levels suffered slight erosion over the decades, causing the sondage to take off in previously unexplored strata. However, the disparity in resolution and detail between these modern datasets and the legacy documentation posed significant challenges for direct comparison and integration. This necessitated the development of a methodological framework to reconcile these disparate data sources, ultimately leading us to the creation of a virtual 3D modeling environment designed to overcome these limitations and facilitate much more meaningful analyses.
Example of an interface between a legacy section and the photogrammetric rendering of a recent sondage: (1) legacy section drawing, (2) macro-scale photogrammetric model, and (3) sondage model.

Figure 3 Long description
An oblique, elevated view shows an excavation surface with exposed stonework and compacted ground. Low stone wall lines form several rectangular and linear outlines across the foreground and midground. Near the center-right, a rectangular cut-out pit is set into a lighter rectangular area, with a deeper square opening inside it. A rectangular inset at the left contains a section drawing with grid lines and small markings; the number 1 is placed over this inset. The number 2 is placed on the ground surface near the lower center. The number 3 is placed above the rectangular pit area. Thin guide lines extend from the number 3 toward the pit and across adjacent stonework.
Setting up the Modeling Environment
Setting up our 3D modeling environment for photogrammetric modeling required a structured approach to ensure the highest fidelity of our archaeological site documentation. We chose to use Agisoft Metashape for photogrammetric processing because of its reliability and ability to retain the metadata of the captured imagery, an essential feature for maintaining the integrity of our data (Polo et al. Reference Polo, Duran-Dominguez and Felicísimo2024). Image acquisition was carried out using drone-based photography obtained through a DJI Mavic 3 Pro, which combined high-altitude coverage with close-up imaging of architectural details. Ground Control Points (GCPs) were established and recorded with a Trimble TSC7 controller and R12i GNSS receiver using RTK, providing 1 mm horizontal and vertical accuracy.
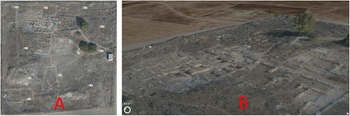
This approach allowed us to gather a large high-resolution imagery dataset that we processed using Agisoft Metashape to generate a georeferenced photogrammetric point cloud and the subsequent 3D mesh and textures (see Figure 4A and De Weirdt [Reference De Weirdt2025] for information regarding settings and specifications). Considering the computational demands of handling high-resolution 3D models, we opted to create a tiled model supporting dynamic level-of-detail rendering, which we could export in the .slpk (Scene Layer Package) format. To integrate this detailed 3D model into a GIS environment—the main work environment for combining the legacy data with the site models—we used ArcGIS Pro Desktop (Figure 4B).
(A) Photogrammetric rendering of the georeferenced model in Agisoft Pro; (B) georeferenced model imported in ArcGis Pro Desktop.

Figure 4 Long description
Image A shows a top-down view of a georeferenced model of an archaeological site, with various rectangular and square structures visible. Image B presents an angled view of the same site, highlighting the depth and layout of the structures, with a tree visible in the background. Both images depict detailed terrain and structural features.
Model development and GIS integration were carried out on a high-performance dedicated workstation. Although GIS and photogrammetry software can run on mid-range systems, our datasets, because of their resolution and complexity, benefited from a machine equipped with a high-end Nvidia RTX 4090 GPU, 128 GB RAM, and an Intel i9 processor to ensure stable rendering and efficient data handling. A detailed overview of the hardware setup, drone equipment, and processing parameters is available in our online technical specifications appendix (De Weirdt Reference De Weirdt2025).
Integrating/Synergizing Legacy Data and Sondage Data in the Modeling Environment
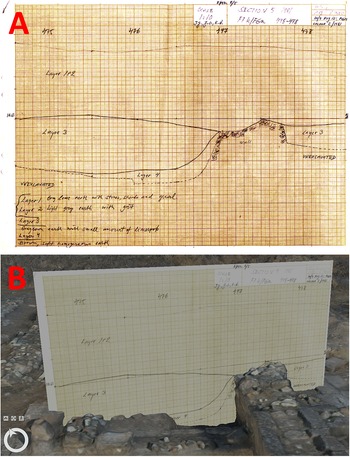
To incorporate legacy section drawings from past excavations into the 3D GIS environment, we developed a method that addressed their inherent inaccuracies while preserving their archaeological value. The original hand-drawn sections, created using dumpy level and theodolite measurements (Figure 5A), often exhibited significant discrepancies in the vertical (Z) dimension, rendering them incompatible for direct integration. To overcome this, the drawings were digitized and applied as textures onto thin 3D cubes, with dimensions matching the height and width of the original sections and a minimal thickness to ensure precision. These digitized sections were then manipulated within the 3D GIS environment, allowing adjustments in the X, Y, and Z dimensions to align with the photogrammetric model, which serves as an absolute virtual representation of the site. By matching stratigraphic features such as walls and individual stones from the hand-drawn sections to their corresponding elements in the 3D model (Figure 5B), we effectively reconciled discrepancies in height and recontextualized the legacy section drawings. This process enabled the reconstruction of stratigraphic units and layers no longer present at the site, because the corrected heights were derived directly from the GIS environment.
(A) Example of an original section drawing, measured by dumpy level; (B) the same section digitized, readjusted, and positioned within the 3D model.

Figure 5 Long description
Image A shows an original hand-drawn stratigraphic cross-section on ruled grid paper. The horizontal dimension represents distance along the section and the vertical dimension represents elevation. No axis units or numeric scale values are explicitly labeled on the axes. The grid lines are evenly spaced and provide a relative reference for distance and elevation. The profile line begins at a relatively level position on the left side, then rises gradually into a rounded elevated feature near the center-right portion of the drawing, before leveling off again toward the right edge. Handwritten labels including Layer 2 and Layer 3 are marked along different portions of the profile line. Additional handwritten annotations appear in the lower left area of the drawing, though the text is not fully legible at this resolution. The number 3 appears at the far right edge of the drawing. The word HORIZONTAL appears as a label near the right side. At the top of the drawing, partial text references a section number and additional handwritten notes are visible, though specific values are not clearly readable. Image B shows the same stratigraphic cross-section after digitization, displayed as a flat rectangular surface positioned within a three-dimensional model environment. The profile line and layer labels visible in image A are retained in the digitized version. The surrounding environment in image B shows a rocky or excavated ground surface beneath and around the digitized section panel. The overall shape of the profile, including the gradual rise and the rounded elevated feature near the center-right, matches the profile shown in image A.
Both legacy and photogrammetric datasets were carefully evaluated before integration. Legacy section drawings were cross-checked against excavation plans and stratigraphic notes to confirm their provenance and spatial consistency. The photogrammetric data were validated through comparison with ground control measurements (GCPs) recorded using DGPS, achieving centimeter-level spatial accuracy. Only well-documented and spatially coherent sections were retained for 3D integration, ensuring the reliability of the resulting model for stratigraphic analysis.
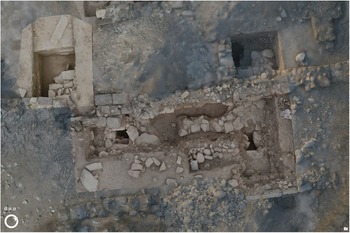
To complement the integration of legacy section drawings, we incorporated ultra-high-resolution photogrammetric models of the individual sondages conducted during more recent excavation campaigns (Figure 6). By aligning the photogrammetric models with the corrected legacy sections within the 3D GIS environment, we bridged the stratigraphic gap between these two datasets. This integration allowed us to construct more complete stratigraphic profiles for each room in the case study building, combining data from topsoil to substratum where possible.
Example of two models from more recent sondages, georeferenced and fitted in the main model.

Figure 6 Long description
The image shows an aerial view of an archaeological excavation site. There are several stone structures and trenches visible. The site includes rectangular and square openings, possibly indicating rooms or chambers. The ground is uneven with scattered stones and debris. Some areas appear to be more excavated than others, revealing deeper layers of the site.
Using the 3D Model for Archaeological Interpretation
Because Paul Åström mainly focused on clarifying the latest phase of habitation at Hala Sultan Tekke, he did not target the earlier underlying layers. Consequently, the site’s complete occupational history remains largely unknown. In the following three case studies from Area 8 in buildings C and H (Figure 7), we demonstrate how the 3D model can contribute to constructing a stratigraphic profile, identifying consistent floor levels across multiple rooms, and resolving height discrepancies in legacy datasets.
Close-up portion of the site plan showing building C with indications of the four rooms and two sondages mentioned in the case studies.

Figure 7 Long description
The site plan map highlights excavation areas S14 and S17 within a walled compound. Blue shading marks selected structures, while yellow highlights S14 and S17. S14 is a small yellow rectangle along the north edge of area 19 and S17 is a larger yellow area to the east of 19. Key labeled sections include 67A, 28, 23 and 19. The plan includes walls and structural elements, with some areas marked as 'Well'. The map does not indicate orientation and the highlighted areas suggest zones of interest or focus within the site.
Constructing the Stratigraphic Profile
Our first case study, located in rooms 19 and 23, demonstrates how a 3D model can be used to reconstruct a comprehensive stratigraphic profile by integrating legacy section drawings with recent data from the sondages. Rooms 19 and 23 were originally excavated by the Swedish archaeological team in 1981, down to layer 3b in room 19 and layer 4 in room 23. The legacy documentation is limited to a section drawing, FGd/e 475-478, and a record sheet, which identifies the feature as a baulk labeled “1588” but provides no further detail beyond a list of associated pottery finds. In 2011, our team investigated the foundations of the west wall of room 19 to determine the construction phase of this part of the building. For this, a sondage was carried out (S14).
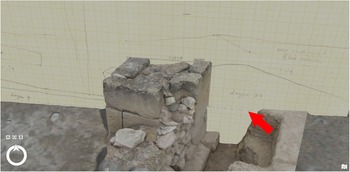
Room 19 provided a particularly illustrative example of the challenges in aligning legacy and modern datasets. The 1981 excavation had stopped well above the base of the walls, leaving several earlier strata unrecorded. Sondage 14, which was excavated within the same wall alignment, extended to the base of the foundations and reached the virgin soil but naturally lacked the upper layers (layers 1, 2, and 3a), which had been removed decades earlier and had been backfilled over the years. The legacy data preserved only the upper sequence, whereas the sondage captured only the lower, leaving neither dataset sufficient to reconstruct the full stratigraphic profile independently (Figure 8).
The combined stratigraphic profile of room 19, bringing the legacy section and sondage profile S14 together. The arrow indicates the lowest excavated point of the 1981 Swedish excavation. The sondage reached to the base of the wall, all the way to the virgin soil.

Figure 8 Long description
A close view photograph shows a short section of stone masonry in the foreground. The masonry includes stacked stones and a rectangular block at the top, with loose stones clustered along the right side of the wall section. To the right of the masonry, a flat-topped rectangular stone or block sits slightly lower than the top of the wall section. Behind the masonry is a pale grid background with faint lines and handwritten notes. Near the right side, the handwritten text reads 'Layer 3a'. A red arrow points toward this 'Layer 3a' label. Additional faint handwritten marks and lines are present on the grid background but are not fully legible.
The solution was to identify and use an “interface layer”: a stratum that is clearly visible in both the legacy section drawing and the sondage profile. In room 19, the most reliable of these was layer 3b, described in the legacy archive as a “rather hard brown earth with a low concentration of white lime spots” and readily identifiable in the S14 photogrammetric model because of its distinctive composition and texture. Once confirmed as the same deposit in both datasets, this horizon served as an anchor for vertical alignment. The upper sequence from the legacy drawing could thus be accurately “stacked” onto the lower sequence from the sondage, producing a continuous profile from the modern surface to the virgin soil.
This integration revealed two important points. First, it confirmed that the lower strata preserved in S14 (and by extension in room 19) had never been documented before, meaning that their inclusion extends the known occupational history of this room. Second, the process highlighted a broader and very important interpretive issue: the layer number 4 in room 23 did not correspond precisely to deposits labeled “layer 4” elsewhere on the site.
By resolving the height discrepancies between the datasets, the reconstructed profile could, for the first time, be measured accurately in the georeferenced 3D-GIS environment and assigned precise depths below the modern surface. Each of the layers could now be measured in the Z dimension. This new level of accuracy not only enhanced the reliability of the room 19 sequence but also allowed the interpolation of stratigraphy into directly adjacent areas lacking section drawings, thereby bridging long-standing documentation gaps in the legacy record.
Identifying the Same Floor Level in One or More Rooms
Building on the vertical stratigraphic reconstruction described in case study 1, the next step was to examine how individual layers could be traced laterally across multiple rooms to reconstruct horizontal horizons. Although vertical alignment establishes the sequence of deposition within a single excavation unit, the ability to correlate those layers across space is essential for reconstructing the use of floors, occupation surfaces, and construction fills that extend beyond the boundaries of a single trench.
This process is complicated at Hala Sultan Tekke, with two persistent problems in the legacy dataset. First, the same numerical layer designations (e.g., “layer 3a” or “layer 4”) were applied site-wide, even when the deposits in question differed in composition, function, or chronology between rooms. As a result, deposits with identical numbering were not necessarily stratigraphically equivalent. Second, the documentation of individual rooms was inconsistent. There are numerous rooms and areas within the site that were not consistently recorded because section drawings, descriptive notes, and plans were produced unevenly or were missing altogether. These inconsistencies severely limit the reliability of the legacy dataset for correlating layers across different rooms or excavation areas.
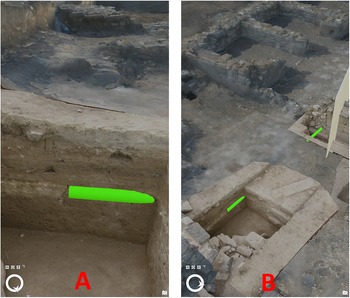
To address this issue, we turned once again to the high-resolution sondage data. This case study demonstrates how targeted sondages can resolve these problems by reconstructing missing legacy data. In room 19, two sondages (S17 and S14) exposed a well-preserved white havara floor (Figure 9A), a compact occupational surface that could be recognized in both the sondages, independently of the legacy section drawings. The sondage’s detailed photogrammetric model and associated sediment descriptions confirmed that the havara floor in room 19 was a discrete occupational surface, distinct in both composition and stratigraphic context from other deposits. By spatially linking these two sondages in the 3D GIS environment (Figure 9B), the havara surface was modeled as a continuous horizontal horizon, effectively creating a virtual planum anchored in the stratigraphic observations.
(A) Observation of a white havara floor layer in S17. Halfway in the profile, a green 3D object is attached and given the width of the layer at the attachment point; (B) the green 3D object is extended to S14, where it links to and follows the trajectory of the same havara floor layer within room 19.

Figure 9 Long description
The image A showing a close view into a rectangular excavation trench. A vertical soil profile wall fills most of the frame. A green digital overlay forms a horizontal bar along the profile wall. A red letter A is printed near the bottom. The image B showing an elevated oblique view of an excavation area with stone-lined rectangular features and open pits. A green digital overlay forms a short line on one stone-lined edge and another green overlay segment lies across a soil surface. A red letter B is printed near the bottom.
Once defined in room 19, this distinctive havara floor horizon could be used as a stratigraphic “anchor layer” that was extended into the adjacent room 23 and stretched into a planum (Figure 10). The 1981 excavation notes of the Swedish team report that they reached a distinct habitation level in room 23. However, this horizon was not recorded in their section drawings, leaving a critical gap in the legacy documentation. The integrated 3D GIS environment allowed us to correlate this habitation level with the havara floor horizon: by laterally projecting the latter from room 19 into room 23, we established that the habitation level identified by the Swedish team lies at a consistent elevation relative to the sondage data and therefore represents the same habitation horizon. From this starting point, the horizon could be interpolated across areas where direct excavation data were absent, gradually building a more complete planum for this occupation phase. Because the projection was anchored in multiple sondages with precise georeferencing and corrected vertical profiles (see case study 1), the reconstructed horizon rests on a firm empirical basis, rather than speculative interpretation. Crucially, this process required no new large-scale excavation: targeted sondages, combined with precise georeferencing and vertical corrections as illustrated in the previous case study, provided sufficient anchor points to extrapolate the layer across the building.
Green planum created from the connected havara layer in sondages 14 and 17. The planum reaches into room 23 where it cuts through the depression left behind by another sondage.

Figure 10 Long description
An aerial view of an archaeological site features two labeled rooms, R19 and R23. Room R19 contains two sondages, S14 and S17, both marked with green areas. Room R23 also has a green area extending from the sondages in R19. The site is surrounded by stone walls and scattered rocks, indicating excavation activity.
An additional strength of this approach is its adaptability to sites with uneven topography. Hala Sultan Tekke lies on a gentle incline, meaning that identical habitation layers may appear at slightly different absolute elevations from one room to another. By relying on stratigraphic anchors like the havara floor, rather than absolute height or legacy numbering, the method accommodates these natural variations while still reconstructing continuous occupational horizons.
In the long term, this approach will enable the reconstruction of successive habitation horizons for buildings C and H, eventually extending to other parts of the site, including exterior streets and open spaces. By combining the reconstructed vertical stratigraphies with these laterally correlated horizons, we can develop a site-wide diachronic framework of occupation surfaces, one that resolves the inconsistencies in the legacy dataset and supports more accurate interpretations of architectural development, spatial use, and social activity patterns.
Resolving Height Inconsistencies in Legacy Datasets
To gain a diachronic understanding of urban development in Area 8, it is essential to determine when and how the various architectural compounds were constructed and modified over time, as well as how movement between buildings was facilitated during specific phases of habitation. Our third case study, therefore, focuses on the relationship between buildings C and H, specifically examining the adjoining rooms 28 (in building C) and 67A (in building H).
Room 28 was first investigated by the Swedish archaeological team in 1988. Unfortunately, the legacy data from this campaign lack written descriptions of the excavation process. However, valuable information can still be gleaned from the plan of the uppermost layer, a section drawing of all excavated layers, and drawings of the four walls of the room. These materials indicate three distinct habitation phases, represented by floors 4, 6, and 9, respectively (Figure 11A).
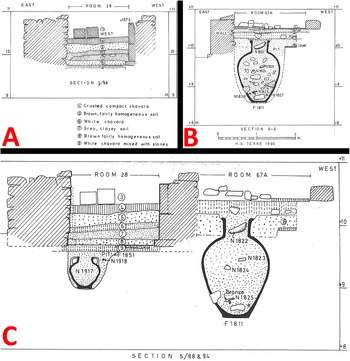
(A) Section drawing (east–west) of Hala Sultan Tekke room 28—including layer descriptions—made during the excavation campaign of 1988; (B) section drawing (east–west) of Hala Sultan Tekke room 67A made during the 1990 excavation campaign; (C) combined section drawing of Hala Sultan Tekke rooms 28 and 67A, with adjusted details, compiled during the 1994 excavation campaign.

Figure 11 Long description
The diagram consists of three stratigraphic section drawings, each oriented east to west, depicting excavation layers and features of Hala Sultan Tekke rooms 28 and 67A. The first drawing shows room 28 from the 1988 campaign, with layers labeled as crushed compact chovara, loose homogeneous soil, thin clay wash and white chovara mixed with stones. Key features include labeled finds such as N1917 and an amphora labeled F1811. The second drawing illustrates room 67A from the 1990 campaign, featuring similar stratigraphy and the amphora F1811. The third drawing combines sections of both rooms from the 1994 campaign, showing adjusted details and additional labels like N1923. Each drawing includes a scale bar and tick marks, indicating measurements, though specific units are not readable. The diagrams serve to compare stratigraphic sequences and the placement of notable features across different excavation campaigns, highlighting the archaeological findings and their context within the site.
In 1990, the Swedish team turned their attention to building H, excavating room 67A down to its earliest floor level. The legacy data from this campaign include brief descriptions of the stratigraphic sequence, a list of pottery finds for each layer, a plan for each floor level, and a section drawing. Based on this combined dataset, it can be inferred that room 67A experienced two habitation phases, marked by floors 5 and 8, respectively (Figure 11B).
In 1994, the Swedish team resumed the excavation of room 28 and uncovered a pit containing a krater beneath floor 9. During this campaign, the draftsperson updated the original section drawing of room 28 to incorporate the newly discovered pit into the stratigraphy. Additionally, he created a composite section drawing of rooms 28 and 67A to illustrate the spatial and chronological relationship between buildings C and H. However, in doing so, he introduced several significant alterations to the original section drawing of room 67A (Figure 11C): (1) the representation of the finds within the pithos was substantially minimized; (2) intermediate layers 6 and 7 were merged into a single homogeneous layer, thereby eliminating the nuanced distinctions between successive fill deposits; (3) the original numbering of the layers was omitted, although the fill surrounding the pithos neck was labeled as “8”; and (4) the vertical extent of the overlying layers above the pithos was significantly reduced, which becomes clear when comparing the position of this upper part with the adjacent wall in the 1990 and 1994 drawings.
As a result, these modifications not only suggested that the latest floor levels in rooms 28 and 67A were contemporaneous and situated at the same elevation but also implied that both “layer 8” deposits in these rooms were identical and coeval. However, subsequent analysis of the pottery assemblages from both rooms revealed a more nuanced picture. Although the sherds from the latest habitation phases in rooms 28 and 67A appear contemporaneous, the assemblages from “layer 8” in each room differ significantly. Specifically, the pottery from layer 8 (= floor 8) in room 67A closely resembles the assemblage from layers 5 and 6 in room 28, suggesting that the material in layer 8 of room 28 predated that of layer 8 in room 67A. This evidence indicates that the earliest floor in room 67A is contemporaneous with the second habitation phase (floor 6) of room 28. When the 1990 section drawing is accurately positioned within the 3D model in relation to the architectural features, it becomes clear that not only is there a height discrepancy between the latest floor levels of the two rooms but also that floor 8 in room 67A aligns closely in elevation with floor 6 in room 28 (Figure 12).
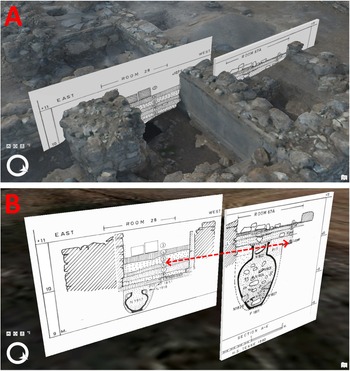
(A) Section drawings of 1988 and 1990 realigned within the 3D model in relation to the architectural features of the model; (B) the two section drawings at their correct heights, with the red line indicating the matching habitation layer.

Figure 12 Long description
The image A shows section drawings of rooms 28 and 67A integrated into a 3D model. The drawings are positioned within the architectural features of the model, illustrating the spatial relationship between the sections and the physical structure. The section drawing labeled 'East Room 28' is aligned with the corresponding architectural elements, providing a visual representation of the room's layout and features. The image B displays the section drawings at their correct heights, with a red dashed line indicating the matching habitation layer between the two rooms. The drawing labeled 'East Room 28' and 'Room 67A' are shown side by side, with the red line connecting specific points on each drawing, suggesting a relationship between the habitation layers. The drawings include detailed architectural features, such as walls and floor levels, which are accurately positioned within the 3D model to reflect their real-world counterparts. The integration of these section drawings into the 3D model allows for a comprehensive understanding of the spatial and temporal relationships between the rooms and their respective habitation layers.
By further investigating the surrounding rooms in both buildings using a similar approach, the 3D model will facilitate the visualization of the various habitation phases and illustrate how individuals may have moved through the buildings at specific moments in the history of this part of the settlement.
Discussion
Integrating legacy section drawings with modern sondage data in a 3D modeling environment has yielded a marked improvement in the quality and continuity of our stratigraphic reconstructions. By aligning high-resolution sondage datasets with earlier, less precise drawings, we were able to systematically correct vertical measurement errors and other discrepancies inherent in the legacy documentation. In areas lacking direct section evidence, interpolation effectively bridged the spatial gaps, enabling a continuous stratigraphic interpretation across the site. This approach not only greatly enhanced the resolution of our stratigraphic profiles but also facilitated the reconstruction of layers over greater distances for the first time since the start of the excavations in Hala Sultan Tekke Area 8, even when significant data voids were present due to erosion or incomplete documentation. Successful application of this process, however, is contingent on two critical conditions.
Complementarity between the Legacy Data and the New Excavation Data: The Need for an Interface
Ensuring that legacy data can be effectively synergized with new excavation data is of paramount importance for robust stratigraphic reconstruction. The process requires that the bottom layer of the legacy sections either touches or overlaps the top of the modern sondage layers, thereby establishing a distinct and reliable interface. This physical intersection is essential because it anchors the stratigraphic sequence, providing clear reference points for correlating disparate datasets. When these direct contact points are sparse or absent, interpolation based on the spatial context provided by adjacent sondages is used. This leverages the continuity in surrounding data to estimate the missing legacy section–sondage interfaces, ensuring that the overall stratigraphic framework remains coherent and accurate.
Achieving this synergy requires that both the legacy and modern datasets exhibit substantial spatial overlap and maintain consistent georeferencing. Accurate calibration and error correction rely heavily on the ability to precisely align these datasets—especially the legacy section drawings—making the uniformity of their coordinate systems and scale critically important. Furthermore, the modern sondage data must present clearly identifiable stratigraphic boundaries, which serve as vital markers for guiding the interpolation process. When these boundaries are well defined, they not only enhance the reliability of the interpolation but also bolster the overall interpretive clarity of the stratigraphic sequence. Ultimately, the successful synergy of legacy and modern excavation data depends heavily on the virtual geospatial workspace, leading us to the next critical consideration: establishing the precise requirements for constructing an accurate 3D model.
Constructing an Accurate Georeferenced Photogrammetric 3D Model of the Site
The reliability of a 3D reconstruction as an analytical tool hinges not only on the quality of the imagery and georeferencing but also on the workstation system’s ability to process and render large photogrammetric datasets efficiently. In practice, limitations in computing power can lead to long processing times, rendering lag, or instability when interacting with complex models in a GIS environment. These issues can affect both productivity and interpretive accuracy. Although many off-the-shelf desktop computers now meet the minimum requirements for running GIS and photogrammetry software, more demanding datasets benefit from higher-performance configurations.
The technical choices we made were not dictated by software limitations but by a desire to maintain a responsive and stable working environment while manipulating large datasets in real time. This consideration becomes particularly important when the 3D model is not used solely for visualization but also serves as a stratigraphic framework in which precise spatial alignment and detailed interpretive work are key. To support reproducibility and adaptation to other use cases, detailed specifications and settings are provided in our online technical specifications appendix (De Weirdt Reference De Weirdt2025)
High-resolution drone photography is key to building the photogrammetric model. Images should be captured from multiple angles and elevations, with extra focus and close-up details for recognizable features such as walls. Such a multi-perspective approach ensures generation of a detailed photogrammetric model, in which greater overlap between images allows for a more precise depth reconstruction. Additionally, georeferencing the model with high precision requires the incorporation of Ground Control Points (GCPs). These reference markers, recorded with GPS measurements, anchor the photogrammetric reconstruction within an established coordinate system, ensuring spatial accuracy. Without properly distributed GCPs, distortions may arise, undermining the reliability of the reconstructed site. By meeting these technical requirements, the 3D model becomes more than just a visual representation. Its main purpose is to serve as an analytical tool that strengthens the integration of legacy and modern excavation data.
Our method relies on the manual manipulation of stratigraphic data within the 3D environment. It is reasonable to ask whether more automated or algorithmic approaches, such as semantic segmentation, edge detection, or point cloud alignment algorithms like Iterative Closest Point, could enhance efficiency and reduce user input. Although such tools are increasingly used in digital archaeology and heritage science (e.g., Szostak and Wac Reference Szostak and Wac2024; Yang et al. Reference Yang, Hou and Songnian2023), their implementation depends on access to large, standardized training datasets and significant technical resources. In our case, the legacy dataset comprises no more than 50 preserved section drawings, produced by different excavators over several decades using varying techniques, ranging from rough sketches to rulered elevations. This variability poses major challenges for training computer vision models, which rely on consistency and volume in their training inputs. Given the limited and heterogeneous nature of the material, the cost and effort required to develop a reliable automated system would likely outweigh its benefits. For this reason, we prioritized a flexible, transparent method that can be applied directly to imperfect and small-scale archival datasets.
Although automation was not feasible for the current dataset, the manually integrated model can certainly be expanded. We aim to enhance the analytical potential of the model by developing a volumetric stratigraphy framework. This will require digitizing and spatially aligning all available legacy section drawings and tracing the edges of layers in separate ArcGis Multipatch Feature classes. These edges, drawn as lines, can then be extruded to create planar layers that intersect between different section drawings and different areas within the site, creating a rough volumetric model that can then be further refined. Doing so will enable the reconstruction and comparison of stratigraphic units across individual rooms and buildings, which will support more nuanced diachronic interpretations of occupation sequences, construction phases, architectural use, and site development over time.
Additionally, we plan to recontextualize artifact and architectural data from the legacy excavations by georeferencing 2D site plans and integrating find descriptions into the 3D environment. By doing so, we aim to create a holistic spatiotemporal and topological database of the available archaeological legacy data of the site—potentially implemented in an online, external storage system similar to the framework proposed by Calzado-Martínez and others (Reference Calzado-Martínez, García-Fernández and Ortega-Alvarado2022). This will allow for targeted spatial analyses, including artifact distribution mapping, context correlation, and material-density visualizations.
Beyond its role in stratigraphic reconstruction, the 3D model serves as a dynamic research platform with far-reaching implications for multidisciplinary and collaborative studies. By integrating geospatial, archaeological, and computational methodologies, this model facilitates cross-disciplinary engagement, allowing specialists from various fields—ranging from geoarchaeology and environmental reconstruction to architectural history and materials science—to further explore site formation processes, past human activities, and construction techniques in unprecedented detail (Dell’Unto and Landeschi Reference Dell’Unto and Landeschi2022). Given the potential involvement of multiple specialists in working with the dataset, it is crucial to systematically document decisions made during the digitization process. Encoding these decisions as distinct layers within the GIS ensures that future researchers can effectively interpret, access, and use both the study and archival materials (Loy et al. Reference Loy, Stocker and Davies2021). The model’s high-resolution georeferencing enables spatial analyses that extend beyond traditional stratigraphic studies, providing a foundation for further research in landscape archaeology and urban development. Moreover, researchers working on similar sites can use the model as a reference framework to refine their own reconstructions.
The model’s potential for collaboration extends beyond academia, with applications for heritage management, conservation planning, and digital archaeology initiatives. By making the final 3D dataset fully open access in the future—once the stratigraphic reconstruction of buildings C and H is completed and published—we aim to establish a digital repository that promotes transparency and reproducibility while adhering to FAIR data principles (Wilkinson et al. Reference Wilkinson, Dumortier, Aalbersberg, Appleton, Axton, Baak and Blomberg2016).
Step-by-Step Practical Guide
If you are working with an (unpublished) archaeological site with incomplete legacy data, our methodology provides a systematic framework to bridge these data gaps. The following steps outline the general workflow for integrating legacy section drawings into a 3D-GIS environment (Figure 13). Although it assumes some familiarity with GIS software (e.g., ArcGIS Pro) and photogrammetric tools (e.g., Agisoft Metashape), this guide is intended as a practical reference for archaeologists interested in adapting the method to their own projects. More detailed examples, technical specifications, and processing parameters are provided in our online technical specifications appendix (De Weirdt Reference De Weirdt2025).
1. Digitization of Legacy Section Drawings. Ensure that all legacy section drawings are digitized using high-resolution scanning techniques, maintaining optimal image clarity to facilitate accurate integration into a 3D-GIS environment.
2. Creation of a High-Resolution Photogrammetric 3D Model. Begin by capturing a complete photographic dataset of the site. Use a drone (e.g., DJI Mavic series) to collect both high-altitude overview images and detailed close-up photographs of relevant stratigraphic features. Ensure images are taken from multiple angles and elevations, with sufficient overlap (typically 70%–80%) to support photogrammetric reconstruction. Incorporate clearly marked Ground Control Points (GCPs) within the scene (e.g., nails, flags, poles, or fixed measurement points) and ensure they are evenly distributed across the survey area to minimize distortion in the georeferencing. Once the image dataset is complete, use photogrammetric software (e.g., Agisoft Metashape) to process the images into a dense point cloud, mesh, and textured 3D model. For our image dataset, we used the DNG (RAW) files produced by the drone, rather than the default compressed JPEGs. This choice preserved the full sensor data, offering a higher dynamic range, reduced compression artifacts, and more accurate color reproduction. Prioritize high image resolution and model accuracy over processing speed. A high-performance workstation is recommended for handling the dataset efficiently. Detailed acquisition and processing parameters we used for our models are clarified in our technical specifications appendix (De Weirdt Reference De Weirdt2025).
3. Georeferencing the Photogrammetric Model. Once the initial 3D model is generated, import the GPS data associated with your GCPs into your photogrammetry software. Align the model using the GCPs to anchor it accurately within a real-world coordinate system. For precise spatial analysis, select a Coordinate Reference System (CRS) that corresponds to your project’s geographic region. This step is essential to ensuring that the resulting model can be integrated seamlessly with other spatial datasets within the GIS environment.
4. Optimizing the Model for GIS Integration. To ensure efficient rendering and navigation in the GIS environment, export the processed 3D model in a tiled format such as .slpk (Scene Layer Package). Such a tiled model format allows the GIS software to dynamically load only the necessary details, significantly improving performance when interacting with the model. Before exporting, verify that textures and coordinate systems are preserved during the export process.
5. Setting up the 3D-GIS Environment. Open your GIS platform (e.g., ArcGIS Pro Desktop) and create a new 3D scene project. Ensure the project uses the same Coordinate Reference System as the one used during georeferencing of the photogrammetric model to maintain spatial accuracy. Add the exported .slpk file to the scene as a 3D layer. If you are working with large models, it is advisable to enable dynamic rendering settings (e.g., scene caching or level-of-detail display) to improve navigation. This 3D scene will serve as the base workspace for integrating and manipulating legacy section drawings, stratigraphic interpretations, and other archaeological datasets.
6. Preparing to Integrate the Section Drawings. To begin embedding legacy section drawings into the 3D environment, set up a new data layer that supports the creation of 3D geometric features (in ArcGis Pro Desktop: multipatch feature class). Most 3D-capable GIS platforms allow for the creation of custom 3D objects. Configure this layer to support texture mapping, which will allow scanned section drawings to be projected onto 3D surfaces.
7. Creating a 3D Feature for Texturing. Create a simple 3D cube object within the GIS scene. This cube will serve as the base surface onto which the digitized drawing will be projected. It should be positioned approximately in the correct location within the model, oriented perpendicularly to the stratigraphic sequence it represents. Many GIS platforms support basic shape-creation tools (e.g., box, plane, or multipatch geometry) for this purpose. Keep the geometry simple and flat to ensure accurate visual alignment during the next steps.
8. Applying the Section Drawing as a Texture. Once your 3D geometry is in place, apply the digitized section drawing as a texture to one of its surfaces. Most 3D GIS platforms support texture mapping, where an image file (e.g., JPEG, PNG, or TIFF) is projected onto a polygonal surface. Choose the image format that best preserves legibility and resolution. Assign the texture to the appropriate face of the cube that is aligned with the excavation profile. Ensure the image is not distorted during projection and that it retains its original aspect ratio. If your platform offers it, use tools for aligning or anchoring image corners to match specific vertices of the polygon.
9. Resizing and Shaping the Polygon. Adjust the dimensions of the cube so that it closely fits the proportions of the section drawing. This involves reshaping the cube into a thin, flat surface with minimal thickness—essentially functioning as a virtual “panel” for the drawing. Use vertex or edge editing tools to resize the object, ensuring that its width and height correspond to the scale of the original section.
10. Aligning the Section Drawing within the Model. Use positioning tools to accurately align the textured section drawing with its corresponding location in the 3D model. This involves moving, rotating, and scaling the 3D panel with the section until identifiable features in the drawing (e.g., walls, floor layers, or objects) visually match their counterparts in the photogrammetric environment. Alignment should be done in all three dimensions to ensure that the section drawing accurately reflects its original excavation context. This step is critical for achieving a high degree of spatial accuracy and ensuring that the reconstructed stratigraphic layers reflect the real-world archaeological context.
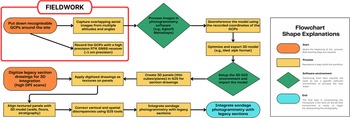
Flowchart illustrating the methodological steps for constructing the 3D modeling environment, integrating photogrammetric models with digitized legacy section drawings and sondage data to reconstruct the stratigraphy.

Figure 13 Long description
The flowchart outlines a process for integrating photogrammetric models with legacy data in a 3D-GIS environment. It begins with fieldwork, where Ground Control Points (GCPs) are placed around the site. Overlapping aerial images are captured using drones. The images are processed into a 3D model using photogrammetric software. The model is georeferenced with GCP coordinates. The model is optimized and exported for GIS. Legacy section drawings are digitized for 3D integration. The drawings are aligned with the 3D model. The final step involves integrating sondage data with legacy sections. A key explains the flowchart shapes: rectangles for processes, diamonds for decisions and ovals for start/end points.
Conclusion
The integration of legacy data with modern excavation datasets within a 3D-GIS modeling environment has proven to be a transformative approach for archaeological research, particularly when dealing with incomplete, inconsistent, and fragmentary archives. By combining high-resolution photogrammetric sondage models with spatially corrected legacy section drawings, we were able to reconstruct stratigraphic units and habitation layers that are no longer physically present at the site, thereby overcoming long-standing gaps in the documentation. The three case studies presented demonstrate the interpretive potential of this approach. In the first one, vertical integration of legacy and sondage data enabled the reconstruction of complete stratigraphic profiles across areas with missing or partial records. In the second case study, the horizontal correlation of floor levels across multiple rooms created continuous horizons, even where direct documentation was absent. In the third one, reanalysis of a composite section drawing revealed and corrected long-standing interpretive errors, allowing for a more accurate reconstruction of the site’s occupation sequence. Together, these examples highlight how the method not only bridges data gaps but also enables the reassessment and, where necessary, the overturning of earlier interpretations. By correcting height discrepancies directly within the GIS environment, we established a precise and reliable spatial framework that facilitates both targeted stratigraphic reconstruction and broader analytical possibilities. The 3D model serves not only as a visualization tool but also as an interactive research platform for testing scenarios, visualizing complex spatial relationships, and interpolating missing stratigraphy with high precision.
The stratigraphic reconstruction allows us to reanalyze, correct, and identify successive habitation layers and study the site’s chronological development. Understanding the lifespan of the site is vital to understanding how people used to live their lives through the ages. Over time, these inhabitants lived in different social and environmental conditions that are reflected in the site’s anatomy. The outcomes of these human–environment interactions are manifested in the site’s stratigraphy.
Acknowledgments
We express our gratitude to the Department of Antiquities of Cyprus for granting the necessary permits to conduct archaeological research at the site of Hala Sultan Tekke. In 2009, a permit was issued to Karin Nys to study and publish the results of the unpublished excavations carried out by the late Paul Åström. Subsequent permits were granted for conducting sondages on the site between 2011 and 2023, as well as for studying the excavated material housed in the depots of the Larnaca District Museum. We also wish to thank the department for granting access to archival legacy data, which were transferred to Karin Nys for further study following the passing of Paul Åström. We thank the anonymous reviewers for their valuable comments and suggestions, which considerably improved the article. Finally, our sincere thanks go to Mónica Alonso-Eguíluz for her generous assistance with the Spanish-language abstract.
Funding Statement
This research was supported by VUB seeding funding granted to Karin Nys and a VUB research fellowship granted to Polte De Weirdt under Grant OZR4358.
Data Availability Statement
The physical legacy data mentioned in this publication are currently archived by the Vrije Universiteit Brussel. Digital counterparts, as well as the photogrammetric model, drone photographs, and GPS data, are being stored in the cloud server of the Vrije Universiteit Brussel. The technical specifications appendix is available online at https://doi.org/10.6084/m9.figshare.30051598 (De Weirdt Reference De Weirdt2025).
Competing Interests
The authors declare none.


 Open access