


1. Introduction
Where scientific uncertainty persists, public confidence in expert-provided information plays a crucial role in shaping attitudes towards policy issues (e.g., Salanié and Treich, Reference Salanié and Treich2009; Sundblad et al., Reference Sundblad, Biel and Gärling2009; Bennett, Reference Bennett2020). Whether the public trusts expert-provided information is an important aspect of many policy issues including vaccine uptake (c.f., Larson et al., Reference Larson, Clarke, Jarrett, Eckersberger, Levine, Schulz and Paterson2018; Sturgis et al., Reference Sturgis, Brunton-Smith and Jackson2021), climate change (e.g., Sundblad et al., Reference Sundblad, Biel and Gärling2009) and how much to invest in adaptation and mitigation (Salanié and Treich, Reference Salanié and Treich2009). Prior research has evaluated how respondent beliefs about the trustworthiness, that is, the credibility or reliability, of those providing information may affect stated preferences (SP) for policy. For example, Hoehn and Randall (Reference Hoehn and Randall2002) discuss how respondents’ values for injury prevention are influenced by confidence in new information on injury risks. While previous research has examined trust in specific organizations (Khachatryan et al., Reference Khachatryan, Rihn and Wei2021), personal knowledge (LaRiviere et al., Reference LaRiviere, Czajkowski, Hanley, Aanesen, Falk-Petersen and Tinch2014) or survey-provided information (Kataria et al., Reference Kataria, Bateman, Christensen, Dubgaard, Hasler, Hime, Ladenburg, Levin, Martinsen and Nissen2012), no study has directly examined general trust in experts. It is often asserted that perceived credibility is a crucial element of survey design (e.g., Johnston et al., Reference Johnston, Boyle, Adamowicz, Bennett, Brouwer, Cameron, Hanemann, Hanley, Ryan, Scarpa and Tourangeau2017; Welling et al., Reference Welling, Zawojska and Sagebiel2022), which can influence protest votes (c.f., Meyerhoff and Liebe, Reference Meyerhoff and Liebe2009; Chen and Hua, Reference Chen and Hua2015; Rakotonarivo et al., Reference Rakotonarivo, Schaafsma and Hockley2016; Makriyannis et al., Reference Makriyannis, Johnston and Zawojska2024), and welfare estimates (Oh and Hong, Reference Oh and Hong2012; Remoundou et al., Reference Remoundou, Kountouris and Koundouri2012). Yet to the best of our knowledge no previous study has (a) ascertained to what extent respondents trust that experts can credibly provide reliable information, and (b) examined how this affects status quo choices, stated certainty and ultimately welfare estimates. Our study, therefore, fills this gap and investigates how general trust in experts can influence behaviour in, and results from SP surveys.
SP surveys provide respondents with information about the policy context and background to ensure that responses are well-informed (Mariel et al., Reference Mariel, Hoyos, Meyerhoff, Czajkowski, Dekker, Glenk, Jacobsen, Liebe, Olsen, Sagebiel and Thiene2021) and that estimated values are internally valid (Rakotonarivo et al., Reference Rakotonarivo, Schaafsma and Hockley2016). Under uncertainty, public preferences and risk perception are a strong, but not sole, influence on whether a regulator overinvests in abatement measures (Salanié and Treich, Reference Salanié and Treich2009). When an SP survey is designed to elicit public preferences in a context that is unfamiliar to respondents or inherently uncertain, researchers must clearly communicate both the current state of scientific evidence and areas of uncertainty (Johnston et al., Reference Johnston, Boyle, Adamowicz, Bennett, Brouwer, Cameron, Hanemann, Hanley, Ryan, Scarpa and Tourangeau2017). We distinguish between risky attributes, where probabilities are known and explicitly stated, and uncertain attributes, where probabilities are unknown or imprecise (Shaw, Reference Shaw2016).
Our study focuses on microplastics, a topic with high public awareness (Janzik et al., Reference Janzik, Koch, Zamariola, Vrbos, White, Pahl and Berger2024) but significant scientific uncertainty regarding long-term human health effects (Catarino et al., Reference Catarino, Kramm, Völker, Henry and Everaert2021). The accumulation of microplastics in the marine environment increases the likelihood of harm, particularly through immune and inflammatory responses (e.g., Duis and Coors, Reference Duis and Coors2016; Burns and Boxall, Reference Burns and Boxall2018; Kosuth et al., Reference Kosuth, Mason and Wattenberg2018; De-la-Torre, Reference De-la-Torre2020; Prata et al., Reference Prata, da Costa, Lopes, Duarte and Rocha-Santos2020; Vethaak and Legler, Reference Vethaak and Legler2021; Thompson et al., Reference Thompson, Courtene-Jones, Boucher, Pahl, Raubenheimer and Koelmans2024). While plastic production and public awareness continues to increase (Lebreton et al., Reference Lebreton, Slat and Ferrari2018), qualitative research suggests that there remains a notable gap between subject-matter experts, such as toxicologists and environmental scientists, and public perceptions regarding microplastics potential health risks (Kramm et al., Reference Kramm, Steinhoff, Werschmöller, Völker and Völker2022). As respondents may not be aware of the true harmfulness of microplastics (Janzik et al., Reference Janzik, Koch, Zamariola, Vrbos, White, Pahl and Berger2024), expert assessments represent the primary source of information on potential health effects, though these assessments themselves remain uncertain. Expert assessments, which indicate that no direct health effects have been observed (Catarino et al., Reference Catarino, Kramm, Völker, Henry and Everaert2021), may contrast with public concerns about the spread and potential risks of microplastics (Kramm et al., Reference Kramm, Steinhoff, Werschmöller, Völker and Völker2022). Accurately and fairly communicating this mix of potential risks, while acknowledging that no direct health harms have been observed thus far, remains a challenge for both scientists (Catarino et al., Reference Catarino, Kramm, Völker, Henry and Everaert2021) and regulators interested in designing and justifying precautionary policies (c.f., King, Reference King2022).
Our study provides direct evidence that general confidence in experts influences choice behaviour in SP surveys. These findings extend prior research on trust in information sources (c.f., Kataria et al., Reference Kataria, Bateman, Christensen, Dubgaard, Hasler, Hime, Ladenburg, Levin, Martinsen and Nissen2012; LaRiviere et al., Reference LaRiviere, Czajkowski, Hanley, Aanesen, Falk-Petersen and Tinch2014; Chen and Hua, Reference Chen and Hua2015; Khachatryan et al., Reference Khachatryan, Rihn and Wei2021) by demonstrating that low pre-existing confidence in experts was associated with (a) a stronger bias towards choosing the status quo alternative in a choice experiment (CE; e.g., Meyerhoff and Liebe, Reference Meyerhoff and Liebe2009), (b) reduced response certainty (e.g., Dekker et al., Reference Dekker, Hess, Brouwer and Hofkes2016; Uggeldahl et al., Reference Uggeldahl, Jacobsen, Lundhede and Olsen2016; Dave et al., Reference Dave, Toner and Chen2023) and (c) differences in welfare estimates for uncertain attributes (e.g., Czajkowski et al., Reference Czajkowski, Hanley and LaRiviere2016). Although our design does not allow us to test whether the information itself in the survey affected stated confidence in experts, our results indicate that status quo bias, response certainty and welfare valuations are sensitive to perceived expert credibility in uncertain policy contexts.
Whereas state-of-the-art research has primarily examined how only the presentation of information, and not the beliefs about its credibility, may affect SP (e.g., Jacobsen et al., Reference Jacobsen, Boiesen, Thorsen and Strange2008; Hasselström and Håkansson, Reference Hasselström and Håkansson2014; Czajkowski et al., Reference Czajkowski, Hanley and LaRiviere2016; Chen and Cho, Reference Chen and Cho2019; Welling et al., Reference Welling, Zawojska and Sagebiel2022, Reference Welling, Sagebiel and Rommel2023; Makriyannis et al., Reference Makriyannis, Johnston and Zawojska2024), we examined how pre-existing beliefs about the reliability of expert-provided information can ultimately shape survey responses. In our non-experimental approach, all respondents received the same explanatory information about microplastics, including their definition, prevalence, health risks and regulation, before completing the SP task. We then asked respondents about their confidence in the ability of experts to provide reliable information, which captured general trust in expert-provided information and did not refer to a specific expert, field or institution.
Trustworthiness is often measured using five-item Likert scales (c.f., Sturgis et al., Reference Sturgis, Brunton-Smith and Jackson2021), though some studies, like ours, use a single-question measure, while others construct multi-item trust scales (Larson et al., Reference Larson, Clarke, Jarrett, Eckersberger, Levine, Schulz and Paterson2018). Trust and trustworthiness can be shaped by social norms (Sturgis et al., Reference Sturgis, Brunton-Smith and Jackson2021), media influence (He et al., Reference He, Mol, Zhang and Lu2015) and perceptions of competency (Levi and Stoker, Reference Levi and Stoker2000). Consequently, the response of regulators and scientists to microplastic pollution today may have lasting effects for the public’s perceived trust in these institutions. The aim of our study was to demonstrate that pre-existing beliefs about the reliability of expert-provided information can affect SP survey behaviour and results. Our findings underscore the importance of public confidence in experts in shaping SPs for environmental policy in the context of uncertainty.
The following section describes our research hypotheses, how we designed our CE and experts’ question, the econometric framework and how we used entropy balancing weights in the choice models to eliminate the effect of confounding variables within our cross-sectional research design, which may otherwise affect the identification of the effect on willingness to pay (WTP) of greater confidence in expert-provided information.
2. Methods
The context for our study is the restriction on the use of microplastics across multiple sectors proposed by the European Chemicals Agency (ECHA, 2019), given microplastics extreme persistence in the environment (c.f., Duis and Coors, Reference Duis and Coors2016; Burns and Boxall, Reference Burns and Boxall2018). We used an SP survey to evaluate consumer preferences for this restriction on intentionally added microplastics in cosmetics, and thus our WTP estimates may be of particular relevance to similar regulators. The context for our study was cosmetics because they are a significant source of intentionally added microplastics, and consumers are more familiar with these products than other applications. An SP survey was the appropriate method to investigate ex ante preferences for hypothetical trade-offs regarding attributes of cosmetic products. The UK was selected as the study site due to its large market for cosmetics and its potential subjection to the restrictions (ECHA, 2019). While there is limited SP evidence on preferences for microplastic restrictions (King, Reference King2022), prior work has demonstrated that respondents may be willing to pay to reduce concentrations of other marine pollutants (e.g., Logar et al., Reference Logar, Brouwer, Maurer and Ort2014; Choi and Lee, Reference Choi and Lee2018; Kim et al., Reference Kim, Lee and Yoo2019; Abate et al., Reference Abate, Borger, Aanesen, Falk-Andersson, Wyles and Beaumont2020).
2.1. Hypotheses
We formally tested three hypotheses about the influence of pre-existing confidence in expert-provided information on SP survey results. Hypothesis One ( $H_0^1)$ tested whether the frequency of choosing Option A (status quo) or B (ECHA restriction) varied across different levels of confidence in experts. Prior studies of status quo behaviour in CEs (e.g., Meyerhoff and Liebe, Reference Meyerhoff and Liebe2009) have shown that it may be related to respondents having information (e.g., Welling et al., Reference Welling, Zawojska and Sagebiel2022). Moreover, Czajkowski et al. (Reference Czajkowski, Hanley and LaRiviere2016) commented that status quo choices could be driven by strategic protest votes. In our study, we hypothesised that respondents who were less confident in the ability of experts to provide reliable information were more biased towards the status quo alternative which proposed that no restrictions would be enacted. Hypothesis One (equation (1)) was tested using ${\chi ^2}$ tests against the null hypothesis that there was no difference in the frequency of choices between confidence levels. Pairwise testing the frequency of status quo choices across each of the five confidence levels led to a diagonal matrix of results:
 \begin{equation}H_0^1:{\text{ }}Choices{{\text{ }}_{{\text{Confidence}} = = {\text{ }}1}} = Choice{s_{{\text{ Confidence}} \ne 1}}.\end{equation}
 Hypothesis Two  $(H_0^2)$ tested whether respondents’ response certainty varied with different levels of confidence in experts. There is a rich literature on the effect of stated choice certainty on SPs (Dekker et al., Reference Dekker, Hess, Brouwer and Hofkes2016; Dave et al., Reference Dave, Toner and Chen2023), especially in the contingent valuation literature (Brouwer et al., Reference Brouwer, Dekker, Rolfe and Windle2010). Although particular attention has been paid to the effect of certainty on hypothetical bias (e.g., Blomquist et al., Reference Blomquist, Blumenschein and Johannesson2009; Morrison and Brown, Reference Morrison and Brown2009; Loomis, Reference Loomis2014), there appears to be no consistent approach to measuring choice certainty. Dave et al. (Reference Dave, Toner and Chen2023) used two different scales (two and five points each), Dekker et al. (Reference Dekker, Hess, Brouwer and Hofkes2016) used a five-point scale, while others used scales with ten or more points (e.g., Morrison and Brown, Reference Morrison and Brown2009; Brouwer et al., Reference Brouwer, Dekker, Rolfe and Windle2010; Uggeldahl et al., Reference Uggeldahl, Jacobsen, Lundhede and Olsen2016). Blomquist et al. (Reference Blomquist, Blumenschein and Johannesson2009) even compare calibration results between a two-point and ten-point certainty scale, finding that high scores reflected higher certainty. Common throughout the literature is the use of descriptive language; ‘very unsure’ to ‘very sure’, which we echoed with our simple three-point descriptive scale; unsure, quite sure, very sure, to balance ease of interpretation and informative value. As asking respondents to indicate choice certainty is unlikely to affect follow-up behaviour (Brouwer et al., Reference Brouwer, Dekker, Rolfe and Windle2010), we asked respondents to indicate their response certainty question immediately after our four choice tasks, and prior to the confidence in expert question.
Previous work has examined how certainty affects choices and WTP (Dekker et al., Reference Dekker, Hess, Brouwer and Hofkes2016; Uggeldahl et al., Reference Uggeldahl, Jacobsen, Lundhede and Olsen2016), while here we were interested in the effect of greater confidence in experts on stated choice certainty. We formally tested Hypothesis Two (equation (2)) with  ${\chi ^2}{\text{ }}$tests to determine whether the frequency of each level of choice certainty (unsure, quite sure, very sure) was the same between each level of confidence in experts. The null hypothesis was no difference in choice frequency between different confidence levels and we again reported a 20-element diagonal matrix comparing the five levels against each other.
 \begin{equation}H_0^2:{\text{ }}Certaint{y_{{\text{Confidence}} = = 1{\text{ }}}} = Certaint{y_{{\text{ Confidence}} \ne 1}}.\end{equation}
 Hypothesis Three  $\left( {H_0^3} \right)$ tested whether mean attribute WTP varied between levels of confidence. This test indicated how confidence affected the values used in welfare calculations. Previous work has demonstrated that WTP values may be sensitive to the presence of information (e.g., Munro and Hanley, Reference Munro, Hanley, Bateman and Willis2002; Czajkowski et al., Reference Czajkowski, Hanley and LaRiviere2016), but not to the best of our knowledge, to respondents’ pre-existing beliefs about the reliability of expert provided information. We applied the Mann–Whitney non-parametric test of means to test differences in WTP (equation (3)). This test is better suited to evaluating whether mean WTP was statistically different at different levels of confidence in experts than the Poe et al. (Reference Poe, Giraud and Loomis2005) test of differences across the distribution of WTP (e.g., Hynes et al., Reference Hynes, Armstrong, Xuan, Ankamah-Yeboah, Simpson, Tinch and Ressurreição2021a, Reference Hynes, Ankamah-Yeboah, O'Neill, Needham, Xuan and Armstrong2021b).
 \begin{equation}H_0^3:{\text{ }}WT{P_{{\text{ }}Attribute,{\text{ Confidence}} = = {\text{ }}1}} = WT{P_{{\text{ }}Attribute,{\text{ Confidence}} \ne {\text{ }}1}}.\end{equation}
We tested Hypothesis Three using conditional WTP recovered from two random parameter Mixed Logit (MXL) models: one estimated as standard practice without weights, while the other included entropy-balancing preprocessing weights in the log-likelihood function to eliminate the effect of potential confounders. Both models were otherwise specified identically with covariate controls and interaction effects to identify the effect of greater confidence in experts on WTP.
2.2. CE design
To evaluate consumer preferences, we included a CE. CEs are based on Lancaster’s (Reference Lancaster1966) characteristics theory of value, which posits that goods are considered to be a combination of their characteristics or attributes. CEs ask respondents to select their preferred alternative option, described by a series of attributes that vary by the levels they take (Hoyos, Reference Hoyos2010). Respondents are assumed to be utility-maximising and select an alternative with levels of attributes that maximise their utility (Train and Weeks, Reference Train, Weeks, Scarpa and Alberini2005). Where a price attribute is included, respondents’ attribute specific WTP for marginal changes in attribute levels can be recovered (Mariel et al., Reference Mariel, Hoyos, Meyerhoff, Czajkowski, Dekker, Glenk, Jacobsen, Liebe, Olsen, Sagebiel and Thiene2021).
Our CE design (table 1) used a binary or pairwise design with two alternatives: an opt-out status quo (Option A) and a scenario with changes in attributes likely to arise from the proposed ECHA restriction (Option B). We included a status quo as (a) respondents’ utility may be highest in the status quo, (b) holding the status quo at zero permits identification of the other parameters and (c) it facilitates welfare calculations (Boyle and Özdemir, Reference Boyle and Özdemir2009; Meyerhoff and Liebe, Reference Meyerhoff and Liebe2009). Our design was purposefully simple, given the complexities of describing microplastic pollution. To minimise respondents’ cognitive burden, we thus chose to include only a single changing alternative, Option B. While having a binary choice may improve incentive compatibility, including three or more alternatives may allow for increased precision in the resulting estimates (Jacobsen et al., Reference Jacobsen, Boiesen, Thorsen and Strange2008; Mariel et al., Reference Mariel, Hoyos, Meyerhoff, Czajkowski, Dekker, Glenk, Jacobsen, Liebe, Olsen, Sagebiel and Thiene2021). However, including fewer alternatives may also reduce status quo choices (c.f., Boyle and Özdemir, Reference Boyle and Özdemir2009; Oehlmann et al., Reference Oehlmann, Meyerhoff, Mariel and Weller2017), although this is debated and may also be related to the number of choice tasks and attributes (Mariel et al., Reference Mariel, Hoyos, Meyerhoff, Czajkowski, Dekker, Glenk, Jacobsen, Liebe, Olsen, Sagebiel and Thiene2021).
Example choice task given to respondents

Table 1 Long description
The table compares two product options across three attributes: reduced product effectiveness, reduced microplastics released, and increased price, followed by a blank row for the respondent’s preference. Option A shows no reduction in product effectiveness and no reduction in microplastics released, with no price increase. Option B shows a five percent reduction in product effectiveness and a ten percent reduction in microplastics released, with a one pound price increase. Compared with Option A, Option B offers a larger environmental improvement but with a small performance trade-off and higher cost. The final “I prefer” row contains no selection, indicating the choice is to be made by the respondent.
Note: Explanatory text and attribute descriptions were provided following pre-testing.
The alternatives were described by three attributes: two non-monetary (percentage reduction in product performance and percentage reduction in microplastics released) and one monetary (product price). To generalise across cosmetic products, we described them only via price and product performance, which were the most salient in pre-testing, but future work to increase fidelity to market products and include more attributes may be insightful. The attribute description and the levels they took were chosen following a pre-testing process and were described in depth to respondents in the final survey before answering. Pilot versions of the survey experimented with an attribute described as changes in microplastics ingested. This attribute was ultimately removed as there was insufficient scientific evidence to quantify the relationship between microplastics released from cosmetics and the resulting levels of human ingestion, making it difficult for respondents to meaningfully evaluate this attribute.
The ‘product performance’ attribute had three levels: (5, 10 and 50 per cent). We expected the mean attribute WTP to take a negative sign as respondents would not be willing to pay for reduced product performance. The reduction in release attribute, referred to as ‘microplastics released’, was similar to the ‘potential environmental risk’ attributes used in Logar et al. (Reference Logar, Brouwer, Maurer and Ort2014). The attribute had three levels (10, 40 and 90 per cent) and was expected to have a positive sign as respondents were expected to value improved environmental quality. The monetary ‘price’ attribute had four levels (£0.50, £1.00, £2.50, £5.00) representing an increase in the current per-price value, although for generality, we did not mention a base comparison price. The CE used an orthogonal main-effects design using IBM SPSS Statistics 26. There were 16 different choice sets, and each respondent completed one randomly assigned block of four choices. Blocking of the sets was used to minimise task complexity and cognitive burden (Mariel et al., Reference Mariel, Hoyos, Meyerhoff, Czajkowski, Dekker, Glenk, Jacobsen, Liebe, Olsen, Sagebiel and Thiene2021).
2.2.1. Experts question
We evaluated respondent pre-existing beliefs with a five-level (1 — Unconfident, 5 — Very confident) Likert scale that asked, ‘How confident are you in the ability of experts to provide reliable information?’. Beliefs are thus general rather than domain or expert specific. For all respondents, the question was placed after the valuation exercises so as to not otherwise influence behaviour. Although this preserves the content validity of the CE, the placement means that we cannot determine whether confidence was affected by the survey instrument itself. As such, we assume that confidence in experts was exogenously determined by external factors and pre-existing attitudes. The context for the question was the information provided to respondents prior to the CE, explaining the restrictions on microplastics in cosmetics (figures A1–A4 in the online appendix). The information aimed to describe the scientific uncertainty surrounding the potential environmental and health effects of microplastics, but did not specify any one single expert, field or organisation. Therefore, we chose to ask the respondents about ‘experts’ in general and focused on respondents’ beliefs about the reliability of the information itself, rather than the type, presentation or processing of information (c.f., Czajkowski et al., Reference Czajkowski, Hanley and LaRiviere2016; Welling et al., Reference Welling, Zawojska and Sagebiel2022).
Our approach, therefore, specifically assessed the influence of confidence in expert-provided information influences survey responses. We measured this with a five-item Likert scale and one question whereas Sturgis et al. (Reference Sturgis, Brunton-Smith and Jackson2021) used a five-item strongly agree-disagree Likert scale with seven questions to more fully describe public trust in different scientists and experts. Although Larson et al. (Reference Larson, Clarke, Jarrett, Eckersberger, Levine, Schulz and Paterson2018) found that the most common approach to measuring trust was a single question of a five-item Likert scale, they cautioned that a scale — i.e., multiple questions on aspects of trust — may provide greater insight. As such, future SP research may be enhanced by using a validated scale with several questions to construct a latent variable of ‘trust,’ which a hybrid model could use to explain choices (c.f., Dekker et al., Reference Dekker, Hess, Brouwer and Hofkes2016; Faccioli et al., Reference Faccioli, Czajkowski, Glenk and Martin-Ortega2020; Buckell et al., Reference Buckell, Hensher and Hess2021).
We visualise the distribution of responses in figures A5 and A7 (online appendix) broken down by responses to the perceived risks of microplastics to the respondent and to the environment, and report three positive and significant correlation tests. These results show that respondents who perceived there to be a greater threat from microplastics were typically also those to be more highly confident in the ability of experts to provide reliable information. Intuitively this follows as respondents who are more confident in experts’ reliability may then perceive greater health risks possible from microplastics (c.f., Kramm et al., Reference Kramm, Steinhoff, Werschmöller, Völker and Völker2022). Future work with a validated scale with more comprehensive items may be beneficial in this context to fully elucidate how confident respondents are in the ability of experts to provide reliable information, especially about areas of uncertainty. Moreover, varying the placement of the question in the survey may reveal the extent to which survey information affects beliefs about confidence in the ability of experts to provide reliable information.
2.3. Econometric framework
CE data were analysed using the Random Utility Model (Train and Weeks, Reference Train, Weeks, Scarpa and Alberini2005), and participants were assumed to choose the utility-maximising alternative in a CE. We write the utility U of respondent n choosing option i in equation (4) as a vector  ${X_{in}}$ of the CE attributes (price, product performance, microplastics released) that are individual n and option i specific with the ${\beta _n}$ parameters that vary across respondents. The MXL approach provided insight into preference heterogeneity in the sample (Hynes et al., Reference Hynes, Armstrong, Xuan, Ankamah-Yeboah, Simpson, Tinch and Ressurreição2021a) as we recovered the mean and variance of the distribution of $\beta $ parameters, rather than assuming fixed coefficients. We used MXL to allow for random heterogeneity in the attributes and allow for more flexible substitution. The MXL models were simulated using 2000 Sobol draws (Czajkowski and Budziński, Reference Czajkowski and Budziński2019). Equation (4) featured an error term ${\varepsilon _{in}}$ independently and identically distributed extreme value (Mariel et al., Reference Mariel, Hoyos, Meyerhoff, Czajkowski, Dekker, Glenk, Jacobsen, Liebe, Olsen, Sagebiel and Thiene2021). Although we do not investigate the error variance, i.e., the scale parameter in this research given theoretical challenges (c.f., Hess and Rose, Reference Hess and Rose2012; Hess and Train, Reference Hess and Train2017), future research with a larger sample could follow the Swait and Louviere (Reference Swait and Louviere1993) method to investigate whether pre-existing confidence in the reliability of experts in general affected error variance.
 \begin{equation}{U_{in}} = {\beta _n}{X_{in}} + {\varepsilon _{in}}.\end{equation}
 The conditional probability of a respondent n choosing option i is the probability that the utility of option i is greater than the utility of any other available option  $j$ in the set ${C_n}$ (equation (5)),
 \begin{equation}{P_{in}} = Pr\left( {U_{in}} \gt {U_{jn,\forall j \ne i}} \right) = \left\{ \frac{\exp \left( {{\beta _n}{X_{in}}} \right)}{\mathop \sum \limits_{j \in {C_n}}\exp \left( {{\beta _n}{X_{jn}}} \right)} \right\}.\end{equation}
 The log-likelihood of the model can be written as equation (6). As we used the MXL, a simulated log-likelihood was used to solve the expression by integrating over draws from a random distribution; further elaboration is widely available in the literature (e.g., Train and Weeks, Reference Train, Weeks, Scarpa and Alberini2005). Hynes et al. (Reference Hynes, Armstrong, Xuan, Ankamah-Yeboah, Simpson, Tinch and Ressurreição2021a) demonstrated that entropy-balancing weights  $\left( {{w_n}} \right)$ may be directly included in the log-likelihood function. We justify the use of entropy balancing weights as our cross-sectional data meant that we cannot randomly assign respondents to different levels of confidence in experts, raising the possibility that pre-existing differences between respondents with higher/lower confidence could confound our results. To mitigate this concern, we used entropy balancing to reweight our sample and achieve covariate balance. In an unweighted model, these weights equal one for all respondents.
 \begin{equation}LL\left( 0 \right) = {\text{ }}\mathop \sum \limits_{n = 1}^N {w_n}\ln {P_{in}}.\end{equation}
Equation (7) specifies the indirect utility function for alternative B as coded in R. We specified one beta for each non-zero level of our non-monetary attributes to investigate non-linearity. A normal distribution was assumed for each non-monetary attribute to allow for both negative and positive preferences (Beharry-Borg and Scarpa, Reference Beharry-Borg and Scarpa2010; Faccioli et al., Reference Faccioli, Czajkowski, Glenk and Martin-Ortega2020). We specified the price parameter to be negative lognormally distributed to ensure the theoretically expected negative sign (e.g., Ghosh et al., Reference Ghosh, Maitra and Das2013; Czajkowski et al., Reference Czajkowski, Budziński, Campbell, Giergiczny and Hanley2017; Mariel et al., Reference Mariel, Hoyos, Meyerhoff, Czajkowski, Dekker, Glenk, Jacobsen, Liebe, Olsen, Sagebiel and Thiene2021). Further, using a lognormal for the monetary attribute and then estimating in WTP-space may also avoid validity issues with recovering WTP as the ratio of two random normal distributions (c.f., Train and Weeks, Reference Train, Weeks, Scarpa and Alberini2005; Daly et al., Reference Daly, Hess and Train2012; Sarrias, Reference Sarrias2020). Although a normally distributed price parameter may be behaviourally plausible in the context of luxury cosmetics good, our CE description listed several typically inexpensive personal care products: toothpaste, shampoo, shower gel, deodorant and most often SPF50 sunscreen. As such, our bid levels may represent a larger fraction of the price and pre-testing demonstrated that respondents were price sensitive at the levels presented in the CE. However, if respondents were considering luxury cosmetics, such as perfumes, instead, our bid levels would have been a smaller fraction of the more expensive price, thus reducing price-sensitivity in the estimated model. Future work to repeat our CE with luxury cosmetics instead may be insightful into how important environmental effects are for this type of consumer.
 \begin{align}V_{iA}&=ASC_{SQ}+\beta_{Price}\nonumber \\
& \quad \ast(Price_B+\beta_{ProductPerformance,Medium}\ast(ProductPerformance_A==10) \nonumber\\
& \quad +\beta_{ProductPerformance,High}\ast(ProductPerformance_A==50)\nonumber\\
& \quad +\beta_{MicroplasticsReleased,Medium}\ast(MicroplasticsReleased_A==40)\nonumber\\
& \quad +\beta_{MicroplasticsReleased,High}\ast(MicroplasticsReleased_A==90))+Interactions\end{align}
\begin{align}V_{iA}&=ASC_{SQ}+\beta_{Price}\nonumber \\
& \quad \ast(Price_B+\beta_{ProductPerformance,Medium}\ast(ProductPerformance_A==10) \nonumber\\
& \quad +\beta_{ProductPerformance,High}\ast(ProductPerformance_A==50)\nonumber\\
& \quad +\beta_{MicroplasticsReleased,Medium}\ast(MicroplasticsReleased_A==40)\nonumber\\
& \quad +\beta_{MicroplasticsReleased,High}\ast(MicroplasticsReleased_A==90))+Interactions\end{align}Equation (8) included an interactions term (Interactions) where the confidence in experts’ question (coded as a continuous variable with values from 1–5) was interacted with the two levels of each non-monetary attribute to evaluate the multifaceted effect of confidence.
 \begin{align}
Interactions & = {\beta _{Exp*P10}}*\left( {Experts*ProductPerformanc{e_{10}}} \right) \nonumber\\
& \quad + {\beta _{Exp*P50}}*\left( {Experts*ProductPerformanc{e_{50}}} \right) \nonumber\\
& \quad + {\beta _{Exp*MR40}}*\left( {Experts*MicroplasticsReleas{d_{40}}} \right) \nonumber\\
& \quad + {\beta _{Exp*MR90}}*\left( {Experts*MicroplasticsReleas{d_{90}}} \right). \end{align}
\begin{align}
Interactions & = {\beta _{Exp*P10}}*\left( {Experts*ProductPerformanc{e_{10}}} \right) \nonumber\\
& \quad + {\beta _{Exp*P50}}*\left( {Experts*ProductPerformanc{e_{50}}} \right) \nonumber\\
& \quad + {\beta _{Exp*MR40}}*\left( {Experts*MicroplasticsReleas{d_{40}}} \right) \nonumber\\
& \quad + {\beta _{Exp*MR90}}*\left( {Experts*MicroplasticsReleas{d_{90}}} \right). \end{align} The specification of the indirect utility function for Alternative A included an Alternative Specific Coefficient ( $AS{C_{SQ}}$) in equation (9) to indicate the respondent's degree of status quo bias (Brouwer et al., Reference Brouwer, Hadzhiyska, Ioakeimidis and Ouderdorp2017). The ASC was interacted with survey debriefing questions to control for the effect of socioeconomic factors on respondents’ choices.
 \begin{align}
AS{C_{SQ}} & = ASC + \left( {{\beta _{Age}}*Ag{e_{dummy}}} \right) + \left( {{\beta _{BluePlanet}}*BluePlanet} \right) \nonumber\\
& \quad + \left( {{\beta _{Certa\operatorname{int} y}}*Certaint{y_{Q12}}} \right) + \left( {{\beta _{Charity}}*Charity} \right) \nonumber\\
& \quad + \left( {{\beta _{ConcernQ13}}*Concer{n_{Q13}}} \right) + \left( {{\beta _{Concern,Q14}}*Concer{n_{Q14}}} \right) \nonumber\\
& \quad + \left( {{\beta _{Concern,Q15}}*Concer{n_{Q15}}} \right) + \left( {{\beta _{Consequential}}*Consequential} \right) \nonumber\\
& \quad + \left( {{\beta _{Education}}*Education} \right) + \left( {{\beta _{Gender}}*Gender} \right) + \left( {{\beta _{Income}}*Incom{e_{dummy}}} \right) \nonumber\\
& \quad + \left( {{\beta _{Knowledge}}*Knowledg{e_{Q5}}} \right) + \left( {{\beta _{Order}}*Order} \right). \end{align}
\begin{align}
AS{C_{SQ}} & = ASC + \left( {{\beta _{Age}}*Ag{e_{dummy}}} \right) + \left( {{\beta _{BluePlanet}}*BluePlanet} \right) \nonumber\\
& \quad + \left( {{\beta _{Certa\operatorname{int} y}}*Certaint{y_{Q12}}} \right) + \left( {{\beta _{Charity}}*Charity} \right) \nonumber\\
& \quad + \left( {{\beta _{ConcernQ13}}*Concer{n_{Q13}}} \right) + \left( {{\beta _{Concern,Q14}}*Concer{n_{Q14}}} \right) \nonumber\\
& \quad + \left( {{\beta _{Concern,Q15}}*Concer{n_{Q15}}} \right) + \left( {{\beta _{Consequential}}*Consequential} \right) \nonumber\\
& \quad + \left( {{\beta _{Education}}*Education} \right) + \left( {{\beta _{Gender}}*Gender} \right) + \left( {{\beta _{Income}}*Incom{e_{dummy}}} \right) \nonumber\\
& \quad + \left( {{\beta _{Knowledge}}*Knowledg{e_{Q5}}} \right) + \left( {{\beta _{Order}}*Order} \right). \end{align}2.4. Entropy balancing
While randomized experiments are the gold standard for causal inference, our study relies on cross-sectional survey data, where unobserved confounding may still exist. One increasingly popular approach for observational data is to re-weight samples to achieve covariate balance (Vass et al., Reference Vass, Boeri, Poulos and Turner2022). Re-weighting the sample with balancing weights is an important step as confounding variables, namely those we observe in the survey, may influence choices directly and indirectly (e.g., Hynes et al., Reference Hynes, Armstrong, Xuan, Ankamah-Yeboah, Simpson, Tinch and Ressurreição2021a, Reference Hynes, Ankamah-Yeboah, O'Neill, Needham, Xuan and Armstrong2021b). If confidence levels differ systematically across key covariates, observed associations may be confounded. Entropy balancing allows us to adjust for these observed differences, improving internal validity when comparing groups. Observed confounders can be controlled for if weights can be estimated that balance between the groups’ observed characteristics. By weighting our sample to have zero covariate differences, any differences in choices, confidence and WTP are attributable to the differences between respondents’ confidence in experts.
Many weighting methods have aimed for high levels of covariate balance while maintaining sample size. Hainmueller (Reference Hainmueller2012) proposed entropy balancing as an algorithmic solution to always achieve high levels of balance, and it has since been shown to be robust in a range of contexts (Zhao and Percival, Reference Zhao and Percival2016). In the CE literature, Hynes et al. (Reference Hynes, Ankamah-Yeboah, O'Neill, Needham, Xuan and Armstrong2021b) demonstrated how entropy balancing weights could be used in log-likelihood functions to weight observations from different groups. While Hynes et al. (Reference Hynes, Ankamah-Yeboah, O'Neill, Needham, Xuan and Armstrong2021b) used weighting with their binary [yes, no] question, we used weighting with a five-item Likert scale. We treated the Likert scale as a continuous variable and estimated weights for each level. Entropy balancing for continuous treatments has been favourably evaluated beforehand by Tübbicke (Reference Tübbicke2021).
Table A1 (online appendix) reports the group mean pre and post balancing for each variable for each level of confidence in experts. We used 11 variables from our survey (age, blue planet viewing, charity involvement, coronavirus impact, distance, education, employment, gender, knowledge, income, question order) to weight the samples which a priori were expected to influence choices (Faccioli et al., Reference Faccioli, Czajkowski, Glenk and Martin-Ortega2020). Income, well-known to influence WTP, was measured using income brackets of gross monthly income, a measure that respondents were most familiar with. The results were dummy coded as above/below sample mean income. A dummy for whether respondents’ income was affected by the coronavirus pandemic (survey taken in April 2020) was also included for completeness. We controlled for self-reported distance from the coast (categories of kilometres from the coast), which may influence preferences for marine pollution (Hynes et al., Reference Hynes, Armstrong, Xuan, Ankamah-Yeboah, Simpson, Tinch and Ressurreição2021a), and survey question order (Day and Prades, Reference Day and Prades2010). Other variables were included as they were expected (Mihelj et al., Reference Mihelj, Kondor and Štětka2022) to influence confidence in expert-provided information, e.g., respondent age, whether they had watched the Blue Planet TV programme (Hynes et al., Reference Hynes, Ankamah-Yeboah, O'Neill, Needham, Xuan and Armstrong2021b), were involved in or donated to charity, or had higher self-reported prior knowledge of microplastic pollution elicited on a 1–5 scale as prior attitudinal differences could explain differences in confidence levels. It was important to control for the effect of prior knowledge, as higher knowledge could explain differences in confidence, choices and WTP. Table A2 (online appendix) indicates that entropy balancing achieved a very high balance (difference less than 0.000) between each level of pre-existing confidence. Weights were calculated for the population average treatment effect. We then incorporated the weights directly into the log-likelihood function of the weighted MXL models.
2.5. Data collection
The survey was designed between November 2019 and February 2020 with Environment Agency, industry representatives and academic experts per Johnston et al.’s (Reference Johnston, Boyle, Adamowicz, Bennett, Brouwer, Cameron, Hanemann, Hanley, Ryan, Scarpa and Tourangeau2017) guidance for SP surveys. It included a small pilot study (N = 50) to refine the CE description. The survey had five sections: (1) understanding the socioeconomic distribution of the sample, (2–3) SP tasks, (4) assessing environmental attitudes and perceived risks and (5) debriefing questions including confidence in experts. Section 3 included two contingent valuation questions; discussed in King (Reference King2022). In April 2020, DJS Research Ltd collected 670 UK adult responses to the online survey, reflecting a response rate of 65 per cent. An average respondent took 7.5 minutes to complete the 25 separate questions.  ${\chi ^2}{\text{ }}$tests report that the sample was broadly representative of the UK adult population along socioeconomic characteristics (online appendix table A3). Sample income was marginally lower than the total UK population, possibly owing to having more female or student respondents in the sample. Full replication is possible through the publicly available exact survey design, estimation R code and output data at the author’s Github (https://github.com/pmpk20/PhD_CEPaper). The work was undertaken during time at the University of Bath and additional support was facilitated by the Specialist and high-performance computing at University of Kent. The analysis was conducted in R (Version 4.2.0) using the WeightIt and Apollo packages (Hess and Palma, Reference Hess and Palma2019; Greifer, Reference Greifer2022; R Core Team, 2022). Ethical approval for the data collection was granted by the University of Bath.
3. Results
3.1. Hypothesis One: Choices
The  ${\chi ^2}{\text{ }}$tests showed that respondents’ choices were statistically different depending on their pre-existing level of confidence in experts (figure 1 and table 2). We, therefore, rejected Hypothesis One; having greater confidence in experts reduced status quo bias. We can further delineate the relationship between confidence and choices by stated certainty (figure A6, online appendix). The status quo Option A was the most commonly chosen by low confidence levels, while higher confidence respondents increasingly chose Option B (figure 1), e.g., the proportion of respondents who always chose the status quo Option A was 18 per cent (N = 127), which was higher amongst those with low confidence <3/5 (26 per cent, N = 83) than higher confidence >3/5 (12 per cent, N = 44). The exact frequencies are reported in table A4 (online appendix).
Percentage of choices for either Option A or B by self-reported confidence in experts. Horizontal dotted line drawn at 50 per cent of choices.
 ${\chi ^2}$ test statistics (p values in parentheses) against the null hypothesis that choice frequency did not differ between levels of self-reported confidence in experts

Table 2 Long description
The table reports pairwise chi-squared test results comparing choice frequencies between self-reported confidence levels from 1 out of 5 to 5 out of 5, with each cell giving a test statistic and its p value. Nearly all comparisons are statistically significant, with p values below 0.05 for most pairs. The strongest differences occur when confidence 4 out of 5 is compared with 1 out of 5 (statistic 429.456, p less than 0.000) and with 5 out of 5 (statistic 5.461, p 0.019), and when confidence 3 out of 5 is compared with 1 out of 5 (statistic 197.211, p less than 0.000). Comparisons involving adjacent lower levels are smaller but still often significant, such as 1 out of 5 versus 2 out of 5 (statistic 4.236, p 0.040) and 2 out of 5 versus 3 out of 5 (statistic 4.450, p 0.035). One notable exception is 5 out of 5 versus 4 out of 5, which is not statistically significant (statistic 2.644, p 0.104). The matrix is presented diagonally, so each pair appears once rather than twice, and the tests indicate differences in distributions but do not show direction or effect size.
Note: A diagonal matrix was produced to report all test combinations.
These results indicate that respondents who were more highly confident in the information from experts that microplastics may later cause a health risk were much more likely to choose a reformulated cosmetic (Option B) which may mitigate potential health risks. Conversely, when respondents do not have confidence in experts, they were much more averse to changes from the status quo (more likely to choose Option A).
3.2. Hypothesis Two: Choice certainty
The  ${\chi ^2}$ tests found that respondent's self-reported certainty in their responses was statistically different depending on their level of confidence in experts (figure 2 and table 3). We rejected Hypothesis Two as greater confidence affected respondents’ certainty. Each level of confidence was significantly different from each other in the frequency of each level of choice certainty. Figure 2 shows that the distribution of confidence in experts across the five levels was roughly normally distributed for those who were unsure about their choices but shifted and became more right-skewed among those who were highly sure about their choices. The shifting distribution was not caused by changes in the tails of the distributions – that is, respondents saying that they were 1/5 or 5/5 confident – but instead by the central mass shifting rightwards. The implication here is that highly sure respondents were also more confident in experts. While the skewness may reduce the counts for the ${\chi ^2}$ tests, we simulated the p values to ensure robustness. Respondents with the lowest (1/5) and highest (5/5) levels of confidence had the highest proportion of respondents reporting that they were very sure about their choices while others were less likely to be very sure. We further describe this relationship by choices in figure A6 (online appendix).
Choice certainty by levels of confidence in experts. Both most (5/5) and least (5/5) confidence respondents were much more likely to say, ‘very sure’ while ‘quite sure’ was the most common response for all others.

Figure 2 Long description
Three stacked bar charts titled Unsure (N equals 40), Quite Sure (N equals 328), and Very Sure (N equals 302). Unsure (N equals 40): The vertical axis label is Frequency. The vertical axis shows 0, 5, 10, 15, 20. The horizontal axis shows 1 over 5, 2 over 5, 3 over 5, 4 over 5, 5 over 5. Bar heights: 1 over 5 is about 1; 2 over 5 is about 7; 3 over 5 is about 23; 4 over 5 is about 5; 5 over 5 is about 4. Quite Sure (N equals 328): The vertical axis label is Frequency. The vertical axis shows 0, 50, 100, 150. The horizontal axis shows 1 over 5, 2 over 5, 3 over 5, 4 over 5, 5 over 5. Bar heights: 1 over 5 is about 3; 2 over 5 is about 25; 3 over 5 is about 150; 4 over 5 is about 125; 5 over 5 is about 30. Very Sure (N equals 302): The vertical axis label is Frequency. The vertical axis shows 0, 30, 60, 90. The horizontal axis shows 1 over 5, 2 over 5, 3 over 5, 4 over 5, 5 over 5. Bar heights: 1 over 5 is about 12; 2 over 5 is about 15; 3 over 5 is about 75; 4 over 5 is about 105; 5 over 5 is about 85. Bottom horizontal axis label: Self-reported confidence in experts (slash 5).
The  ${\chi ^2}$test statistic (p value in parentheses) against the null hypothesis that the frequency of respondents reporting each level of certainty was not statistically different between each level of confidence in experts

Table 3 Long description
The table reports pairwise chi-squared test results comparing whether the distribution of respondents’ certainty levels differs between two confidence-in-experts ratings from 1/5 to 5/5. Each filled cell gives the test statistic with its p value in parentheses; blank diagonal cells indicate comparisons of a level with itself. Nearly all comparisons show very small p values (reported as under 0.000), indicating strong evidence that certainty distributions differ across most confidence levels. The largest difference is between confidence 3/5 and 1/5 (test statistic 1150.433; p under 0.000), followed by 3/5 versus 5/5 (802.89; p under 0.000) and 4/5 versus 1/5 (670.813; p under 0.000). Several other large contrasts include 5/5 versus 2/5 (337.040; p under 0.000) and 4/5 versus 5/5 (354.443; p under 0.000). The main exception is confidence 1/5 versus 5/5, which is not statistically significant (test statistic 2.733; p 0.255). One comparison shows a smaller but still significant difference: confidence 2/5 versus 3/5 (test statistic 9.037; p 0.011). Because the table provides only test results, it indicates whether distributions differ but not which certainty categories are higher or lower in each group.
3.3. Hypothesis Three: WTP
The unweighted and weighted MXL models are presented in table 4 with further results in table A5 (online appendix). The resulting distributions of conditional attribute WTP are visualised in figure 3 with exact summary statistics for attribute WTP in table A6 (online appendix). Both models report estimates that are comparable in sign, significance and magnitude with price sensitivity (Price) as expected. We find evidence of status quo bias indicated by the highly significant and positive ASC coefficient. While respondents were only willing to pay to avoid larger changes in product performance (Product Performance: high), only the estimated mean parameter for smaller changes in the release of microplastics (Microplastics released: medium) was statistically different from zero. However, the standard deviations for each distribution of preferences were highly significant, suggesting that there was a large degree of respondent heterogeneity.
Selected estimated parameters from weighted and unweighted random-parameter mixed logit models

Table 4 Long description
The table reports coefficient estimates from weighted and unweighted random-parameter mixed logit models, with p values in parentheses testing whether each coefficient differs from zero. In both models, the status quo alternative-specific constant is positive (about 1.78, statistically significant). Price has a negative mean effect (weighted about minus 1.41; unweighted about minus 1.15; both significant), indicating higher price lowers choice probability. Product performance shows a small, not statistically significant effect at medium levels (about 0.36 weighted; 0.34 unweighted), but a large, statistically significant positive effect at high performance (about 2.25 weighted; 2.34 unweighted). Microplastics released has a statistically significant positive mean effect at medium levels (about 0.97 weighted; 1.15 unweighted), while the high microplastics level is not statistically significant in either model. Standard deviations for most attributes are statistically significant and often large, especially for the high microplastics level (about 3.63 weighted; 3.22 unweighted), suggesting substantial preference heterogeneity. Interaction terms show experts have no meaningful interaction with product performance, but experts have positive, statistically significant interactions with both medium and high microplastics levels (roughly 0.26 to 0.36). Model diagnostics are similar across specifications (N 670 each), with slightly better fit for the unweighted model based on lower AIC and BIC and a marginally higher adjusted R squared.
Notes: Results are the coefficient estimate and in parentheses are the p values against the null hypothesis that the true coefficient value is zero. In table A5 (online appendix), we detail all estimated results for our control variables (age, blue-planet viewership, respondent stated choice certainty, charity membership, environmental concern, distance from the coast, education levels, gender, income levels, self-reported knowledge of microplastics, survey order and self-reported survey understanding).
Box and whisker plots of the distributions of conditional mean WTP per confidence level (X-axis) per model. Price values are not truly WTP measures but instead the estimated price sensitivity. Y-axis scale varies across facets.

Figure 3 Long description
Five box and whisker plot subplots titled: Price; Product Performance: Medium; Product Performance: High; Microplastics Released: Medium; Microplastics Released: High. Legend text: Model type. Legend entries: Unweighted and Weighted. Each x-axis category contains two box and whisker plots, one for Unweighted and one for Weighted. Common axes text: The horizontal axis label reads Self-reported confidence in experts, with categories 1 over 5, 2 over 5, 3 over 5, 4 over 5, 5 over 5. The vertical axis label reads WTP in Pounds Per Product. Price subplot. Y-axis tick labels shown are 0.0, minus 2.5, minus 5.0, minus 7.5, minus 10.0. Across all five confidence categories, both model types have box medians below 0.0. The widest whisker ranges occur at 1 over 5 and 2 over 5, extending down near the minus 10.0 tick. At 3 over 5 to 5 over 5, the boxes and whiskers are shorter and cluster between 0.0 and minus 2.5. Product Performance: Medium subplot. Y-axis tick labels shown are 1.0, 0.5, 0.0, minus 0.5, minus 1.0. Across 1 over 5 to 5 over 5, both model types have box medians above 0.0 and below 0.5. The boxes are narrow with short whiskers at each confidence category. Product Performance: High subplot. Y-axis tick labels shown are 3.5, 3.0, 2.5, 2.0, 1.5. Across 1 over 5 to 5 over 5, both model types have box medians between the 2.0 and 2.5 ticks. The boxes and whiskers are similar in height across confidence categories. Microplastics Released: Medium subplot. Y-axis tick labels shown are 1.5, 1.0, 0.5. Across 1 over 5 to 5 over 5, both model types have box medians above 1.0 and below 1.5. The boxes are narrow with short whiskers at each confidence category. Microplastics Released: High subplot. Y-axis tick labels shown are 2.5, 0.0, minus 2.5, minus 5.0. Across 1 over 5 to 5 over 5, both model types have box medians near the 0.0 tick. The whiskers extend both above and below 0.0, with longer whiskers at 1 over 5 to 4 over 5 than at 5 over 5. Overall comparison across subplots: Price shows negative values with the largest spread at lower confidence categories. Product Performance: Medium and Microplastics Released: Medium show positive values with tight spreads. Product Performance: High shows higher positive values around the 2.0 to 2.5 range. Microplastics Released: High is centered near 0.0 with wider spreads than the Medium subplots.
There was no significant effect of confidence on the product performance attributes (Experts * ProductPerformance), possibly due to respondents already having defined knowledge and preferences about their cosmetic products that obviates the need for information from expert sources. Conversely, we found that confidence had a highly significant effect on the microplastic released attributes (Experts * MicroplasticsReleased). We argue that the microplastics released attribute was less familiar to respondents, especially compared to the product performance attribute, although we did not recover data on attribute-specific understanding or attendance. While respondents may be used to evaluating product price and performance, the microplastics released attribute necessitates them making subjective estimates of how many microplastics are currently included, and how reducing the number released influences microplastic pollution levels, a less common task. The positive sign on the microplastics released interaction terms indicate that more-confident respondents reported higher WTP. These interaction effects illustrate that the effect of confidence in expert sources only extended to information about which respondents may be a priori unsure about. Although there was very little observable difference in preferences for the two product performance attributes, both models indicate substantial variation in preferences for the price and microplastics released attributes. The price parameters for the lowest confidence respondents had a much wider distribution while the estimates for the higher confidence respondents were much tighter around their mean value.
We tested WTP from the unweighted model as choices in the weighted with balancing weights model are similar by design. For the product performance attribute, we largely could not reject the null hypothesis that the mean WTP was not statistically different between respondents with different confidence levels. The results fit intuitively with figure 3 where means for the microplastics released attribute only varied with confidence levels. Therefore, there were mixed results for Hypothesis Three as greater confidence in experts may affect respondents’ choices and resulting mean WTP only for uncertain and unfamiliar attributes (table A7, online appendix).
4. Discussion
In various contexts (e.g., Sjöberg, Reference Sjöberg1999; Cramer et al., Reference Cramer, Brodsky and DeCoster2009; Salanié and Treich, Reference Salanié and Treich2009; Sundblad et al., Reference Sundblad, Biel and Gärling2009; Bennett, Reference Bennett2020; Brennan, Reference Brennan, Baghramian and Martini2022; Mihelj et al., Reference Mihelj, Kondor and Štětka2022), public confidence in experts can strongly affect behaviour. In our work, we examined how pre-existing confidence in experts affected support for precautionary measures (King, Reference King2022) to restrict microplastics amidst public and expert uncertainty over their long-term effects (c.f., Janzik et al., Reference Janzik, Koch, Zamariola, Vrbos, White, Pahl and Berger2024). Our contribution to the SP literature is to demonstrate that survey behaviour – particularly status quo bias, response certainty and welfare measures – are all sensitive to pre-existing confidence in the reliability of expert-provided information. Our results indicate that more comprehensive strategies to restore and ensure public confidence in experts may have a downstream effect on building support for expert-recommended policies, especially in the context of uncertainty where the timely implementation of precautionary measures may be critical. Further improving our understanding of the determinants of public confidence in experts and how such differences can be influenced in scientific communication strategies may be beneficial.
Our findings indicate that respondents who had pre-existing higher confidence in experts were significantly more likely to choose reformulated cosmetics. In figure A7 (online appendix), we show that this higher confidence was positively correlated with higher perceived risks from microplastics (c.f., Kramm et al., Reference Kramm, Steinhoff, Werschmöller, Völker and Völker2022). Thus, respondents who were a priori more confident in the ability of experts to provide reliable information, perceived there to be greater health risks from microplastics, which we in turn suggest affected their choices and welfare estimates from our CE. Our results, therefore, suggest that public support for precautionary measures could be shaped by underlying trust in expertise rather than solely by the content of risk communication; building public trust in experts is, therefore, crucial in shaping support for or against precautionary policies.
We found that lower-confidence respondents were more likely to vote for the status quo. While the overall percentage of respondents consistently choosing the status quo was consistent with levels in the literature, notably the >50 per cent (Meyerhoff and Liebe, Reference Meyerhoff and Liebe2009; Carson et al., Reference Carson, Chilton, Hutchinson and Scarpa2020) or the >20 per cent in Welling et al. (Reference Welling, Zawojska and Sagebiel2022), the fact that this varied by level of confidence in experts is instructive. Status quo behaviour may arise from respondents being willing to pay something but not facing a combination of attributes they preferred across their four choices (Boxall et al., Reference Boxall, Adamowicz and Moon2009), or design of the CE itself (e.g., Oehlmann and Meyerhoff., Reference Oehlmann and Meyerhoff2017; Oehlmann et al., Reference Oehlmann, Meyerhoff, Mariel and Weller2017; Welling et al., Reference Welling, Zawojska and Sagebiel2022), although our binary choice design may result in fewer status quo choices (Boyle and Özdemir, Reference Boyle and Özdemir2009), Moreover, Haghani et al. (Reference Haghani, Bliemer, Rose, Oppewal and Lancsar2021) suggested that task complexity could motivate status quo bias, although our design with three attributes and two alternatives is less likely to suffer from excess task complexity. Consistent choice of the status quo opt-out Option A may indicate strategic protest behaviour (c.f., Carson et al., Reference Carson, Chilton, Hutchinson and Scarpa2020; Mariel et al., Reference Mariel, Hoyos, Meyerhoff, Czajkowski, Dekker, Glenk, Jacobsen, Liebe, Olsen, Sagebiel and Thiene2021).
A limitation of our survey was not recovering further information on whether the status quo choices were explicit protest votes through debriefing or open-ended questions to those serially choosing the status quo (von Haefen et al., Reference von Haefen, Massey and Adamowicz2005). However, Brouwer and Martín-Ortega (Reference Brouwer and Martín-Ortega2012) debated whether excluding protest votes biased WTP estimates. Future study may elucidate how protest voting is influenced by factors including pre-existing confidence in experts (c.f., Rakotonarivo et al., Reference Rakotonarivo, Schaafsma and Hockley2016). It may be that respondents who did not have confidence in expert-provided information were more likely to strategically protest against the proposed restriction, not believing it necessary (c.f., Meyerhoff and Liebe, Reference Meyerhoff and Liebe2009; Czajkowski et al., Reference Czajkowski, Hanley and LaRiviere2016). Indeed, the proportion of respondents who always chose option B increased with higher levels of confidence, indicating that respondents who were more highly confident in the information from experts that microplastics may later cause a health risk were more likely to choose a reformulated cosmetic. This finding highlights the potential for low public trust in experts to limit the support for precautionary policies, even when scientific evidence may support such measures. However, this also indicates that improving public trust in experts could lead to more informed choices and involvement in policy making (c.f., Salanié and Treich, Reference Salanié and Treich2009).
We found that both the most and least confident respondents reported that they were highly certain of their choices. The most confident respondents may be highly certain about their choices because they were consistent with expert-provided information in the survey. Conversely, respondents with low confidence in experts may have been more certain due to a reinforcement of their existing bias towards the status quo alternatives (Meyerhoff and Liebe, Reference Meyerhoff and Liebe2009), potentially driven by a distrust of expert information. This illustrates that preferences could become entrenched if experts are perceived to be untrustworthy, an important aspect of reactions to the coronavirus pandemic or climate change (Bennett, Reference Brennan, Baghramian and Martini2022; Brennan, Reference Brennan, Baghramian and Martini2022; Mihelj et al., Reference Mihelj, Kondor and Štětka2022) and policy communication (Chen and Cho, Reference Chen and Cho2019).
Our results show that WTP is highly contextual, depending on respondent confidence in the reliability of expert-provided information, familiarity with the attribute being valued (c.f., Hasselström and Håkansson, Reference Hasselström and Håkansson2014) and the size of the change. For our familiar attribute, product performance, respondents had positive WTP to avoid large reductions, regardless of confidence levels in experts. This finding was expected, given the predictable reduction in consumer utility, and suggests that cosmetic manufacturers must be careful when substituting out microplastics to avoid large reductions in product performance. The WTP to avoid reduced product performance, in comparison with preferences for smaller reductions in microplastics released, suggest that for some respondents, environmental concern may not be the primary driver of preferences. Respondents were only willing to pay for medium-sized reductions in microplastics released, while consistently prioritizing product performance, a pattern suggestive of ‘greenwashing’ (e.g., Volschenk et al., Reference Volschenk, Gerber and Santos2022; Kolcava, Reference Kolcava2023). In this case, greenwashing reflects a preference for purchasing products marketed as environmentally friendly, provided there is no associated reduction in performance. This raises policy concerns, as firms may exploit such preferences to promote green-branded products without meaningful reductions in microplastic pollution. Stricter eco-labelling regulations (c.f., Nygaard, Reference Nygaard2023) may be necessary to ensure that greenwashing attempts are also accompanied by meaningfully reduced releases of microplastics.
Importantly, this pattern does not apply to all respondents. Our significant standard deviation estimates, and interaction terms, indicate that preferences were highly heterogeneous, particularly for the microplastics released attribute, where WTP was influenced by pre-existing confidence in experts. Future research could further explore this heterogeneity by incorporating survey questions on greenwashing awareness and motivations or applying latent-class models to identify distinct consumer classes. Qualitative methods, such as respondent interviews, could also provide deeper insight into whether WTP reflects strategic greenwashing behaviour or genuine environmental concern.
Overall, comparing results for our two attributes provides insight into how confidence influenced welfare valuations. Attributes that respondents are already familiar with, such as product performance, were unaffected by pre-existing confidence in experts, whereas unfamiliar attributes, such as microplastics released, were more sensitive to beliefs about experts providing information around them. Our results are thus consistent with Jacobsen et al. (Reference Jacobsen, Boiesen, Thorsen and Strange2008) who found that WTP was affected by whether a species was familiar or not, and Hasselström and Håkansson (Reference Hasselström and Håkansson2014) who found that WTP was unaffected by information only for attributes respondents were familiar with. When respondents are more confident in the reliability of experts, they are willing to pay for reductions in microplastics released, suggesting that expert credibility plays a key role in shaping SP for uncertain environmental attributes. Future work to investigate whether confidence in the reliability of experts in general affects how respondents attend to or protest such attributes may provide further insight. Although mean differences in WTP are slight, the aggregate effect of lower confidence in experts could meaningfully influence cost–benefit ratios.
For robustness, we controlled for potential differences in confounders of confidence in experts using the entropy balancing framework, following Hynes et al. (Reference Hynes, Armstrong, Xuan, Ankamah-Yeboah, Simpson, Tinch and Ressurreição2021a). By controlling for potential differences in determinants of confidence in experts, we were able to ensure that our findings were not driven by confounding factors, thereby increasing the robustness of our results.
Despite this robustness, there are three limitations to the survey instrument. Firstly, while the CE method is appropriate for this ex-ante valuation, the context of consumer decisions for cosmetics is suitable for follow-up work with a revealed preference measure. However, eliciting truthful comments on confidence in experts may be easier within the anonymous online survey context. Secondly, we found that the distribution of confidence in experts across the five levels was more right-skewed, notably among those who were highly certain in their choices. In practical terms, this suggests that future work with a continuous sliding scale may improve the precision of our measures. Future open-ended qualitative questions to better understand how respondents processed this question may also be a valuable validity check. A third limitation is that our cross-sectional data was collected during the height of the Coronavirus pandemic restrictions, which could not be avoided given the time constraints and uncertainty over the pandemic duration, but unavoidably altered public perceptions and confidence in experts (Mihelj et al., Reference Mihelj, Kondor and Štětka2022). Future work, not just to repeat the sample post-pandemic, but to dynamically explore how confidence shifts temporally, may provide valuable insights.
5. Conclusion
Our work illustrated the effect that low public trust in experts and science can have on survey behaviour designed to measure public preferences and the potentially detrimental effect on support for precautionary policies, even in unrelated contexts. This highlights the urgency of addressing and improving public confidence in experts.
Supplementary material
The supplementary material for this article can be found at https://doi.org/10.1017/S1355770X25100077
Competing interests
The author declares none.
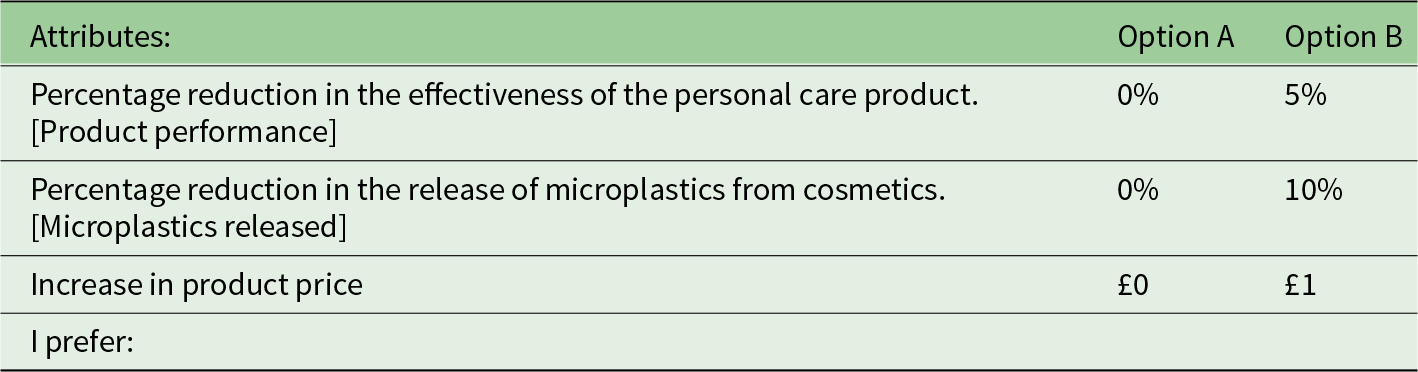
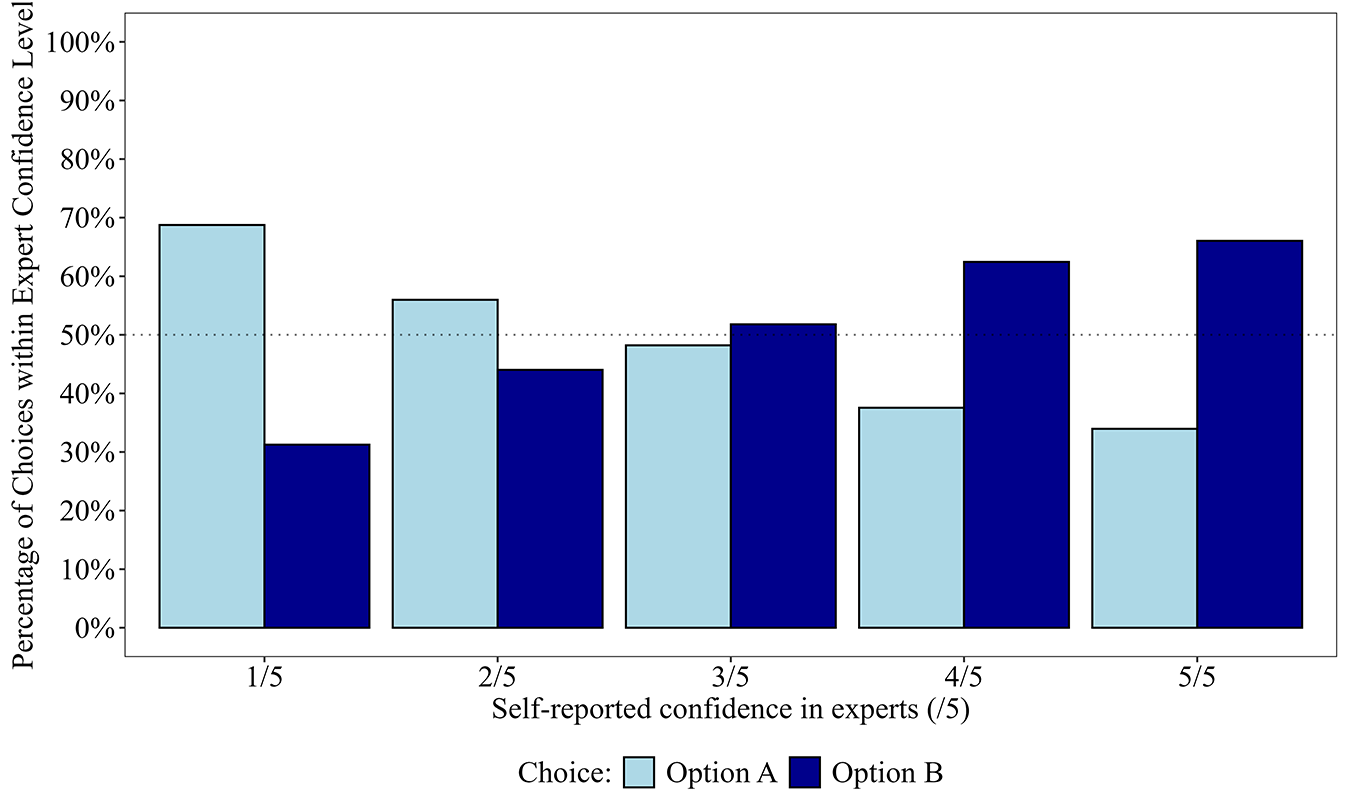
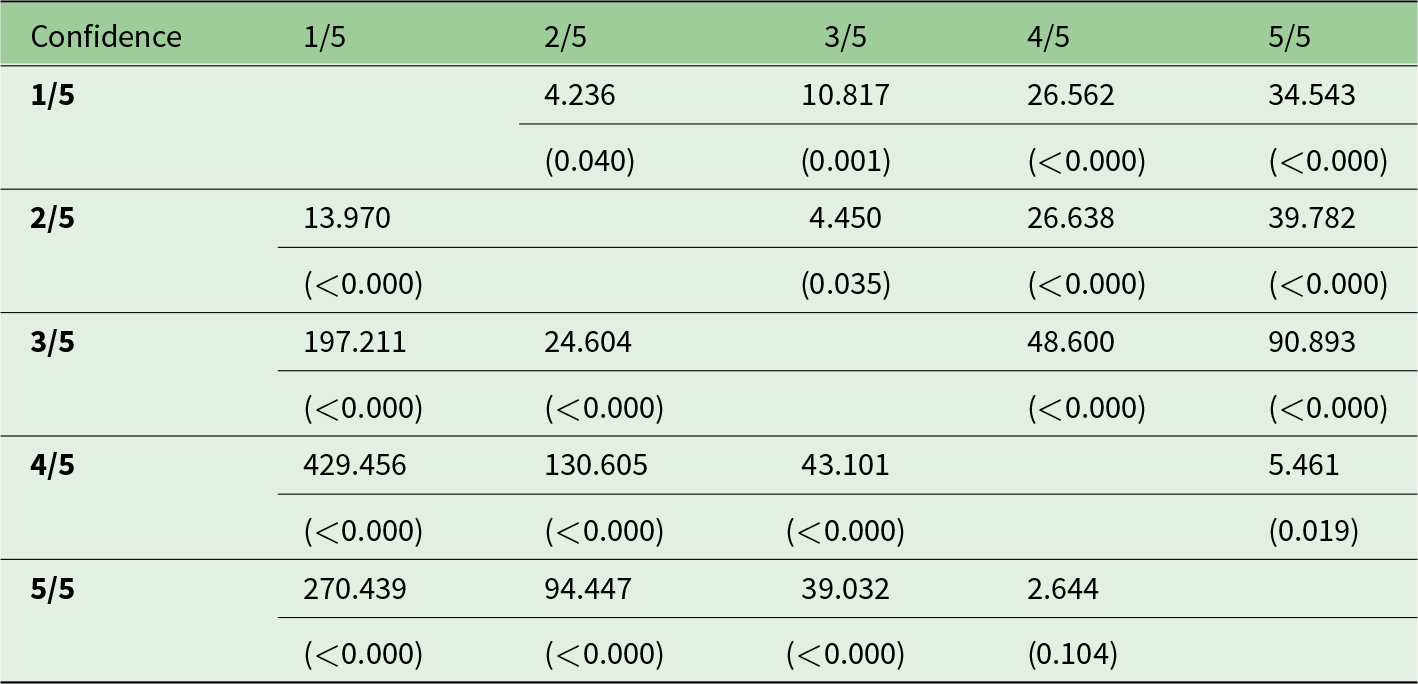

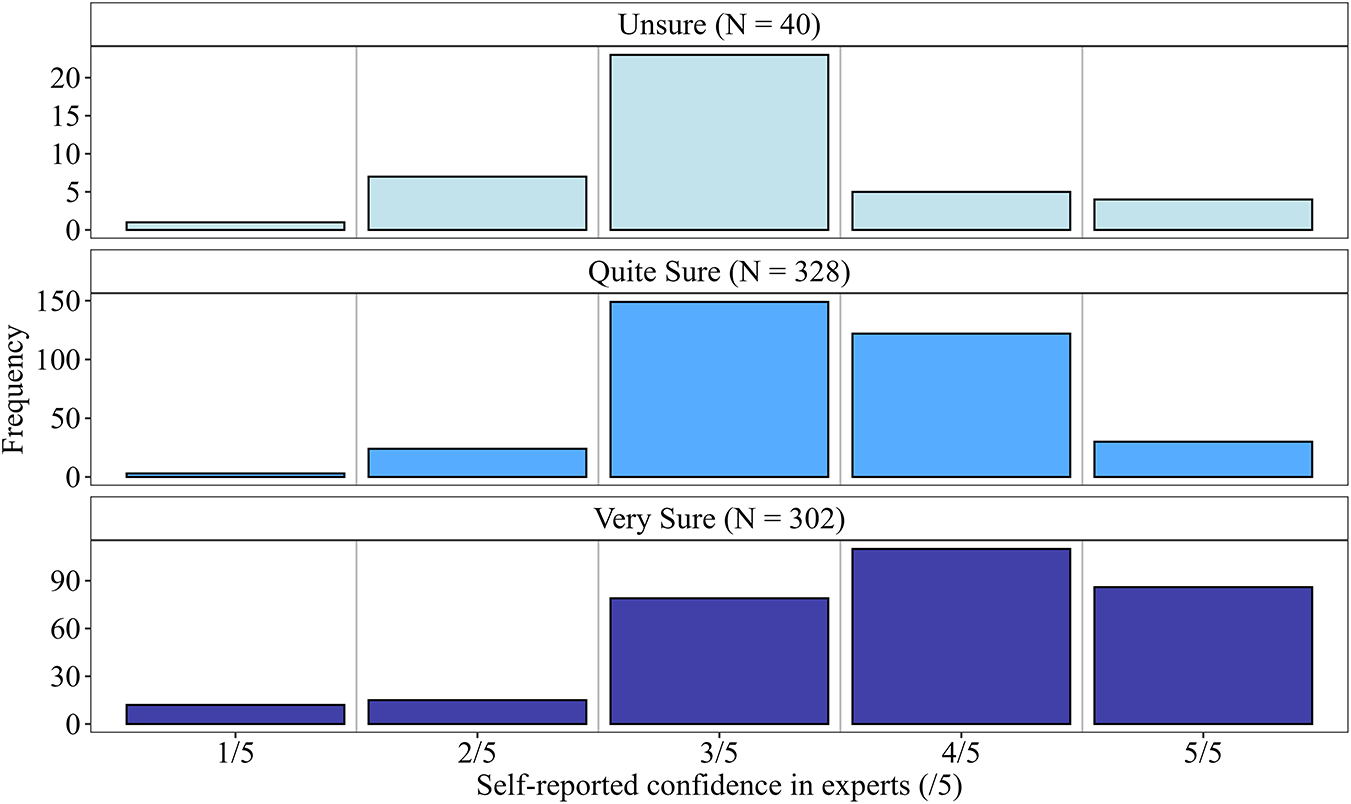
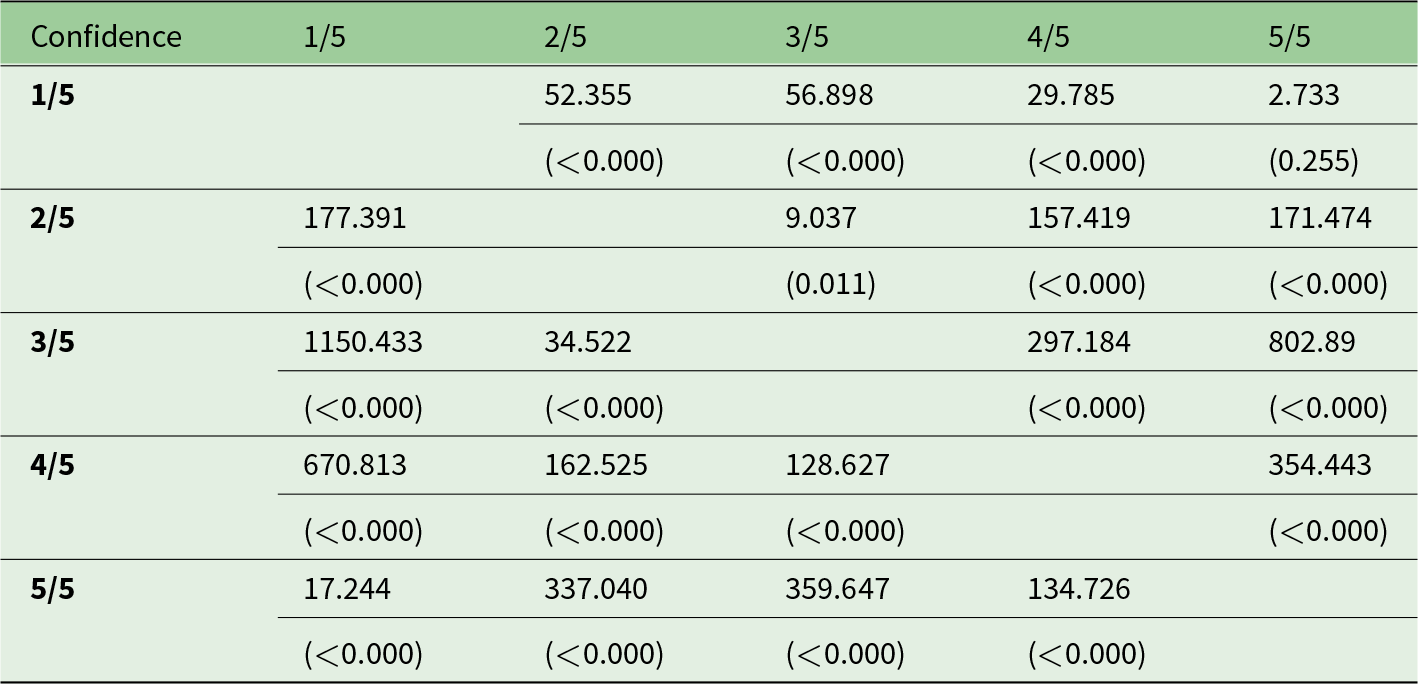

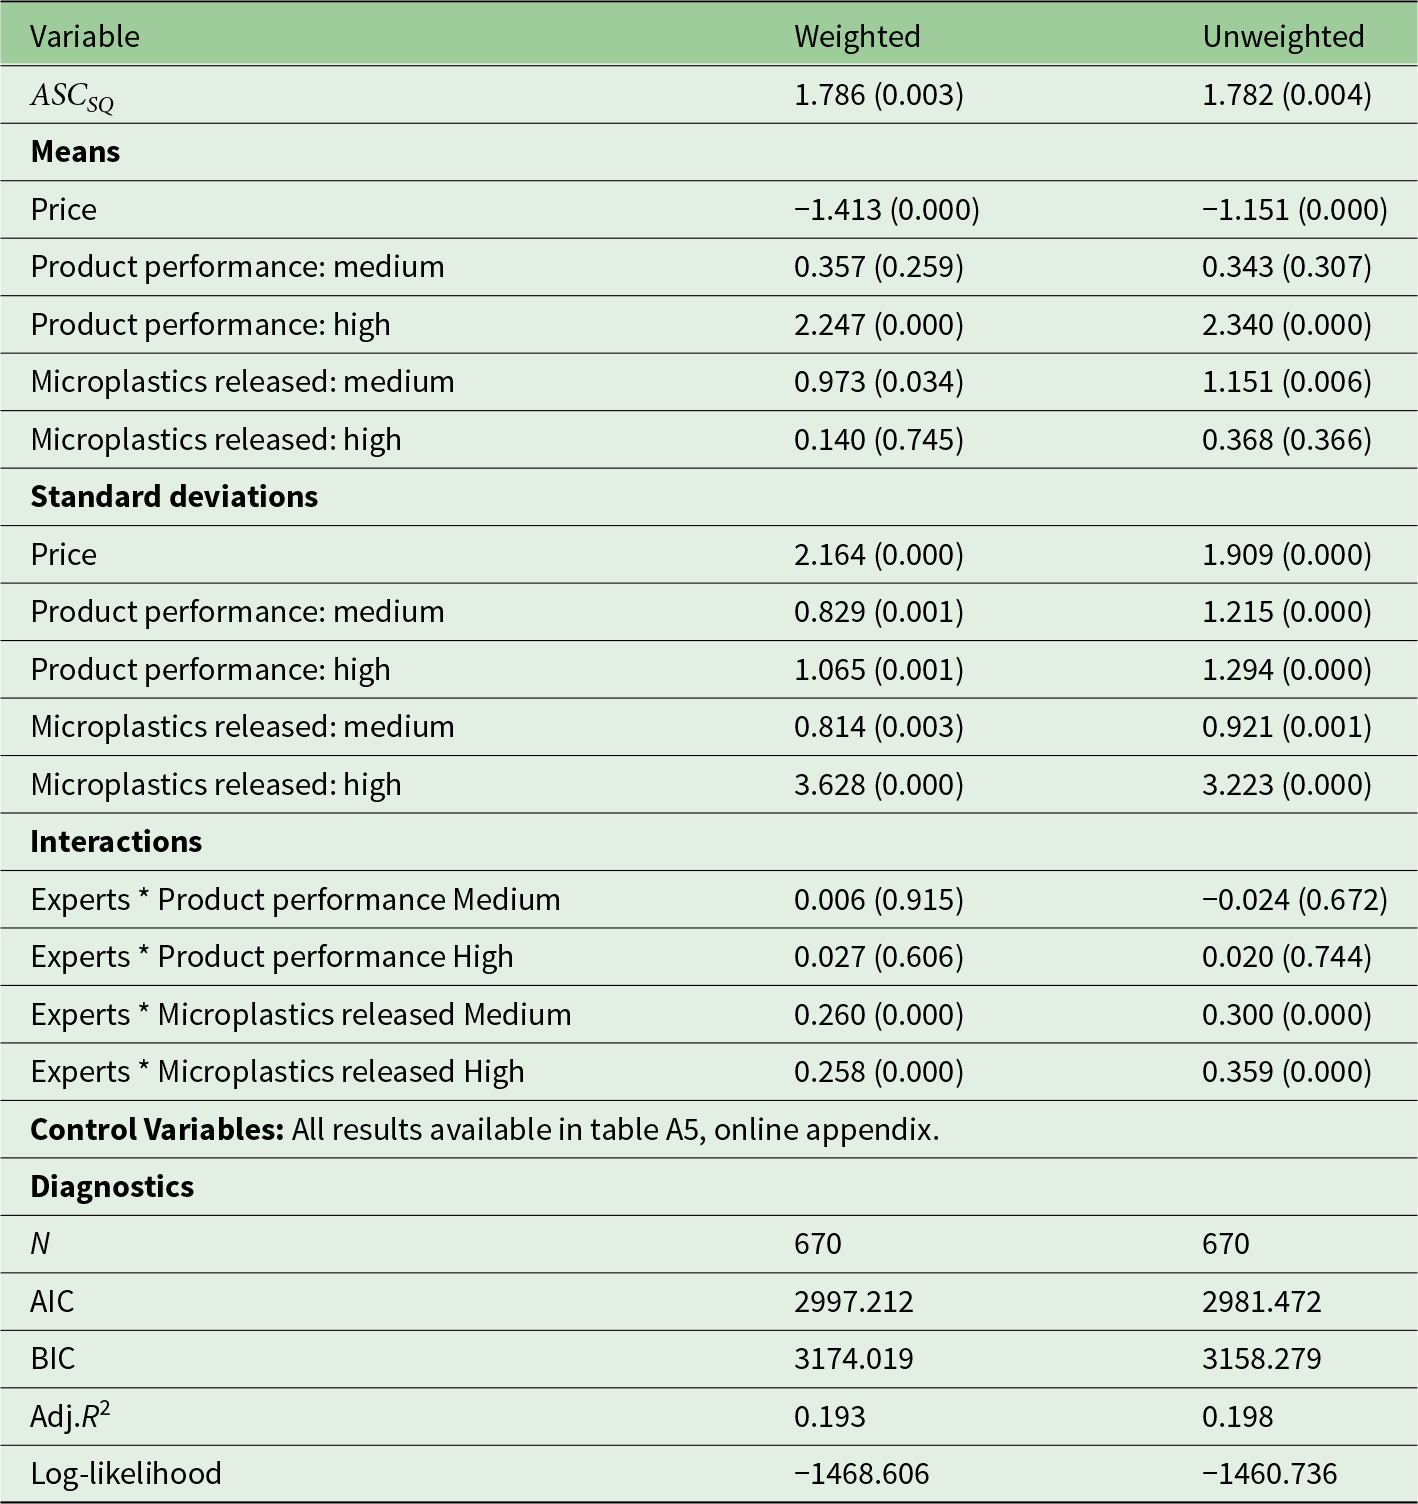
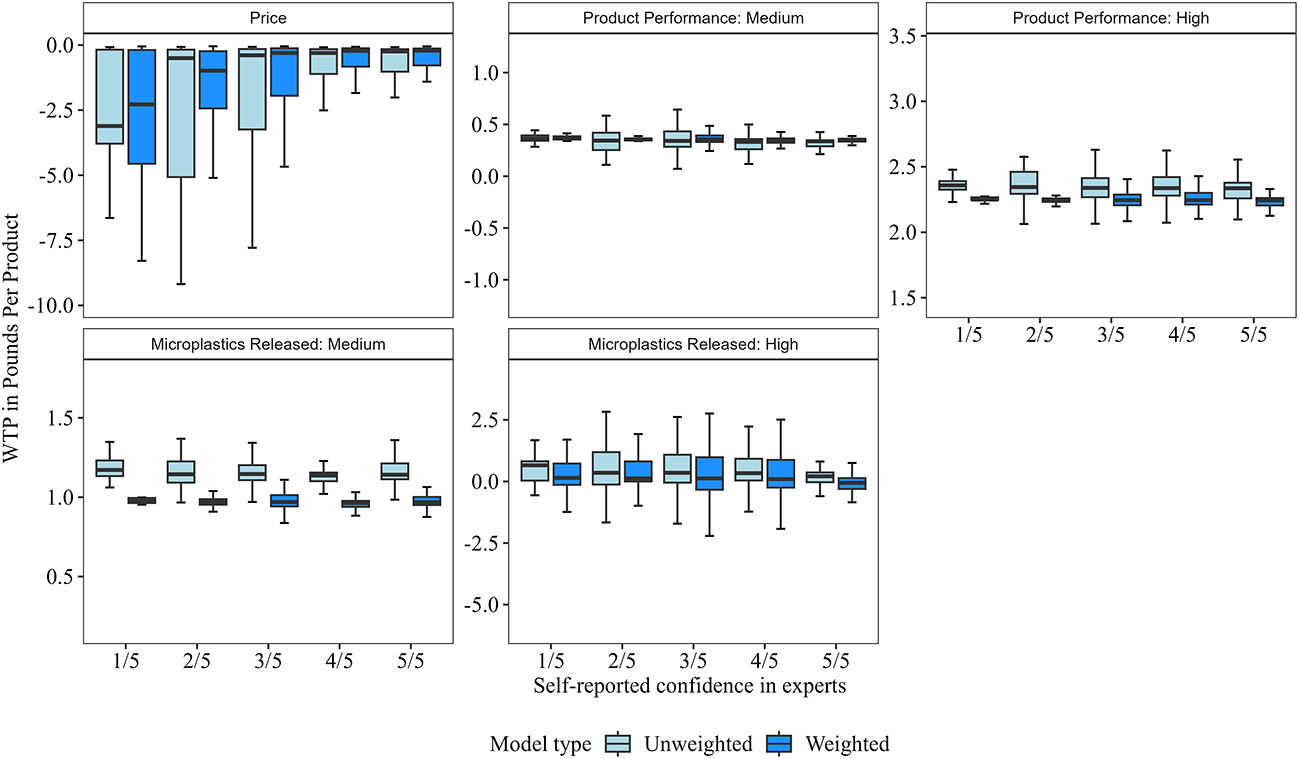


 Open access