





Protein ingestion increases muscle protein synthesis rates(Reference Gorissen, Remond and van Loon1,Reference Groen, Horstman and Hamer2) . The increase in muscle protein synthesis rate is believed to be driven by the post-prandial increase in plasma essential amino acid (EAA) concentrations(Reference Volpi, Kobayashi and Sheffield-Moore3), with the rise in plasma leucine concentration being of particular relevance(Reference Wilkinson, Hossain and Hill4–Reference Wall, Hamer and de Lange8). The anabolic properties of different types of protein seem to be largely determined by their EAA content, amino acid (AA) profile, as well as their protein digestion and AA absorption kinetics(Reference Tang and Phillips9–Reference Koopman, Walrand and Beelen11). As a result, post-prandial muscle protein synthesis rates may differ substantially following ingestion of the same amount of protein derived from different protein sources(Reference Burd, Yang and Moore12–Reference Tang, Moore and Kujbida14).
The various dietary protein sources can be classified as animal- or plant-derived proteins. Plant-based proteins are suggested to provide a lesser anabolic stimulus due to their lower digestibility and incomplete AA profile with typically low levels of leucine, lysine and/or methionine(Reference van Vliet, Burd and van Loon15,Reference Gorissen and Witard16) . However, plant-derived proteins comprise a large part of our daily protein intake(17) and will become more important with respect to future global protein needs and more sustainable protein production, as plant-based protein sources require less water, land and energy resources when compared with the production of animal-based proteins(Reference van Vliet, Burd and van Loon15,Reference Pimentel and Pimentel18) . So far, few studies have assessed the muscle protein synthetic response to the ingestion of plant-derived proteins in vivo in humans(Reference Tang, Moore and Kujbida14,Reference Wilkinson, Tarnopolsky and Macdonald19–Reference Churchward-Venne, Pinckaers and Smeets21) . Ingestion of soya protein has been shown to result in lower(Reference Wilkinson, Tarnopolsky and Macdonald19,Reference Yang, Churchward-Venne and Burd20) or similar(Reference Tang, Moore and Kujbida14,Reference Churchward-Venne, Pinckaers and Smeets21) post-prandial muscle protein synthesis rates when compared with the ingestion of dairy protein. More plant-derived proteins should be investigated for their properties to stimulate muscle protein synthesis rates.
Wheat protein is the most abundant plant-based protein source(17). Wheat protein contains an insufficient amount of EAA according to the WHO/FAO/UNU AA requirements(22) and a lower amount of leucine when compared with animal proteins(Reference Gorissen, Crombag and Senden23). Theoretically, this should compromise its capacity to stimulate post-prandial muscle protein synthesis rates. Recently, Gorissen et al. (Reference Gorissen, Horstman and Franssen24) reported a lower muscle protein synthetic response following ingestion of 35 g of wheat protein when compared with 35 g of casein in older males. However, the lesser muscle protein synthetic response could be compensated for by ingesting nearly double the amount of wheat protein. Of course, simply increasing the amount of protein intake is not always practical. Therefore, other strategies such as the fortification of plant-derived proteins with their limiting AA have been suggested as a means to improve the overall quality of plant-derived proteins(Reference van Vliet, Burd and van Loon15). Alternatively, blends of different protein sources may provide a more practical and feasible strategy to improve overall protein quality(Reference Young and Pellett25), thereby increasing the anabolic response to protein feeding(Reference Reidy, Walker and Dickinson26). Since more than half of the worldwide protein consumption originates from plants(17), blends of both plant- and animal-derived proteins may represent an effective and practical strategy to improve the overall quality of the ingested protein, while reducing the amount of animal-derived protein in our diet.
We hypothesise that the ingestion of 30 g milk protein results in higher post-prandial muscle protein synthesis rates when compared with the ingestion of the same amount of wheat protein. However, when wheat and milk protein are combined in a 1/1 ratio, we expect these differences to not be present. To test these hypotheses, we included 36 healthy, young males to participate in a study in which we compared the impact of ingesting 30 g milk protein with the ingestion of 30 g wheat protein or a protein blend combining 15 g wheat plus 15 g milk protein on post-prandial muscle protein synthesis rates in vivo in humans.
Subjects and methods
Participants
Thirty-six healthy males (23 (sd 3) years; 1·79 (sd 0·06) m; 71·5 (sd 8·3) kg) volunteered to participate in this parallel-group, double-blind, randomised controlled trial (participants’ characteristics are presented in Table 1). Participants were recreationally active and generally performed between 2 and 4 exercise sessions per week in various sports (e.g. soccer, basketball, weight lifting, running, cycling, etc.) but were not involved in any structured progressive exercise training regimen. The present study was part of a larger trial registered at the Netherlands Trial Register (NTR6548, https://www.trialregister.nl/trial/6364) and was conducted between June 2017 and April 2019 at Maastricht University in Maastricht, the Netherlands (see supplementary material, Supplemental Figure 1 for the CONSORT (Consolidated Standards of Reporting Trials) flow diagram). All participants were informed about the purpose of the study, the experimental procedures and possible risks before providing informed written consent to participate. The procedures followed were in accordance with the ethical standards of the medical ethics committee of Maastricht University Medical Centre + (METC 173001), and in accordance with the Helsinki Declaration of 1975 as revised in October 2013. The study was independently monitored and audited by the Clinical Trial Centre Maastricht.
Participants’ characteristics

Values represent mean and standard deviation. n = 12 per nutritional intervention group. MILK: 30 g of milk protein, WHEAT+MILK: 15 g of wheat protein plus 15 g of milk protein, WHEAT: 30 g of wheat protein. Independent-samples t test for MILK v. WHEAT and MILK v. WHEAT+MILK all P > 0·05.
Preliminary testing
Participants aged 18–35 years with BMI > 18·5 and < 27·5 kg·m−2 underwent an initial screening session to assess eligibility. Height, weight, blood pressure and body composition (by dual-energy X-ray absorptiometry; Discovery A, Hologic; (National Health and Nutrition Examination Survey – Body Composition Analysis (NHANES BCA) enabled) were determined. Participants were deemed healthy based on their responses to a medical questionnaire. The screening sessions and experimental trials were separated by at least 3 d.
Study design
Participants were randomly assigned to ingest a 400 ml beverage containing either 30 g milk protein concentrate (MILK), 30 g wheat protein hydrolysate (WHEAT), or 15 g wheat protein hydrolysate plus 15 g milk protein concentrate (WHEAT+MILK). After beverage ingestion, the bottle was rinsed with 150 ml of water, which was also ingested by the participants. Milk protein concentrate (Refit MPC80) was obtained from FrieslandCampina and wheat protein hydrolysate (Meripro 500) was supplied by Tereos Syral. Participants were allocated to a treatment according to a block randomisation list (blocks of 7) performed using a computerised randomiser (http://www.randomization.com/). An independent researcher was responsible for random assignment (n = 12 per group) and preparation of the study treatment beverages, which were sequentially numbered according to subject number. The beverages were prepared in non-transparent protein-shakers.
Diet and physical activity
Participants refrained from sports and strenuous physical activities (e.g. lifting heavy weights), and alcohol consumption for 3 d prior to the experimental trial. In addition, all participants were instructed to complete a food and activity record for 3 d prior to the experimental trial (see online supplementary material, Supplemental Table S1 for an overview of participants’ habitual food intake in the 3 d prior to the experimental trial). The evening before the trial, all participants consumed a standardised meal containing 2·8 MJ of energy, with 65 % energy provided as carbohydrate, 20 % as fat and 15 % as protein, before 22.00 after which they remained fasted.
Experimental protocol
At about 07.30, participants arrived at the laboratory in an overnight post-absorptive state. A cannula was inserted into an antecubital vein for stable isotope AA infusion. A second cannula was inserted retrogradely into a dorsal hand vein on the contralateral arm for arterialised blood sampling. To obtain arterialised blood samples, the hand was placed in a hot box (60 °C) for 10 min prior to blood sample collection.
After taking a baseline blood sample (t = –180 min), the plasma phenylalanine pool was primed with a single dose of L-[ring-13C6]-phenylalanine (2·25 µmol·kg−1). Thereafter, a continuous intravenous infusion of L-[ring-13C6]-phenylalanine (0·05 µmol·kg−1·min−1) was initiated (t = –180 min) using a calibrated IVAC 598 pump. Subsequently, arterialised blood samples were collected at t = –90, –60 and –30 min. At t = 0 min, an arterialised blood sample was obtained as well as a muscle biopsy from the M. vastus lateralis. Immediately following the muscle biopsy, participants ingested a 400 ml beverage corresponding to their randomised treatment allocation, that is, MILK (n = 12), WHEAT (n = 12), or WHEAT+MILK (n = 12). To minimise dilution of the steady-state plasma L-[ring-13C6]-phenylalanine precursor pool, the phenylalanine content of each protein drink was enriched with 3·85 % free, crystalline L-[ring-13C6]-phenylalanine(Reference Churchward-Venne, Pinckaers and Smeets21,Reference Churchward-Venne, Pinckaers and Smeets27) . Arterialised blood samples were then collected at t = 15, 30, 45, 60, 90, 120, 150, 180, 210, 240 and 300 min after protein ingestion in the post-prandial period. Blood samples were collected into EDTA-containing tubes and centrifuged at 1200 g for 10 min at 4 °C. Aliquots of plasma were frozen in liquid nitrogen and stored at –80 °C. The second and third muscle biopsy from the M. vastus lateralis were collected at t = 120 and t = 300 min to determine post-prandial skeletal muscle protein synthesis rates over the 0–120, 120–300 and 0–300 min post-prandial period. Muscle biopsy collection was alternated between legs and obtained with the use of a 5-mm Bergström needle(Reference Bergstrom28), custom-adapted for manual suction. Samples were obtained from separate incisions from the middle region of the M. vastus lateralis, about 15 cm above the patella and about 3 cm below entry through the fascia. Local anesthetic (1 % Xylocaine with adrenaline 1:100 000) was applied to numb the skin and fascia. Muscle samples were freed from any visible non-muscle material, immediately frozen in liquid nitrogen, and stored at –80 °C until further processing. When the experimental protocol was complete, cannulae were removed and participants were provided with food and monitored for about 30 min before leaving the laboratory. For a schematic representation of the infusion protocol, see Fig. 1.
Schematic representation of the experimental design.

Protein powder analysis
Batch-specific N contents of both milk protein concentrate and wheat protein hydrolysate were provided by the manufacturer. The protein content of the milk protein was determined as N content × 6·38, and the protein content of wheat protein powder was determined as N content × 5·7(Reference Jones29,Reference Mariotti, Tome and Mirand30) . AA contents of the protein powders were determined by acid hydrolysis in triplicate. Specifically, the AA were liberated from the protein powders (about 4 mg) by adding 2 ml of 6M HCl and heating to 110 °C for 12 h. The hydrolysed free AA were subsequently dried under a N stream while heated to 120 °C. Before analysis using ultra-performance liquid chromatography (UPLC)-MS (ACQUITY UPLC H-Class with QDa; Waters), the hydrolysate was dissolved in 5 ml of 0·1 M HCl and 20 µl of AccQ/Tag derivatising reagent solution (Waters) was added as described below for the plasma AA concentration analysis. The AA composition of the protein powders and the protein blend are presented in Table 2.
Protein drink amino acid composition

Values for amino acid contents are in grams per 30 g of protein. MILK: 30 g of milk protein, WHEAT+MILK: 15 g of wheat protein plus 15 g of milk protein, WHEAT: 30 g of wheat protein.
TAA, total amino acid; EAA, essential amino acid; BCAA, branched chain amino acid
* Values are obtained by averaging the measured values for wheat and milk protein.
† Protein as N content × 6·38.
‡ Protein as N content × 5·7.
Plasma analysis
Plasma glucose and insulin concentrations were analysed using commercially available kits (GLUC3, Roche, Ref: 05168791190, and immunologic, Roche, Ref: 12017547122, respectively). Plasma AA concentrations were determined by UPLC-MS. Specifically, 50 µl of blood plasma was deproteinised using 100 µl of 10 % SSA with 50 µM of MSK-A2 internal standard (Cambridge Isotope Laboratories). Subsequently, 50 µl of ultra-pure demineralised water was added and samples were centrifuged. After centrifugation, 10 µl of supernatant was added to 70 µl of Borate reaction buffer (Waters). In addition, 20 µl of AccQ/Tag derivatising reagent solution (Waters) was added after which the solution was heated to 55 °C for 10 min. Of this 100-µl derivative, 1 µl was injected and measured using UPLC-MS.
Plasma L-[ring-13C6]-phenylalanine enrichments were determined by GC-MS (Agilent 7890A GC/5975C MSD; Agilent Technologies). Specifically, the plasma was deproteinised on ice with dry 5-sulfosalicyclic acid. Free AA were purified using cation exchange resin columns (AG 50W-X8, mesh size: 100–200, ionic form: hydrogen (Bio-Rad Laboratories)). The free AA were converted to their tert-butyl dimethylsilyl derivative before analysis by GC-MS using selected ion monitoring of masses 336 and 342 for unlabelled and [ring-13C6]-labelled phenylalanine, respectively. Standard regression curves were applied from a series of known standard enrichment values against the measured values to assess the linearity of the mass spectrometer and to account for any isotope fractionation which may have occurred during the analysis.
Basal muscle protein synthesis rates were assessed to confirm that protein ingestion increases muscle protein synthesis rates. The single biopsy approach was applied to assess post-absorptive muscle protein synthesis rates without the need to collect an additional muscle biopsy(Reference Burd, Pennings and Groen31). In short, plasma protein obtained prior to tracer infusion (t = –180 min) was used to determine background L-[ring-13C6]-phenylalanine enrichments. For this purpose, the plasma sample was precipitated by adding perchloric acid. Subsequently, similarly as for the myofibrillar protein fraction, the denaturised plasma protein pellet was hydrolysed, passed over a cation exchange resin column (AG 50W-X8, mesh size: 100–200, ionic form: hydrogen (Bio-Rad Laboratories)), and the resulting AA samples were derivatised to their N(O,S)-ethoxycarbonyl-ethylesters before being measured by GC-combustion-isotope ratio mass spectrometry (GC-C-IRMS; Mat 253, Thermo Scientific) using a DB5MS (30 m) column (Agilent technologies), as explained below.
Muscle analysis
A piece of wet muscle (about 50–70 mg) was homogenised on ice using a Teflon pestle in ice-cold homogenisation buffer (7 µl/mg; 67 mM sucrose, 50 mM TRIS/HCl, 50 mM KCl, 10 mM EDTA) containing Complete Mini protease inhibitor cocktail and PhosSTOP (Roche Applied Science). After about 3 min of hand homogenisation, the homogenate was centrifuged at 2200 g for 5 min at 4 °C to precipitate the myofibrillar proteins. The protein pellet was washed once with MilliQ water and centrifuged at 250 g for 10 min at 4 °C. The myofibrillar proteins were solubilised by adding 1 ml of 0·3 M NaOH and heating to 50 °C for 30 min with vortex mixing every 10 min. Samples were centrifuged at 11 000 g for 5 min at 4 °C and the supernatant containing the myofibrillar protein-enriched fraction was collected. The collagen pellets were washed once with 0·3 M NaOH and centrifuged at 11 000 g for 5 min at 4 °C. The resulting supernatant was added to the already collected myofibrillar protein-enriched fraction and the collagen pellets were discarded. Myofibrillar proteins were precipitated by the addition of 1 ml of 1 M perchloric acid and centrifuged at 800 g for 10 min at 4 °C. The myofibrillar protein-enriched fraction was washed twice with 70 % ethanol and centrifuged at 450 g . The AA were liberated from the myofibrillar protein-enriched fraction by adding 2 ml of 6 M HCl and heating to 110 °C for 16 h. The hydrolysed myofibrillar protein fractions were dried under a N stream while heated to 120 °C. The dried myofibrillar protein fraction was dissolved in a 50 % acetic acid solution. The AA from the myofibrillar protein fraction were passed over a cation exchange resin column (AG 50W-X8, mesh size: 100–200, ionic form: hydrogen (Bio-Rad Laboratories). Subsequently, the purified AA solution was dried under a N stream at room temperature, followed by derivatization to their N(O,S)-ethoxycarbonyl-ethylesters. The ratio of 13C/12C of myofibrillar protein-bound phenylalanine was determined using GC-C-IRMS by monitoring ion masses 44, 45 and 46. Standard regression curves were applied from a series of known standard enrichment values against the measured values to assess the linearity of the mass spectrometer and to account for any isotope fractionation which may have occurred during the analysis.
Muscle intra-cellular enrichments were determined from a separate piece of muscle. Specifically, a piece of wet muscle (about 50–70 mg) was freeze-dried for 48 h. Collagen, excessive blood and other non-muscle materials were subsequently removed from the muscle fibres under a light microscope. The isolated muscle fibre mass was weighed and 35 volumes (7× wet weight of isolated muscle fibres × wet-to-dry ratio 5:1) of ice-cold 2 % perchloric acid was added. Thereafter, the tissue was homogenised by sonification and centrifuged to separate the supernatant from the protein. The supernatants containing the muscle intra-cellular free AA were purified, and derivatised before analysis by GC-MS, similarly as for the plasma L-[ring 13C6]-phenylalanine enrichments.
Calculations
Fractional myofibrillar protein synthesis rates (%·h−1) were calculated by the standard precursor-product equation(Reference Schierbeek32):
 $$FSR = \left( {{{({E_{b2}} - {E_{b1}})} \over {({E_{precursor}} \cdot t)}}} \right) \cdot 100$$
where E b is the increment in myofibrillar protein-bound L-[ring-13C6]-phenylalanine enrichment (mole % excess, MPE) during the tracer incorporation period, and t is the tracer incorporation time in hours. Weighted mean plasma L-[ring-13C6]-phenylalanine enrichments were calculated by taking the measured enrichment between consecutive time points and correcting for the time between these sampling time points (E precursor). For calculation of post-prandial fractional synthetic rate (FSR), skeletal muscle biopsy samples at t = 0, 120 and 300 min were used. For the calculation of basal FSR, Eb2 represented the protein-bound L-[ring-13C6]-phenylalanine enrichments in muscle at t = 0 min, and Eb1 represented the protein-bound L-[ring-13C6]-phenylalanine enrichments in plasma protein at t = −180 min.
Net incremental AUC (iAUC) was determined for plasma AA concentrations during the 5-h post-prandial period following protein ingestion. The iAUC was calculated using the trapezoid rule, with plasma concentrations before beverage ingestion (t = 0 min) serving as baseline.
Outcome measures
Myofibrillar FSR over the entire (i.e. 0–300 min) post-prandial period, comparing MILK v. WHEAT and MILK v. WHEAT+MILK was defined as the primary outcome measure. Secondary outcome measures were myofibrillar FSR in the early (i.e. 0–120 min) and late (i.e. 120–300 min) post-prandial period, plasma glucose, insulin, and AA concentrations and plasma AA iAUC, comparing MILK v. WHEAT and MILK v. WHEAT+MILK. Plasma glucose, insulin, and AA peak concentrations and time to peak were tertiary outcomes, comparing MILK v. WHEAT and MILK v. WHEAT+MILK.
Statistical analysis
A power calculation was performed with differences in post-prandial myofibrillar FSR between two treatments as primary outcome measure. A sample size of twelve participants per treatment, including a 10 % dropout rate, was calculated using a power of 80 %, a significance level of 0·05, a standard deviation of 0·0065 %·h−1 and a difference in FSR of 0·008 %·h−1 between treatments (or about 20 % when expressed as a relative difference). Participant characteristics were analysed by independent-samples t test for MILK v. WHEAT and MILK v. WHEAT+MILK. Plasma glucose, insulin, and AA concentrations and AA enrichments were analysed by a two-way (time × treatment) repeated-measures ANOVA for MILK v. WHEAT and MILK v. WHEAT+MILK. Bonferroni post hoc analysis was performed if a significant F ratio was found to isolate specific differences. Plasma glucose, insulin and AA concentrations, expressed as peak values, time to peak and iAUC, were analysed by independent-samples t test for MILK v. WHEAT and MILK v. WHEAT+MILK. Basal post-absorptive and post-prandial myofibrillar protein synthesis rates during the early (0–120 min) and entire (0–300 min) post-prandial period were analysed by independent-samples t test for MILK v. WHEAT and MILK v. WHEAT+MILK. Statistical analyses were performed with a software package (IBM SPSS statistics for Windows, version 26.0, IBM Corp.). Means were considered to be significantly different for P values < 0·05. Data are expressed as means values and standard deviations.
Results
Plasma glucose and insulin concentrations
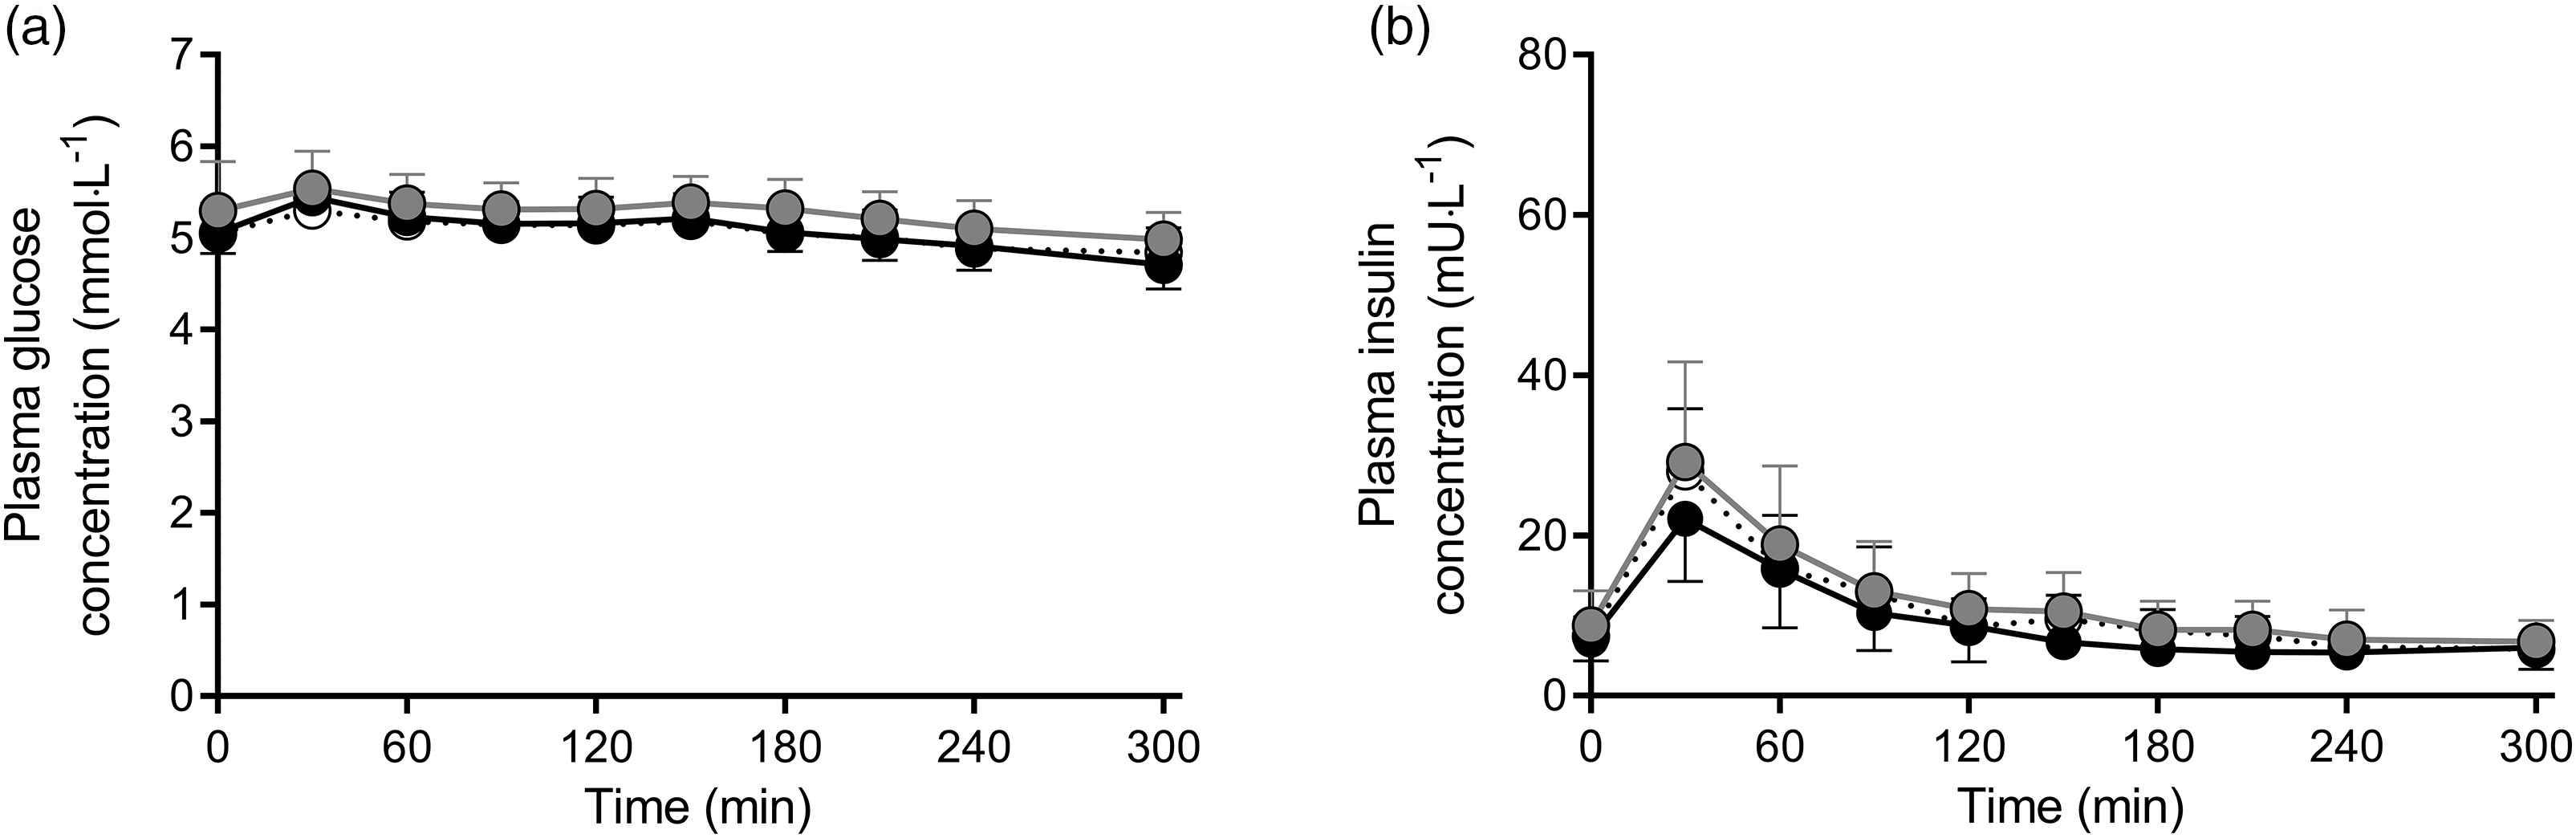
Plasma glucose concentrations did not change following protein ingestion (Fig. 2a) and did not differ between MILK v. WHEAT (time × treatment: P = 0·09) or MILK v. WHEAT+MILK (time × treatment: P = 0·71). Plasma insulin concentrations increased following protein ingestion, with no differences in peak plasma insulin concentrations and iAUC between MILK and WHEAT (P = 0·79 and P = 0·12, respectively) or between MILK and WHEAT+MILK (P = 0·08 and P = 0·77, respectively; Fig. 2b).
Post-prandial plasma glucose (Panel a) and insulin (Panel b) concentrations during the 300 min period following the ingestion of MILK v. WHEAT and MILK v. WHEAT+MILK in healthy, young males (n = 12 per group). Time 0 min represents time of beverage intake. MILK: 30 g milk protein, WHEAT: 30 g wheat protein, WHEAT+MILK: 15 g wheat protein + 15 g milk protein. Values represent mean values and standard deviation; repeated-measures ANOVA with time as within-subjects variable and interventional drink (treatment) as between-subjects variable. Time × treatment: Panel (a): MILK v. WHEAT P = 0·09, MILK v. WHEAT+MILK P = 0·71; Panel (b): MILK v. WHEAT P = 0·12, MILK v. WHEAT+MILK P = 0·97. MILK;
MILK; WHEAT+MILK;
 WHEAT.
Plasma amino acid concentrations
Plasma EAA concentrations increased following protein ingestion over time for all treatments (Fig. 3a). This increase was greater for MILK v. WHEAT (time × treatment: P < 0·001) but did not differ between MILK and WHEAT+MILK (time × treatment: P = 0·06). MILK ingestion resulted in higher peak EAA concentrations v. WHEAT (1871 (sd 124) v. 1449 (sd 144) µmol L−1; P < 0·001) and v. WHEAT+MILK (1871 (sd 124) v. 1611 (sd 160) µmol L−1; P < 0·001). These peak EAA concentrations were reached faster following MILK v. WHEAT (36 (sd 10) v. 63 (sd 18) min; P < 0·001) but were not different in MILK v. WHEAT+MILK (36 (sd 10) v. 43 (sd 19) min; P = 0·26). The overall increase in plasma EAA concentrations over the entire 300 min post-prandial period, expressed as iAUC, was 110 % greater for MILK v. WHEAT (151 (sd 31) v. 72 (sd 9) mmol·300·min·L−1; P < 0·001) and 58 % greater for MILK v. WHEAT+MILK (151 (sd 31) v. 96 (sd31) mmol·300·min·L−1; P < 0·001; Fig. 3b).
Post-prandial plasma essential amino acid (EAA, Panel a), leucine (Panel c), lysine (Panel e) and methionine (Panel g) concentrations during the 300 min period following the ingestion of MILKv. WHEAT and MILK v. WHEAT+MILK in healthy, young males (n = 12 per group). Time 0 min represents time of beverage intake. Panels b, d, f and h represent the 0–5 h net incremental AUC (iAUC) following protein ingestion. MILK: 30 g milk protein, WHEAT: 30 g wheat protein, WHEAT+MILK: 15 g wheat protein + 15 g milk protein. Values represent means values and standard deviation; * significantly different for MILK v. WHEAT (P < 0·05), # significantly different for MILK v. WHEAT+MILK (P < 0·05). Repeated-measures ANOVA with time as within-subject variable and interventional drink (treatment) as between-subject variable. Time × treatment: Panel (a): MILK v. WHEAT P < 0·001, MILK v. WHEAT+MILK P = 0·06, Panel (c): MILK v. WHEAT P = 0·001, MILK v. WHEAT+MILK P = 0·09, Panel (e): MILK v. WHEAT P < 0·001, MILK v. WHEAT+MILK P < 0·001, Panel (g): MILK v. WHEAT P < 0·001, MILK v. WHEAT+MILK P < 0·01.MILK;WHEAT+MILK;WHEAT.

Plasma leucine concentrations increased over time for all treatments following protein ingestion (Fig. 3c). This increase was greater for MILK v. WHEAT (time × treatment: P < 0·001) but did not differ between MILK and WHEAT+MILK (time × treatment: P = 0·09). MILK ingestion resulted in higher peak leucine concentrations v. WHEAT (353 (sd 45) v. 280 (sd 37) µmol L−1; P < 0·001) and v. WHEAT+MILK (353 (sd 45) v. 301 (sd 44) µmol L−1; P = 0·01). Time to reach these peak concentrations did not differ between interventions (MILK v. WHEAT: 46 (sd 43) v. 58 (sd 19) min; P = 0·42 and MILK v. WHEAT+MILK: 46 (sd 43) v. 64 (sd 51) min; P = 0·31). The overall increase in plasma leucine concentrations over the entire 300 min post-prandial period, expressed as iAUC, was 61 % greater for MILK v. WHEAT (36 (sd 7) v. 22 (sd 3) mmol·300 min·L−1; P < 0·001), and 45 % greater for MILK v. WHEAT+MILK (36 (sd 7) v. 25 (sd 9) mmol·300 min·L−1; P < 0·01; Fig. 3d).
Plasma lysine concentrations increased over time for MILK and WHEAT+MILK, but not for WHEAT (Fig. 3e). This increase was greater for MILK v. WHEAT (time × treatment: P < 0·001), as well as for MILK v. WHEAT+MILK (time × treatment: P < 0·001). MILK ingestion resulted in higher peak lysine concentrations v. WHEAT (370 (sd 29) v. 186 (sd 20) µmol L−1; P < 0·001) and v. WHEAT+MILK (370 (sd 29) v. 268 (sd 32) µmol L−1; P < 0·001). Time to reach these peak concentrations did not differ between interventions (MILK v. WHEAT: 34 (sd 7) v. 41 (sd 11) min; P = 0·06 and MILK v. WHEAT+MILK: 34 (sd 7) v. 41 (sd 26) min; P = 0·31). The overall increase in plasma lysine concentrations over the entire 300 min post-prandial period, expressed as iAUC, was much greater for MILK v. WHEAT (25 (sd 8) v. –3 (sd 3) mmol·300 min·L−1; P < 0·001) and 183 % greater for MILK v. WHEAT+MILK (25 (sd 8) v. 9 (sd 5) mmol·300 min·L−1; P < 0·001; Fig. 3f).
Plasma methionine concentrations increased over time for all treatments following protein ingestion (Fig. 3g). This increase was greater for MILK v. WHEAT (time × treatment: P < 0·001), as well as for MILK v. WHEAT+MILK (time × treatment: P = 0·002). MILK ingestion resulted in higher peak methionine concentrations v. WHEAT (60 (sd 5) v. 35 (sd 5) µmol L−1; P < 0·001) and v. WHEAT+MILK (60 (sd 5) v. 46 (sd 7) µmol L−1; P < 0·001). These peak methionine concentrations were reached faster following MILK ingestion v. WHEAT (34 (sd 9) v. 73 (sd 24) min; P < 0·001) but were not different v. WHEAT+MILK (34 (sd 9) v. 41 (sd 24) min; P = 0·63). The overall increase in plasma methionine concentrations over the entire 300 min post-prandial period, expressed as iAUC, was 393 % greater for MILK v. WHEAT (5 (sd 1) v. 1 (sd 0·3) mmol·300 min·L−1; P < 0·001), and 112 % greater for MILK v. WHEAT+MILK (5 (sd 1) v. 2 (sd 1) mmol·300 min·L−1; P < 0·001; Fig. 3h).
In general, increases in plasma AA concentrations revealed significant differences over time between MILK and WHEAT for all measured AA except alanine, arginine, glutamic acid and ornithine (see online supplementary material, Supplemental Figure S2), while the increased plasma AA concentrations did not differ between MILK and WHEAT+MILK. The increases in plasma AA concentrations over the entire 300 min post-prandial period (iAUC) were greater for asparagine, isoleucine, threonine, tryptophan, tyrosine and valine, and smaller for cysteine, glycine and proline for MILK v. WHEAT (P < 0·05). For MILK v. WHEAT+MILK, plasma iAUC were greater for isoleucine, threonine, tryptophan, tyrosine and valine (P < 0·05, see online supplementary material, Supplemental Figure S2).
Plasma and muscle L-[ring-13C6]-phenylalanine enrichments
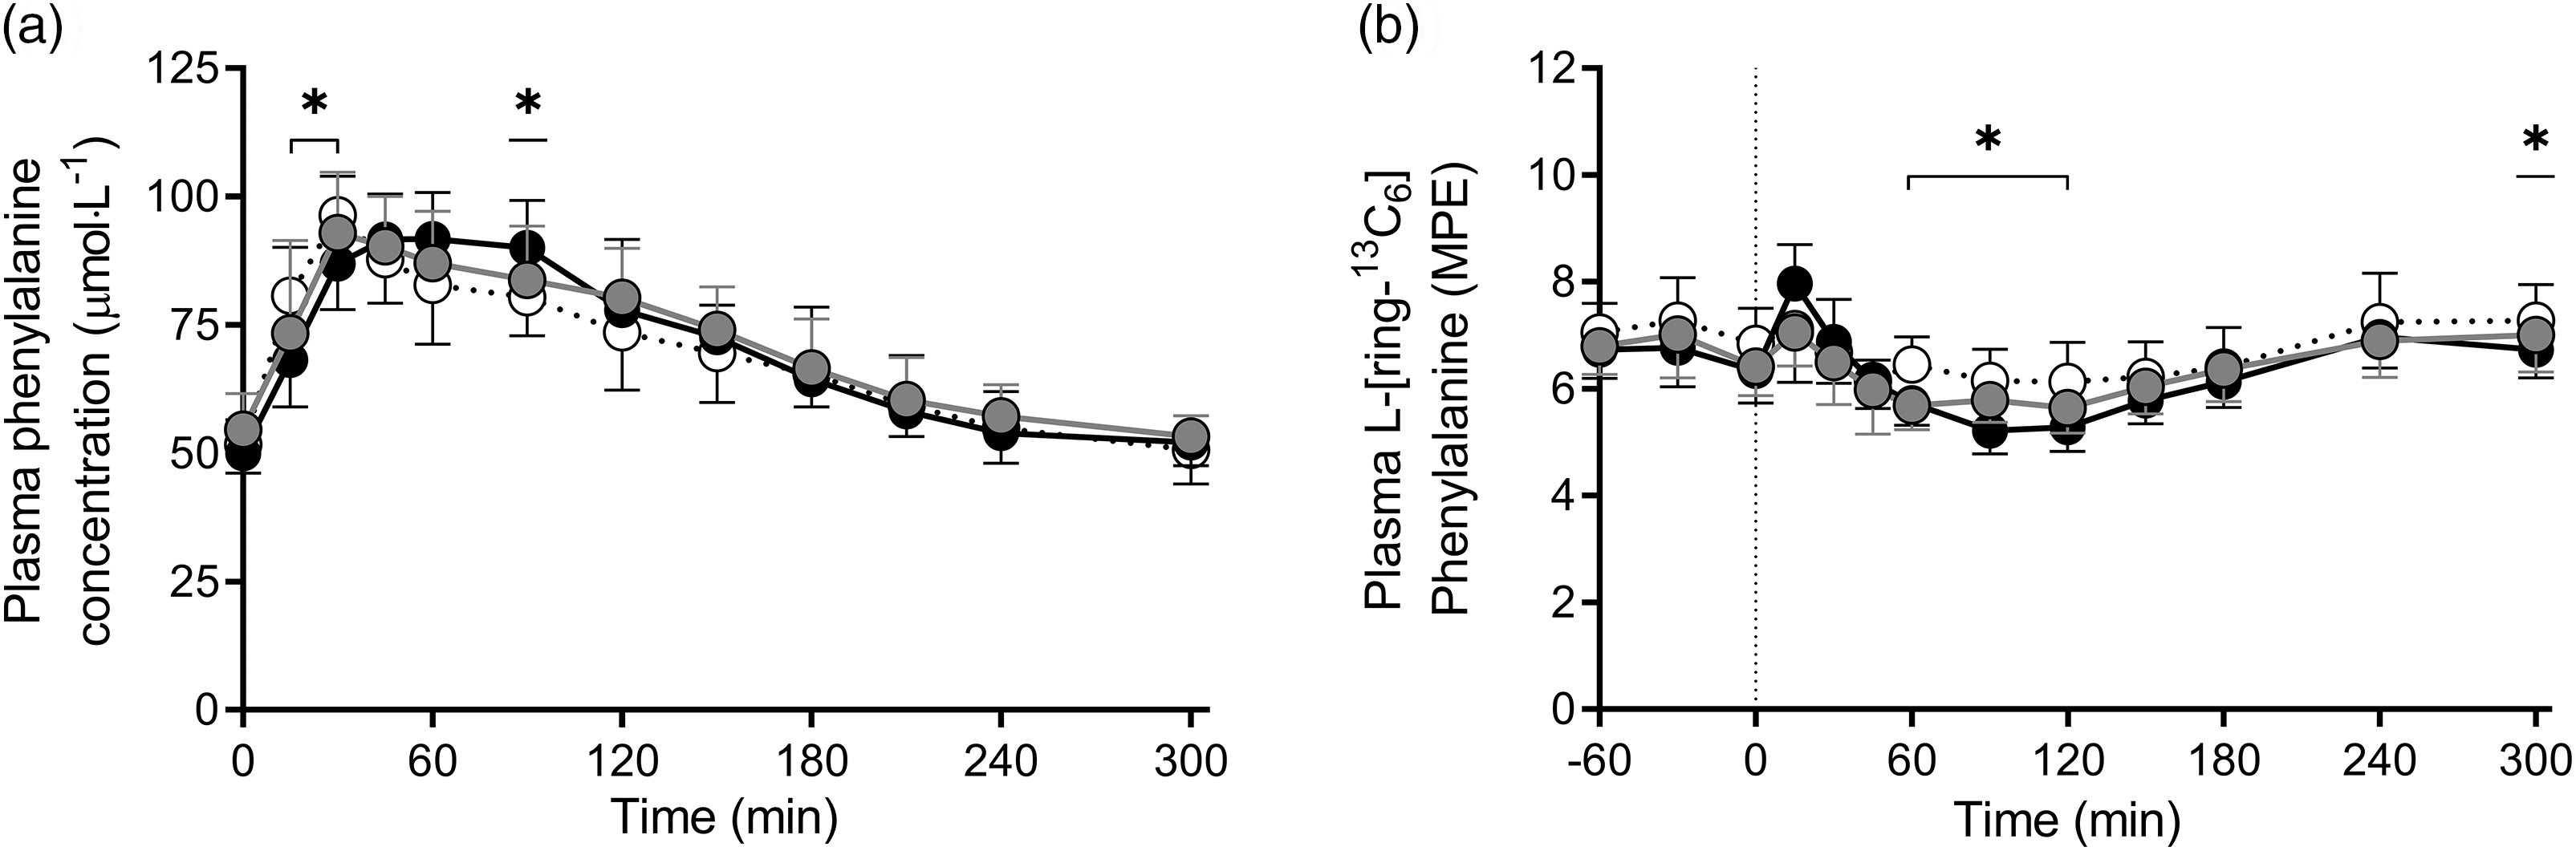
Plasma L-phenylalanine concentrations and L-[ring-13C6]-phenylalanine enrichments over time are presented in Fig. 4a and b, respectively. Plasma L-[ring-13C6]-phenylalanine enrichments over time were different between MILK v. WHEAT at t = 60, 90, 120 and 300 min following protein ingestion (time × treatment: P < 0·001), but not between MILK v. WHEAT+MILK (Fig. 4b; time × treatment: P = 0·51). Mean plasma L-[ring-13C6]-phenylalanine enrichments averaged 7·11 (sd 0·65), 6·80 (sd 0·61) and 6·65 (sd 0·51) MPE during the basal post-absorptive period, and 6·64 (sd 0·53), 6·34 (sd 0·44) and 6·25 (sd 0·36) MPE during the full 300 min post-prandial period for MILK, WHEAT+MILK and WHEAT, respectively.
Post-prandial plasma phenylalanine concentrations (Panel a) and plasma 1-[13C6]-phenylalanine enrichments (Panel b) during the 300 min period following the ingestion of MILK v. WHEAT and MILK v. WHEAT+MILK in healthy, young males (n = 12 per group). Time 0 min represents time of beverage intake. MILK: 30 g milk protein, WHEAT: 30 g wheat protein, WHEAT+MILK: 15 g wheat protein + 15 g milk protein. Values represent means and standard deviation; * significantly different for MILK v. WHEAT (P < 0·05). Repeated-measures ANOVA with time as within-subject variable and interventional drink (treatment) as between-subject variable. Time × treatment: Panel (a): MILK v. WHEAT P < 0·001, MILK v. WHEAT+MILK P = 0·29, Panel (b): MILK v. WHEAT P < 0·001, MILK v. WHEAT+MILK P = 0·51. MPE, mole % excess.MILK;WHEAT+MILK;WHEAT.
Myofibrillar protein-bound L-[ring-13C6]-phenylalanine enrichments increased following ingestion of MILK, WHEAT+MILK and WHEAT from 0·0032 (sd 0·0032), 0·0033 (sd 0·0024) and 0·0038 (sd 0·0018) MPE at t = 0 min to 0·0116 (sd 0·0041), 0·0123 (sd 0·0063) and 0·0107 (sd 0·0044) MPE at t = 120 min reaching 0·0214 (sd 0·0049), 0·0227 (sd 0·0094), and 0·0219 (sd 0·0047) MPE, respectively, at 300 min after protein ingestion, with no differences observed between MILK v. WHEAT (all P > 0·56) and MILK v. WHEAT+MILK (all P > 0·68) at any time point.
Muscle protein synthesis rates
Post-absorptive fractional myofibrillar protein synthesis rates averaged 0·014 (sd 0·014), 0·016 (sd 0·011) and 0·018 (sd 0·009) %·h−1 in MILK, WHEAT+MILK and Wheat, with no differences between MILK v. WHEAT (P = 0·41) and MILK v. WHEAT+MILK (P = 0·81). Protein ingestion increased myofibrillar protein synthesis rates to 0·059 (sd 0·024), 0·067 (sd 0·032) and 0·053 (sd 0·025) %·h−1 during the early post-prandial period (0–120 min) and to 0·049 (sd 0·017), 0·054 (sd 0·036) and 0·058 (sd 0·013) %·h−1 during the late post-prandial period (120–300 min). Post-prandial muscle protein FSR averaged 0·053 (sd 0·013), 0·059 (sd 0·025) and 0·056 (sd 0·012) %·h−1 assessed over the entire 300 min post-prandial period after protein ingestion (Fig. 5, see online supplementary material, Supplemental Figure S3). Post-prandial myofibrillar protein synthesis rates did not differ between MILK v. WHEAT, for the early (0–120 min; P = 0·58), late (120–300 min; P = 0·15) and entire (0–300 min; P = 0·56) post-prandial period. Similarly, post-prandial myofibrillar protein synthesis rates did not differ between MILK v. WHEAT+MILK, for the early (0–120 min; P = 0·47), late (120–300 min; P = 0·69) and entire (0–300 min; P = 0·46) post-prandial period (Fig. 5). Myofibrillar protein synthesis rates determined with the intra-cellular L-[ring-13C6]-phenylalanine enrichments used as precursor pool resulted in similar findings with no differences in FSR values between MILK v. WHEAT and MILK v. WHEAT+MILK at any time point (see online supplementary material, Supplemental Figure S4).
Myofibrillar fractional synthetic rate (FSR) at different time points following ingestion of MILK v. WHEAT and MILK v. WHEAT+MILK in healthy, young males (n = 12 per group). MILK: 30 g milk protein, WHEAT: 30 g wheat protein, WHEAT+MILK: 15 g wheat protein + 15 g milk protein. Values represent means and standard deviation. *significantly different from basal; P < 0·05. Independent-samples t test: MILK v. WHEAT P = 0·41, P = 0·58 and P = 0·56 for basal, 0–120 and 0–300 min, respectively. MILK v. WHEAT+MILK P = 0·81, P = 0·47 and P = 0·46 for basal, 0–120 and 0–300 min, respectively. MILK;
MILK; WHEAT+MILK;
 WHEAT.

Discussion
The present study shows that ingestion of 30 g of protein as either milk, wheat, or a blend of wheat and milk protein is followed by a robust increase in circulating AA concentrations in healthy, young males. Despite the observation of greater post-prandial plasma EAA availability following milk when compared with wheat or wheat plus milk protein ingestion, post-prandial myofibrillar protein synthesis rates did not differ between treatments.
Plant-derived proteins are generally considered to have a lesser capacity to stimulate post-prandial muscle protein synthesis due to among others their incomplete AA profile, with typical low levels of EAA, and in particular low leucine, lysine and/or methionine contents(Reference van Vliet, Burd and van Loon15,Reference Gorissen and Witard16) . Indeed, in the present study, EAA (9·8 v. 6·5 g), leucine (2·4 v. 1·8 g), lysine (2·0 v. 0·4 g) and methionine (0·7 v. 0·4 g) contents were all substantially higher in the milk protein when compared with the wheat protein that was provided (Table 2). These differences also translated into greater post-prandial plasma EAA (+ 110 %), leucine (+ 61 %), lysine (+ 868 %) and methionine (+ 393 %) availability following milk compared with wheat protein ingestion (Fig. 3). Although the AA profile of the various proteins were reflected by the post-prandial plasma AA concentrations, these differences did not affect the post-prandial increase in myofibrillar protein synthesis rates following the ingestion of 30 g of milk or wheat protein (Fig. 5). These findings may seem to be in contrast with our previous work, where we failed to observe a significant increase in muscle protein synthesis rates following ingestion of 35 g of wheat protein hydrolysate, as opposed to the ingestion of an equivalent amount of casein(Reference Gorissen, Horstman and Franssen24). However, the apparent discrepancy is likely explained by the inclusion of healthy, active young males in the present study as opposed to the selection of older males in Gorissen et al.(Reference Gorissen, Horstman and Franssen24). In that study(Reference Gorissen, Horstman and Franssen24), anabolic resistance in the older volunteers(Reference Wall, Gorissen and Pennings33) likely prevented a measurable increase in muscle protein synthesis following ingestion of a similar bolus of wheat protein hydrolysate. Accordingly, it has been suggested that the amount of leucine necessary to induce a robust stimulation of muscle protein synthesis is lower in young when compared with older individuals(Reference Wall, Hamer and de Lange8,Reference Breen and Phillips34,Reference Witard, Wardle and Macnaughton35) . Whether this is merely attributed to an anabolic resistance of ageing or simply secondary to a more sedentary lifestyle remains a topic of debate(Reference Burd, Gorissen and van Loon36). In the present study, the 30 g of wheat protein provided 1·8 g of leucine, which has been reported to be sufficient to stimulate muscle protein synthesis in healthy, young individuals(Reference Tang, Moore and Kujbida14). In line, we observed a strong stimulation of muscle protein synthesis following wheat protein ingestion, despite the lower EAA content and incomplete AA profile in these healthy, young males.
There are only few studies that have assessed the capacity of plant-derived proteins to directly increase post-prandial muscle protein synthesis rates(Reference Tang, Moore and Kujbida14,Reference Wilkinson, Tarnopolsky and Macdonald19–Reference Churchward-Venne, Pinckaers and Smeets21) . Some have reported measurable increases in muscle protein synthesis rates following ingestion of high-quality plant-derived proteins such as soy(Reference Tang, Moore and Kujbida14,Reference Wilkinson, Tarnopolsky and Macdonald19) . Despite the lower EAA content and incomplete AA profile, our data show that even the ingestion of an ample amount of a low(er)-quality plant-derived protein source such as wheat protein can also effectively increase muscle protein synthesis rates in healthy, young males.
We anticipated a lesser muscle protein synthetic response following the ingestion of 30 g of wheat protein when compared with the ingestion of milk protein. Therefore, we also included a third treatment in which we aimed to augment the anabolic properties of the wheat protein by composing a protein blend with equal amounts of both wheat and milk protein. We hypothesised that a protein blend would restore the anabolic properties, thereby allowing a robust post-prandial muscle protein synthetic response while consuming less animal-derived protein. The AA composition of the wheat plus milk protein blend remained different from the milk protein, with the EAA (9·8 v. 8·2 g), leucine (2·4 v. 2·1 g), lysine (2·0 v. 1·2 g) and methionine (0·7 v. 0·6 g) contents being higher in the milk protein when compared with the protein blend. (Table 2). The differences in the protein AA profile translated to a greater post-prandial EAA (+ 58 %), leucine (+ 45 %), lysine (+ 182 %) and methionine (+ 111 %) availability following ingestion of milk when compared with the milk plus wheat protein blend (Fig. 3). The smaller differences in plasma AA availability clearly showed that the ingested protein blend improved post-prandial EAA availability when compared with the ingestion of wheat protein only. In line with observations discussed above, the differences in AA profile and subsequent post-prandial plasma AA availability did not modify post-prandial muscle protein synthesis rates (Fig. 5).
The present study extends on prior work showing no impairments in muscle protein synthesis following ingestion of protein blends combining soy and dairy protein during recovery from exercise in healthy, young adults(Reference Reidy, Walker and Dickinson26,Reference Borack, Reidy and Husaini37) . The present study is the first to compare muscle protein synthesis rates following ingestion of a blend combining a high-quality animal protein source (milk) plus a low-quality plant-derived protein source (wheat) with the same amount of milk protein at rest in healthy, young adults. The findings support the concept that ingestion of an ample, meal-like amount (30 g) of plant-derived protein or plant- plus animal-derived protein blend robustly stimulates muscle protein synthesis rates in healthy, young males to an extent that it does not differ from the response observed after ingesting the same amount of a high-quality animal-derived protein. The lower levels of leucine, lysine and methionine in wheat protein or the wheat plus milk protein blend do not restrict the capacity to induce a significant and sustained muscle protein synthetic response. This is in contrast to current beliefs in which the low(er) levels of certain AA in plant-derived proteins are thought to compromise the post-prandial muscle protein synthetic response to protein ingestion(Reference van Vliet, Burd and van Loon15).
There has been a growing interest in the use of plant-based diets and plant-derived proteins, both from a consumer and scientific perspective(Reference Medawar, Huhn and Villringer38). These data may alleviate the restraints many nutritionists have with regard to the media driven hype to consume more plant-based as opposed to animal-based proteins. From the perspective of post-prandial muscle protein synthesis, the general public is unlikely to compromise post-prandial muscle protein synthesis rates when plant-derived protein(s) are consumed in a single meal containing about 30 g of protein. Although, it should be noted that the present study only investigated wheat protein as a plant-derived protein source, as more research is needed to evaluate the anabolic properties of many other plant-derived protein sources. It could be suggested that a more sustained use of plant-based proteins could lead to a (relative) deficit of specific AA. However, this argument would only hold true if a very limited variety of plant-derived protein sources was consumed over a prolonged time period. The present study was performed in healthy, young and active males who are highly sensitive to the anabolic properties of AA(Reference Moore, Churchward-Venne and Witard39). Although our data are likely to translate to most healthy, active individuals, we need to stress that these findings are unlikely to translate to older adults, sedentary and/or more clinically compromised populations. These populations suffer from anabolic resistance and typically consume less protein per meal(Reference Wall, Gorissen and Pennings33,Reference Weijzen, Kouw and Verschuren40–Reference Tieland, Borgonjen-Van den Berg and van Loon42) . Consequently, in these populations, a greater post-prandial rise in circulating plasma EAA, and leucine in particular, may be needed to induce a proper post-prandial muscle protein synthetic response, which is essential for the maintenance of muscle mass. Therefore, research is warranted to establish the anabolic response following the consumption of more plant-based v. animal-based protein meals and diets in older and/or more clinically compromised populations.
In conclusion, ingestion of 30 g of milk protein, 30 g of wheat protein or a blend of 15 g of wheat plus 15 g of milk protein increases muscle protein synthesis rates in young, healthy males. Post-prandial muscle protein synthesis rates following the ingestion of 30 g of milk protein do not differ from rates observed after ingesting 30 g of wheat protein or a blend providing 15 g of milk plus 15 g of wheat protein in healthy, young males. Ingestion of a meal-like (30 g) dose of plant-derived protein can be as effective as ingesting the same amount of animal-derived protein to increase muscle protein synthesis rates in vivo in healthy, young males.
Acknowledgements
We thank Joey S.J. Smeets and Lisanne H.P. Houben for their medical assistance, Joan M. Senden, Michelle E.G. Weijzen, Prof. Dr Satoshi Fujita, Johannes Quandel, Marieke de Graaf and Art Muijsenberg for their practical assistance, Dr Henk Schierbeek, Joy P.B. Goessens, Annemarie P. Gijssen, Dr Stefan H.M. Gorissen, Antoine H. Zorenc, Wendy E. Sluijsmans and Hasibe Aydeniz for their analytical work. We also extend our gratitude to all study participants for their time and commitment.
This project is organised by and executed under the auspices of TiFN (Wageningen, the Netherlands), a public–private partnership on precompetitive research in food and nutrition (Project code: 16NH02). Funding for this research was obtained from Tereos (Marckolsheim, France), Cargill (Minneapolis, MN, USA), Kellogg (Battle Creek, MI, USA) and the Top-sector Agri&Food (Project AF-16504).
The author contributions were as follows: L. J. C. v. L., T. S., L. B. V., L. C. P. G. M. d. G. and P. J. M. P. designed research; P. J. M. P., I. W. K. K., F. K. H. and J. M. X. v. K. conducted research; P. J. M. P., T. S. and L. J. C. v. L. analysed data; P. J. M. P. and L. J. C. v. L. wrote paper; P. J. M. P., T. S. and L. J. C. v. L. had primary responsibility for final content. All authors read and approved the final manuscript.
P. J. M. P., I. W. K. K., L. C. P. G. M. d. G., L. B. V., T. S. and L. J. C. v. L. have the following interests: The present study was funded by TiFN, Wageningen, the Netherlands. The sponsors Tereos Syral (Marckolsheim, France), Cargill (Minneapolis, MN, USA) and Kellogg (Battle Creek, MI, USA) partly financed the project. The researchers are responsible for the study design, data collection and analysis, decision to publish, and preparation of the manuscript. The industrial partners have contributed to the project through regular discussion and were involved in the study design. More specifically, the choice of interventional products which were produced by these sponsors. The funders had no role in data collection and analysis, decision to publish, or preparation of the manuscript. In addition, LJCvL and LBV have received research grants, consulting fees, speaking honoraria, or a combination of these from FrieslandCampina, Tereos Syral, and Pepsico. The other authors report no conflicts of interest.
Supplementary material
For supplementary material/s referred to in this article, please visit https://doi.org/10.1017/S0007114521000635


 Open access

