

The type and quantity of fat intake that is associated with good health continues to be a hotly debated topic. Studies in the 1980s and 1990s showed that replacement of SFA by PUFA significantly decreased the risk of CHD(Reference Keys, Anderson and Grande1), leading to the general recommendation to lower SFA and increase PUFA intakes(Reference Ramsden, Hibbeln and Majchrzak2). However, more recent data have suggested that not all saturated fats have deleterious effects, and some SFA, like short- and medium-chain SFA, can actually be beneficial to health(Reference Iggman and Risérus3). In addition, recent studies suggest that high levels of n-6 fatty acids can be deleterious to health, with positive correlations between consumpution of n-6-rich vegetable oils and risk of metabolic syndrome(Reference Narasimhan, Nagarjan and Vaidya4–Reference Lakshmipriya, Gayathri and Praseena6). This is particulary relevant to Indian diets that are relatively low in SFA, but with a preponderance of n-6 PUFA-rich vegetable oils, which has resulted in skewed dietary n-6/n-3 ratios(Reference Mani and Kurpad7). Thus, the Indian RDA for fats suggests that a blend of vegetable oils may be used to obtain ideal n-6/n-3 ratios(8). However, mustard oil, which is a commonly consumed vegetable oil in many parts of North India, contains high levels of n-3 fatty acids, and diets prepared with this oil can provide n-6/n-3 ratios that are in the recommended range (<10)(Reference Manchanda and Passi9,Reference Mishra and Manchanda10) .
Mustard oil occupies a unique place in India’s history: food historians claim that it was used as early as 3000 BC in the Indus Valley Civilization. Traditionally, mustard oil was the main cooking oil in the northern and eastern states of India, mainly West Bengal and Punjab(Reference Achaya11). The fatty acid profile of mustard oil has the ideal blend for daily consumption (SFA 4 %, MUFA 65 %, n-6 PUFA 15 %, n-3 PUFA 14 %)(8). Thus, a calculation of the fatty acid composition of diets cooked in different oils shows that mustard oil provides the optimal blend of SFA, MUFA and n-6/n-3 ratio required in the diet(Reference Manchanda and Passi9,Reference Mishra and Manchanda10) . However, earlier animal studies suggested that the high erucic acid content of mustard oil (up to 50 %) could be deleterious to health due to its ability to cause lipid accumulation in myocardial tissue(Reference Abdellatif and Vles12–Reference Clandinin14). The Government of India banned the consumption of mustard oil in 1998 due to an increase in the incidence of dropsy among its consumers; however, subsequently, it was determined that this was not due to erucic acid, but due to the adulteration of mustard oil with argemone oil(Reference Sharma, Malhotra and Bhatia15,Reference Das and Khanna16) . In September 1998, the ban on packed mustard oil was removed after a Cabinet decision conditional to displaying the packing date and standards for Mustard oil were laid down by the Central Government under the Prevention and Food Adulteration Rules, 1955, that orders that mustard oil should be free of argemone oil. Most studies report a protective effect of mustard oil on ischemic heart disease and acute myocardial infarction despite its erucic acid levels(Reference Singh, Niaz and Sharma17–Reference Rastogi, Reddy and Vaz19), while only one(Reference Manna, Sharma and Vyas20) reported an increase in CHD. This study however was neither sufficiently powered nor was appropriately designed (only a cross-sectional observational study) to examine a causal association.
Given that India is a diverse country with markedly different use of different cooking oils across its geography, the association between consumption of different oils and health outcomes can be examined. In this study, the relation between mustard oil consumption and BMI as a health outcome was explored by utilising publicly available data from large and extensive surveys of oil consumption and anthropometry across India. This was done using a single triangulated data set obtained by statistically matching the households from National Sample Survey Office (NSSO) with households from National Family Health Survey-4 (NFHS-4) for the same district of a state.
Materials and methods
Data sources
Since there is no single comprehensive nation-wide survey in India that collects data on both food intake and health outcomes, an alternative strategy was designed using two national level survey data sets. Data on sociodemographic factors and height and weight in adult men and women were obtained from the NFHS-4, 2015–2016(21), while data on household nutrient and oil intake were obtained from the 68th round (2011–2012) of the NSSO(22). The households from NSSO were statistically matched or triangulated with households from NFHS-4 for the same district of a state, and a single triangulated data set was obtained.
The ninth quinquennial Household Consumer Expenditure survey of the 68th round of the NSSO covered all the twenty-nine states and six union territories of India. The survey covered 59 683 households in rural and 41 968 households in urban India. Monthly per capita consumer expenditure on various items including 223 food items was collected through this survey, for a recall period of 30 d. The quantities of food purchased by a household were converted to macro- and micronutrients of interest using the Indian food composition table(Reference Longvah, Ananthan and Bhaskarachary23,Reference Gopalan, Rama Sastri and Balasubramanian24) . Food items that were listed by number or cost were converted to food weights. The total quantity consumed by the household was divided by the household size to arrive at per capita intake. The intake of per capita fat and saturated fat was computed in grams of intake and as percentage of energy. The per capita total oil consumption, and specifically each type of oil, was also computed from the household expenditure towards oil. Per capita consumption of other sources of fat such as meat, milk and nuts was also computed. The per capita fat intake in the rural households of NSSO was validated against the per capita fat intakes of households from diet recalls conducted in ten states in the National Nutrition Monitoring Bureau (NNMB) rural survey(25), which was conducted during the same time. Average fat intake of rural women as percentage of energy (%/d, per consumption unit) from both surveys was correlated strongly (r = 0·95), and the average difference in fat intake was 5·19 % ± 1·8 %/d between surveys.
The NFHS-4 collected information on population health and associated factors for India and each State/Union territory. A stratified two-stage sampling with 2011 census as the base sampling frame was used. The NFHS-4 collected data on household and individual sociodemographic characteristics and anthropometric measures including weight and height for all adult men and women over the age of 18 years from 601 509 households, across 640 districts covering twenty-nine states and six union territories of India. Weights were measured using Seca 874 model weighing scale to the nearest 10 g, and heights were measured using Seca 213 stadiometer to the nearest 0·1 cm. BMI was calculated. Pregnant women were excluded from this analysis. Men and women were classified as overweight/obese if BMI ≥ 25 kg/m2, normal if BMI was between 18 and 25 kg/m2 and underweight if BMI < 18 kg/m2(26). The potential action point cut-off for Asian populations, BMI ≥ 23 kg/m2, was also considered as a cut-off(27).
Data analyses
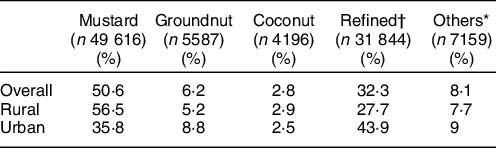
The statistical matching of households from the two surveys was carried out using the ‘Nearest-Neighbour Hot-Deck’ method(Reference D’Orazio28), by considering a set of matching variables (‘family size’, ‘religion’, ‘locality (rural/urban)’, ‘socio-economic status’) which were common in both surveys. The donor data set for triangulation was the food and nutrient intake data from NSSO-68, while the NFHS-4 household survey data formed the recipient. The details of statistical matching between NFHS-4 and NSSO-68 and the validation of the same have been detailed elsewhere(Reference Swaminathan, Ghosh and Varghese29). All analyses were performed on the triangulated data set with appropriate survey weighting. Pearson correlation of BMI with macronutrients such as energy, protein, carbohydrate and fat intake and foods such as oil, meat, milk and nuts was performed. With oil consumption not being normally distributed, the comparison of intakes between different BMI categories was analysed using Kruskal–Wallis test. A predominant oil was defined as the oil that was more than 50 % of total added oil consumed in a household, and the predominant oils listed(30) were mustard, groundnut, coconut, refined (sunflower, safflower, soyabean) and other edible oils (ricebran, sesame, linseed (flaxseed), rapeseed and all other oils) as described in Table 1. Many oils in India are available either as filtered (unprocessed) or refined (processed to remove seed odour). The oils included under the heading of ‘refined oils’ are those that are obtained only as de-colourised and de-odourised oils. This grouping was as per NSSO food consumption questionnaire, and households were classified as consuming predominant oil, or not. Logistic regression was performed to estimate the association of predominant use of mustard oil with overweight/obesity in women and men; the reference group for this analysis was women and men belonging to households with the predominant use of any oil other than mustard oil. Potential confounders considered in multiple variable logistic regression were age, wealth index, place of residence (rural/urban), physical activity (classified as sedentary, moderate and heavy based on occupation)(31), total fat, energy consumption and intakes of milk, meat, added sugar, fruits and vegetables. The confounders were selected based on literature review and their availability in NFHS-4/NSSO survey data. Adjusted OR (AOR) and 95 % CI of overweight/obesity are reported. This analysis was repeated with BMI cut-off ≥23 kg/m2. A similar analysis was conducted by stratification of wealth index, place of residence, total fat intake and mustard oil predominant states to understand the effect modification of these factors on the association between predominant use of mustard oil and overweight/obesity.
Predominant oil use distribution
* Others include all other edible oils (ricebran oil, sesame oil, flaxseed (linseed) oil, rapeseed oil and all other edible oils).
† Refined oils include sunflower oil, safflower oil and soyabean oil.
Further, Indian states were clubbed as per their geographic location into six regions: North, Northeast, East, West, Central and South (see online supplementary material, Supplemental Table 1). The association of predominant use of any oil other than mustard oil with overweight/obesity was examined specifically in a region. Since a good proportion of households were consuming groundnut oil in South and West regions, the association of groundnut oil with overweight/obesity was examined across three oil categories: groundnut, mustard and all others combined, and corresponding AOR was reported. Although refined oil was consumed, a separate analysis of this was not performed as refined oil was reported as a combination of individual oils with different fatty acid profiles.
All analyses were performed separately for men and women. All men and women who were undernourished (BMI < 18·5 kg/m2) were excluded from the regression analysis. The data were analysed using R-statistical software version 3.5.0 (R core Team, 2018). Statistical matching was executed by ‘StatMatch’ package developed under the R computational environment(Reference D’Orazio28).
Results
The process followed for triangulation of household level data between NFHS-4 and the NSSO 68th round is illustrated in Supplemental Figure 1. A total of 477 122 households from the NFHS (recipient) could be matched with 68 511 households from the NSSO (donor). The association of NSSO and NFHS-4 household wealth indices with fat intake and BMI was similar in the triangulated data. The survey-weighted correlation coefficients between BMI and wealth quintile from NSSO and NFHS4 for women were 0·14 (95 % CI 0·13, 0·14) and 0·29 (95 % CI 0·29, 0·29) for men. The survey-weighted correlation coefficients between total fat intake and wealth quintile from NSSO and NFHS 4 for women were 0·55 (95 % CI 0·55, 0·55) and 0·32 (95 % CI 0·32, 0·32) for men, although the variable from the matched data set showed a slightly weaker correlation. These analysis indicate that BMI was poorly correlated with wealth score and household fat intake was more strongly correlated with wealth.
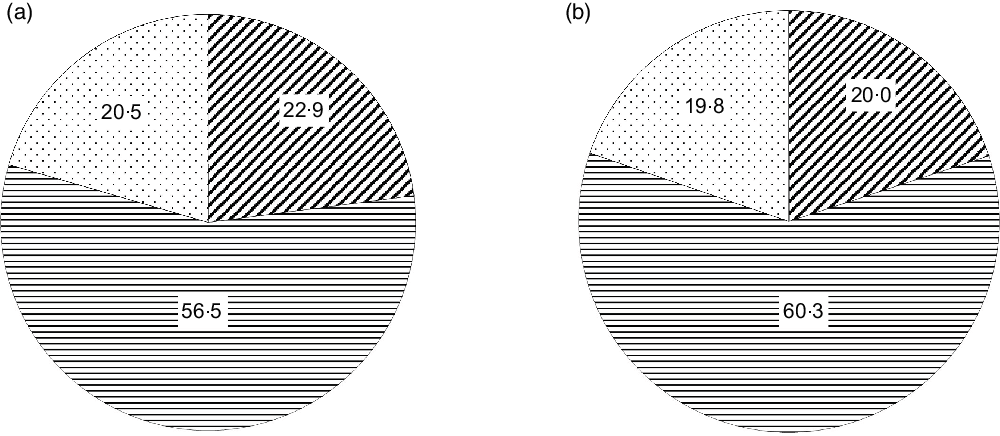
Within the triangulated households, data on 638 445 women and 92 312 men were considered in this analysis. There was a high number of women in comparison with men, as the NFHS-4 sampling was done with major emphasis on women in reproductive age and young children. The prevalence of overweight/obesity was 21 % in women and 20 % in men (Fig. 1). The average BMI was 21·9 ± 4·4 kg/m2 for women and 21·9 ± 4·0 kg/m2 for men.
Distribution of different BMI categories in women (a) and men (b) in triangulated data. ![]() , Underweight;
, Underweight; ![]() , normal;
, normal; ![]() , overweight/obese
, overweight/obese
The oils consumed in households were mustard, groundnut, coconut, refined (sunflower, safflower, soyabean) and other edible (ricebran, sesame, linseed (flaxseed), rapeseed and all other oils), and there were households that used multiple oils. The percentage of households consuming the different oils is reported in Supplementary Table 2. However, mustard oil was consumed as the predominant oil in 51 % of the households (Table 1). There was a difference in the consumption patterns in urban v. rural households - mustard oil was the predominant oil in 56·7 % of rural households, whereas in urban households, mustard oil was the predominant oil in 35·8 % of households. In urban households, refined oils (sunflower, safflower and soyabean) were predominantly consumed (43·9 %).
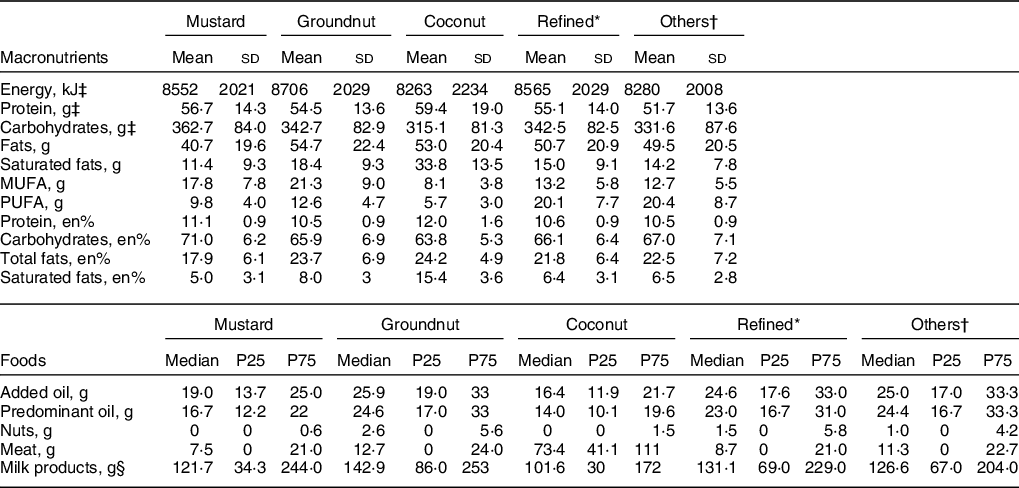
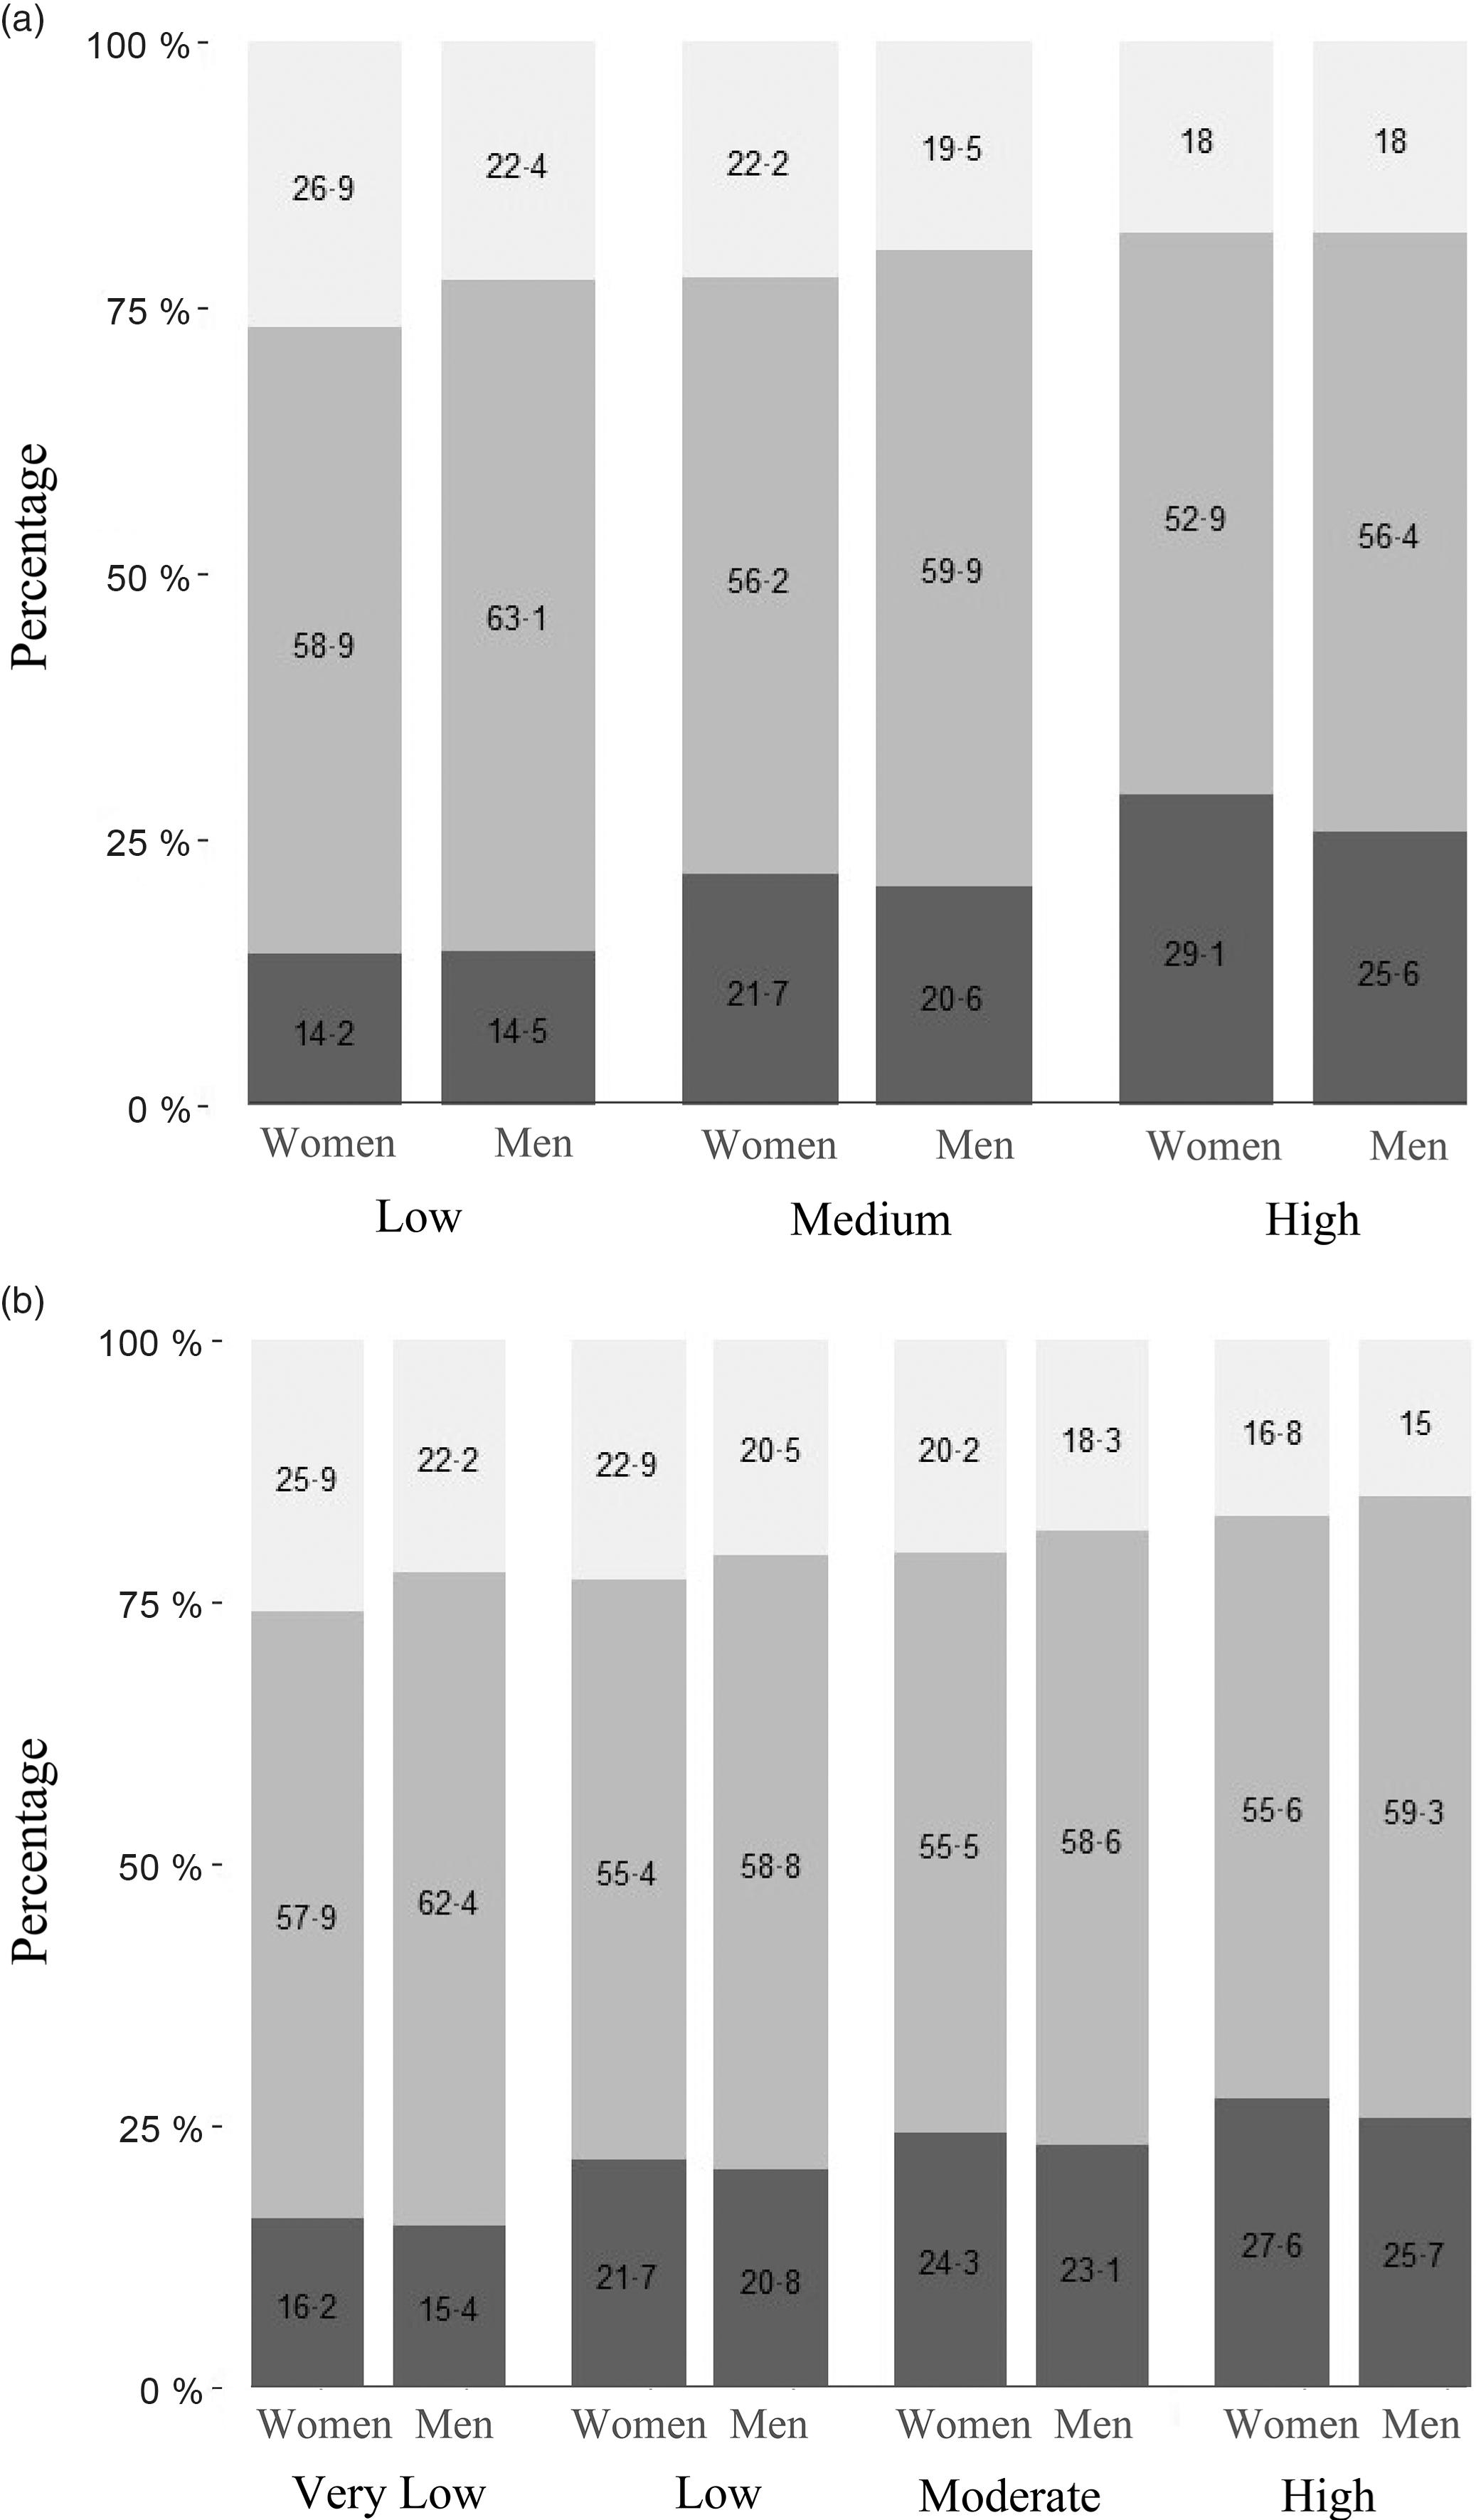
The energy, total fat and food intakes of the population based on predominant oil consumption are presented in Table 2. The average per capita energy intake was 8552 kJ/d, and total fat intake was 40·7 g/d (lowest) in the predominant mustard oil group. The per capita fat intake as percentage energy (en%) was 17·9 % in the predominant mustard oil group, and this was 28 % lower than the moderate intake range of 25–30 %. Similarly, the average intake of saturated fat (5 en%) was only 50 % of the maximum limit recommended for the intake of this nutrient(Reference Amine, Baba and Belhadj32). The consumption of added oil, nuts, milk and meat that contribute to total fat consumption was comparable between mustard oil group and other oil groups. The total fat as en% was divided into low (<15 %), medium (15–30 %) and high (>30 %) intakes. Saturated fat as en% was divided into very low (<5 %), low (5–7 %), moderate (7–10 %) and high (>10 %) intakes. Overweight/obesity was associated with total fat intake, P < 0·001 (Fig. 2a). Specifically, overweight/obesity in both men and women was associated with high saturated fat intake (P < 0·001), with 28 % women and 23 % men in high intake group (Fig. 2b). Since low BMI was not associated with fat intake (Figs 2a and b) and the primary focus of this analysis was on overweight/obesity, low BMI men (19·9 %) and women (22·9 %) were not considered for further analysis.
Distribution of macronutrients and foods across the predominant oil groups
* Refined oils include sunflower oil, safflower oil and soyabean oil.
† Others include all other edible oils (ricebran oil, sesame oil, flaxseed (linseed) oil, rapeseed oil and all other edible oils).
‡ Values presented are per capita household consumption in Mean and sd, All other values are Median and 25,75 percentiles (P25, P75).
§ Milk products includes liquid milk, and other milk products, for example, yoghurt etc. Added oil is total of all the different oils consumed including butter and ghee.
(a) Association of BMI categories with total fat intake in women. The bars represent the percentage of women with low, normal and high BMI within each category of fat intake. The categories of fat intake as percentage of energy are: Low (<15 %), Medium (15–30 %) and High (>30 %). ![]() , Low;
, Low; ![]() , Normal;
, Normal; ![]() , High. (b) Association of BMI categories with saturated fat intake in men. The bars represent the percentage of men with low, normal and high BMI within each category of saturated fat intake. The categories of saturated fat intake as percentage of energy are: Very low (<5 %), Low (5–7 %), Moderate (7–10 %) and High (>10 %).
, High. (b) Association of BMI categories with saturated fat intake in men. The bars represent the percentage of men with low, normal and high BMI within each category of saturated fat intake. The categories of saturated fat intake as percentage of energy are: Very low (<5 %), Low (5–7 %), Moderate (7–10 %) and High (>10 %). ![]() , Low;
, Low; ![]() , Normal;
, Normal; ![]() , High
, High
Lower percentage of women (17 %) and men (15 %) belonging to predominantly mustard oil-consuming households was overweight/obese, P < 0·001 (Table 3). Mustard oil intake was associated with a significantly lower odds of overweight/obesity for women (OR = 0·62; 95 % CI 0·61, 0·63) and men (OR = 0·59; 95 % CI 0·57, 0·61), compared with other oils as predominant, in logistic regression analysis. After adjusting for sociodemographic factors such as age, wealth index, place of residence (rural/urban), physical activity level, total fat, energy consumption and intakes of milk, meat, added sugar, fruits and vegetables, the adjusted odds for this association remained significantly lower for mustard oil intake for women (AOR = 0·88; 95 % CI 0·87, 0·89) and men (AOR = 0·80; 95 % CI 0·76, 0·83). The AOR for fat intake was 1·003 (95 % CI 1·002, 1·004) in women and 1·004 (95 % CI 1·002, 1·005) in men. The AOR when computed for overweight/obesity as BMI ≥23 kg/m2 as cut-off for women was 0·92 (95 % CI 0·91, 0·94) and that of men was 0·84 (95 % CI 0·81, 0·87).
Distribution of overweight/obesity by predominant oil consumed in the households
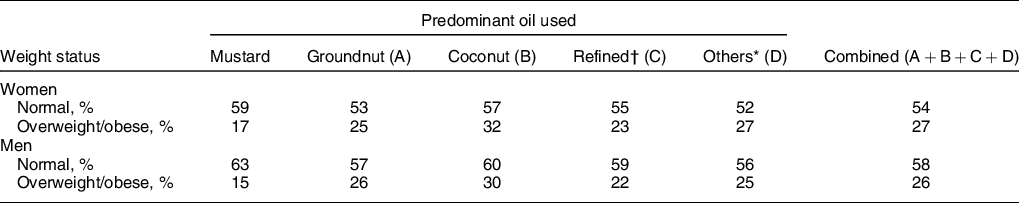
* Others include all other edible oils (ricebran oil, sesame oil, flaxseed (linseed) oil, rapeseed oil and all other edible oils).
† Refined oils include sunflower oil, safflower oil and soyabean oil.
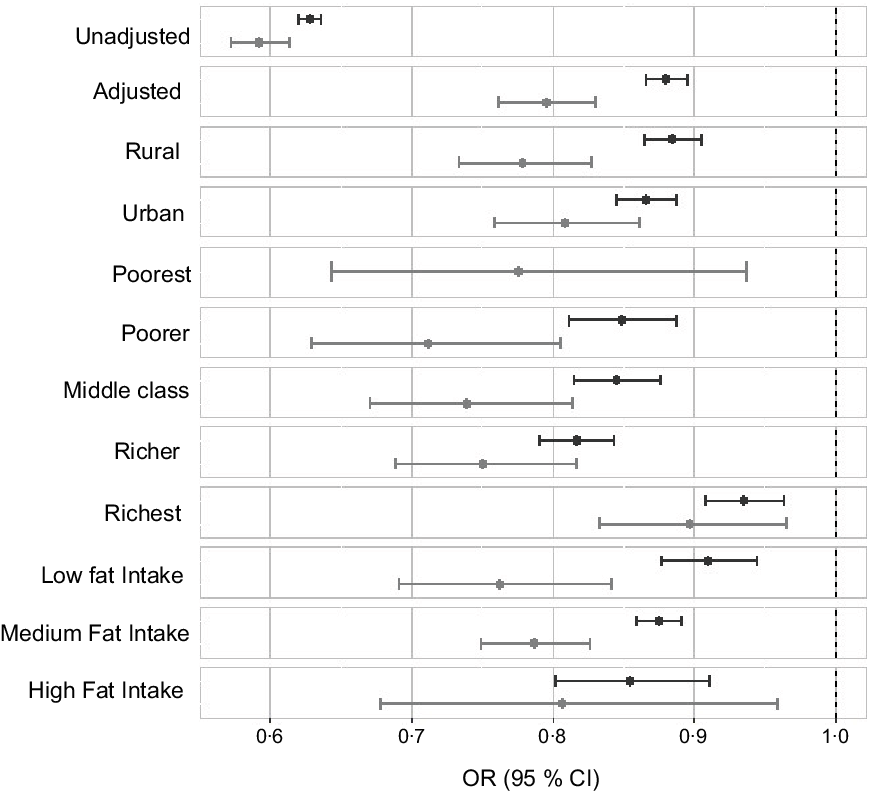
The effect modification of covariates on predominant use of mustard oil was further examined by stratified analysis (Fig. 3). The association was performed with three categories of fat intake as en%: <15 % as low, 15–30 % as medium and >30 % as high. The AOR was comparable across fat intake categories and place of residence in both women and men. The protective effect of mustard oil on overweight/obesity was present across the different quintiles of wealth except the poorest category of women.
OR of overweight/obesity with the predominant use of mustard oil adjusted for sociodemographic factors such as age, wealth index, place of residence (rural/urban), physical activity level, total fat, energy consumption and intakes of milk, meat, added sugar, fruits and vegetables with 95 % CI. ![]() , Women;
, Women; ![]() , men
, men
The oil intakes were also examined within the different regions of India (see online supplementary material, Supplemental Table 1). Mustard oil was predominant in North, Northeast and East regions, where more than 90 % of households consumed it as their predominant oil. For West, central and south, refined oil was predominant, where more than 50 % of households consumed it as their predominant oil. The prevalence of overweight/obesity was lower in the predominant mustard oil regions (North, Northeast and East–30 % for women and 31 % for men) compared with other regions of India (36 % for women and 39 % for men); however, the difference did not reach statistical significance. For South and West regions (both regions combined), where there was reasonably high consumption of groundnut oil, a similar analysis was performed to compare predominant mustard oil and groundnut oil consumption against all other oils combined. The unadjusted odds of overweight/obesity with predominant use of groundnut oil was 0·99 (95 % CI 0·96, 1·02) for women and 0·98 (95 % CI 0·92, 1·05) for men. However, the association of mustard oil consumption continued to be inversely associated with overweight/obesity (AOR = 0·66; 95 % CI 0·65, 0·67 in women and AOR = 0·70; 95 % CI 0·69, 0·71 in men).
Discussion
Global oil consumption is increasing, of which 37·6 % (70·3 million tonnes) are provided by palm and palm kernel, 30 % (55 million tonnes) by soybean and the remaining 32·5 % are supplied by rapeseed, sunflower, peanut and cottonseed oils(33). On the other hand, in India, more than 50 % of the population consume mustard oil, while 32·3 % consume various kinds of refined oils and rest consume other oils like coconut, groundnut etc. Our study indicated that mustard oil was inversely associated with overweight and obesity in men and women.
The use of mustard oil as an edible oil has been actively discouraged, and the Food and Drug Administration (FDA) of the USA has put out an import alert stating that expressed mustard oil was not permitted for use as a vegetable oil, due to its high content of erucic acid(34). This was because studies in the 1970s and 1980s suggested that erucic acid could cause cardiac lipidosis in animal models(Reference Chien, Bellary and Nicar35,Reference Charlton, Corner and Davey36) . The impact of the animal studies led to governments worldwide moving away from consumption of mustard oil. This also led to the development of low erucic acid varieties of mustard oil (also known as rapeseed oil). The main research into this area was conducted in Canada, where rapeseed was grown in large quantities for industrial oil extraction. In the 1960s, Canadian plant breeders isolated rapeseed varieties with low eicosanoic and erucic acid levels. The resultant edible oil was named as rapeseed oil (CANadian Oil, Low erucic Acid) and was marketed extensively as a healthy oil with the right blend of fatty acids(Reference Dupont, White and Johnston37), and also as an oil that could provide benefits comparable with that of olive oil in the Mediterranean diets(Reference Hoffman and Gerber38).
A 2013 review, sponsored by the Canola Council of Canada and the US Canola Association, concluded that consumption of rapeseed oil compared with consumption of other dietary fats led to significant reductions in total cholesterol and LDL-cholesterol(Reference Lin, Allemekinders and Dansby39). It also regarded rapeseed amongst the healthiest edible vegetable oils in terms of its biological functions and its ability to aid in reducing disease-related risk factors and improving health.
However, rapeseed oil has had its own share of controversy, mainly due to the fact that almost all the rapeseed oil produced is using GM strains. Furthermore, the availability and affordability of the oil in countries like India is very poor, and a large part of the population continues to consume erucic acid-rich mustard oil.
Very few human studies have been done, and postmortem studies have documented induced changes due to regular erucic acid consumption like lower platelet counts, erucic acid esterified into liver, adrenal glands and heart muscles(Reference Crowther, Barr and Kelton40–Reference James, Posada-de la Paz and Abaitua-Borda42). A recent toxicological review and risk assessment report by Food Standards Australia New Zealand mentions a few studies indicating deposition of erucic acid in heart muscles, but states that the available evidence does not show an association between myocardial lesions of the type observed in rats and the consumption of rapeseed oil. Erucic acid is known to be toxic in animals and humans at high enough levels, but there is no evidence of health risks to humans when consumed as part of the diet(43). On a positive note, studies also showed that a combination of oleic acid and erucic acid (Lorenzo’s oil) could be used to treat adrenoleukodystrophy(43,Reference Rizzo, Leshner and Odone45) ; there are very few studies which talk about the benefits of mustard oil in diets. A significant and dose-dependent inverse association between vegetable oil intake and risk of ischemic heart disease was observed in a multi-centric study in India. Use of mustard oil, which is rich in α-linolenic acid, was associated with a lower risk of ischemic heart disease than was the use of sunflower oil(Reference Rastogi, Reddy and Vaz19). Another study suggested that consumption of fish cooked in mustard oil may have provided an antithrombotic role in hypertensive subjects by reducing blood pressure as well as blood lipids(Reference Das, Sanyal and Basu18). The findings of a randomised, double-blind, placebo-controlled trial of fish oil and mustard oil in patients with suspected acute myocardial infarction study suggested that fish oil and mustard oil, possibly due to the presence of n-3 fatty acids, may provide rapid protective effects in patients with acute myocardial infarction(Reference Singh, Niaz and Sharma17).
The results presented here clearly indicate that mustard oil consumption is associated with a lower BMI both in women and in men both in urban and rural populations. Another interesting observation is that households with mustard oil as the predominant oil consumed lesser oil and thereby lesser total fat. However, the association of low BMI with mustard oil use persisted even after adjusting for the consumption of total fat.
Several potential limitations should be considered while interpreting the results of this study. First, the dietary data were obtained from a structured questionnaire, and therefore response bias could not be ruled out. Second, many of the popularly consumed oils in urban households (sunflower, soyabean) were clubbed together and could therefore not be assessed inidividually. Third, there is a time lag of 3 years between the survey that recorded the dietary data and the survey that recorded BMI, and during this period, predominant oil use may have changed in some households which is not accounted for in this analysis. Finally, BMI is increasingly being questioned as the right parameter to assess overweight or obesity, since it does not differentiate between body fat and body muscle content(Reference Ho-Pham, Lai and Nguyen46–48). However, when considering such large population data sets, it does offer a valuable insight that provides a good stepping stone to further investigation on health outcomes.
Conclusion
The results based on large sample sizes suggest that predominat mustard oil consumption is inversely associated with BMI, with lower odds of overweight/obesity compared with the predominant use of other oils. The earlier studies on laboratory animals led to public and governments worldwide moving away from mustard oil. However, the current results, based on large national surveys, showing the beneficial effect of mustard oil consumption for BMI as a health outcome, suggest that more research should explore these associations further.
Acknowledgements
Acknowledgements: We would like to acknowledge Vishnu GP and Satvik Kishore who were involved with the initial cleaning of the NSSO and NFHS data sets, respectively. Financial support: This study was not funded by any external organisation. Conflict of interest: There are no conflicts to declare. Authorship: R.C. and T.T. were involved in the data acquisition, analysis and drafting the work. T.T., I.M. and S.S. were involved in conception and design of the work, interpretation of data, revising the manuscript critically for important intellectual content and final approval of the version to be published. A.V.K., I.M. and T.T. were involved in the drafting the manuscript and final approval of the manuscript to be published. T.T. and I.M. will be accountable for all aspects of the work in ensuring that questions related to the accuracy or integrity of any part of the work are appropriately investigated and resolved. Ethics of human subject participation: This study was conducted with publicly available secondary data collected in two national surveys conducted according to the guidelines laid down in the Declaration of Helsinki. The details of the surveys are reported elsewhere.
Supplementary material
For supplementary material accompanying this paper visit https://doi.org/10.1017/S1368980020004632


