


1. Introduction
In tokamaks, antennas that are placed near the wall of the device generate radiofrequency (RF) electromagnetic waves. These RF waves propagate across the turbulent plasma edge region and couple power to the core plasma for heating and non-inductive current generation. The plasma in the turbulent edge consists of blobs and filamentary structures (Krasheninnikov Reference Krasheninnikov2001; Grulke et al. Reference Grulke, Terry, LaBombard and Zweben2006; Myra et al. Reference Myra, D’ Ippolito, Stotler, Zweben, LeBlanc, Menard, Maqueda and Boedo2006a; Myra, Russell & D'Ippolito Reference Myra, Russell and D'Ippolito2006b; Zweben et al. Reference Zweben, Boedo, Grulke, Hidalgo, LaBombard, Maqueda, Scarin and Terry2007; Pigarov, Krasheninnikov & Rognlien Reference Pigarov, Krasheninnikov and Rognlien2012)), drift waves, rippling modes (Ritz et al. Reference Ritz, Bengtson, Levinson and Powers1984) and random fluctuations. Theoretical and computational studies have shown that the RF waves propagation properties are altered owing to their interaction with blobs and filaments (Ram & Hizanidis Reference Ram and Hizanidis2016; Ioannidis et al. Reference Ioannidis, Ram, Hizanidis and Tigelis2017). These studies have provided physical insight into the scattering process by constructing full-wave analytical solutions. However, in these solutions it is assumed that the edge plasma is a single spherical blob (Ram, Hizanidis & Kominis Reference Ram, Hizanidis and Kominis2013) or a single cylindrical filament (Ram & Hizanidis Reference Ram and Hizanidis2016). In the general case, the edge plasma is a more intricate mixture of blobs and filaments of different shapes and sizes as well as wave-like magnetohydrodynamic (MHD) instabilities.
In these studies, two approximations are made. First, the edge plasma is considered to be cold and thus thermal effects are ignored. As a result, only the cold plasma RF waves propagate in the edge region. Second, the edge plasma is considered to be stationary. This is supported by the fact that the time scales of the RF waves are much shorter compared with those of the edge turbulence. The edge turbulence time scales are in the kHz range of frequencies (MHD) and the fluctuation speeds are in the ion-acoustic range. On the other hand, the RF time scales are from 10 s of MHz to 100 s of GHz (kinetic regime) and the group speeds are near the speed of light. Under these assumptions, in a full-wave analysis for RF propagation, Maxwell's equations should be solved where the plasma permittivity in the edge region is an anisotropic tensor that depends on the local density. In addition, it is assumed that the ambient magnetic field is uniform and of arbitrary direction.
Experimentally, detailed measurements of the plasma density in the edge region cannot be obtained. Therefore the effective permittivity is modelled under some assumptions. One possibility is to adopt a generalization of the Maxwell–Garnet homogenization technique (MacKay & Lakhtakia Reference MacKay and Lakhtakia2015; Bairaktaris et al. Reference Bairaktaris, Papagiannis, Tsironis, Kokkorakis, Hizanidis, Chellais, Alberti, Furno and Ram2017), where it is assumed that there is some distribution of filamentary structures of random sizes and densities. Alternatively, many different representations of density fluctuations are implemented in the literature.
Williams et al. (Reference Williams, Köhn, O'Brien and Vann2014) developed a full-wave finite-difference time-domain (FDTD) code, for isotropic media, and studied the three-dimensional (3-D) propagation of a Gaussian beam. However their scattering results were limited to a simplified cylindrical filament geometry and under the assumption that the density spatial distribution was two-dimensional (2-D) Gaussian. Kohn et al. (Reference Kohn, Guidi, Holtzhauer, Maj, Snicker and Weber2018) studied the microwave Gaussian beam broadening (BB) as a result of propagation through turbulent density fluctuations. The beam propagation was analysed by use of the wave kinetic equation solver WKBeam, which is valid for a range of parameters such that the Born approximation holds. The density fluctuations used are random as they contain a part generated by a truncated sum of Fourier-like modes with uniformly distributed phases. The solver is used for various density realizations, and the Ensemble-Averaged Electric Field (EAEF) is calculated. The EAEF is assumed to follow a Gaussian or Cauchy distribution. The parameters of these distributions are estimated by fitting the EAEF data, and from these parameters the BB is found. The BB results were also benchmarked to the full-wave code IPF-FDMC. Following similar steps, Snicker et al. (Reference Snicker, Poli, Maj, Guidi, Kohn, Weber, Conway, Henderson and Saibene2018) showed that the Born approximation in the WKBeam code is valid for parameters specific to ITER and that the calculated BB is a quantity of major interest for ITER sized reactors. In addition, their WKBeam results are benchmarked not only to the IPF-FDMC but also to the the paraxial WKB code TORBEAM.
In this work, the effect of periodic density interfaces (plasma gratings) on RF waves is of interest. This is inspired by experimental results that indicate the existence of drift waves and rippling modes in the edge region (Ritz et al. Reference Ritz, Bengtson, Levinson and Powers1984). To understand in detail the effect of such an interface on the scattering of a RF wave, the full-wave code ScaRF (Papadopoulos et al. Reference Papadopoulos, Glytsis, Ram, Valvis, Papagiannis, Hizanidis and Zisis2019) has been developed. ScaRF is a finite-difference frequency-domain (FDFD) (Smith Reference Smith1996) code. The FDFD method solves Maxwell's equations in the frequency domain. It is a method without approximations (full-wave), and thus describes reflection, refraction and diffraction effects. ScaRF is used here for the RF-scattering analysis of a random-profile periodic density interface generated as a superposition of spatial harmonics with random weights such as to resemble the experimentally observed rippling waves reported by Ritz et al. (Reference Ritz, Bengtson, Levinson and Powers1984). The aforementioned homogenized anisotropic permittivity tensor is used to approximate the permittivity in the turbulent region. Both permittivities (incidence and turbulent regions) are approximated by those of cold plasma. To handle these problems, ScaRF uses FDFD formulated for anisotropic media, in conjunction with the total-field scattered-field (TFSF) method for inserting the RF excitation into the computational grid, the perfect matching layer (PML) absorbing boundary condition for absorption of irrelevant boundary reflected waves, and Floquet–Bloch periodic boundary conditions (FBPBC) for the definition of the periodic interface. ScaRF is a 3-D code, and thus can model cases of any magnetic field orientation. In addition, it can consider general density fluctuations and non-periodic interfaces. It is a fact that rippling modes or modulated interfaces in the edge region exist along with random fluctuations, blobs and filaments. ScaRF can analyse any representation of the edge plasma density but we are primarily interested in understanding the ripple density effect on RF waves. This work complements previous studies on random fluctuations, blobs and filaments. Papadopoulos et al. (Reference Papadopoulos, Glytsis, Ram, Valvis, Papagiannis, Hizanidis and Zisis2019) used ScaRF to analyse RF scattering from density cosinusoidally varying (modes) ripples, and a case of RF scattering from random ripples (defined as a superposition of modes with randomly modulated amplitudes) was presented without quantifying it. This work complements the RF scattering analysis from random ripples (Papadopoulos et al. Reference Papadopoulos, Glytsis, Ram, Valvis, Papagiannis, Hizanidis and Zisis2019), by rigorously quantifying the uncertainty of the power reflection coefficient (which is now a random variable and in the following is called reflection for simplicity) by use of the polynomial chaos expansion coupled with Smolyak sparse-grid integration (PCE-SG) method. The main focus of this study is to formulate the PCE method for scattering of random ripples rather than to investigate various scattering scenarios. Therefore, this study is restricted to the single case of Papadopoulos et al. (Reference Papadopoulos, Glytsis, Ram, Valvis, Papagiannis, Hizanidis and Zisis2019).
The structure of the paper is as follows. Initially, taken from the paper by Papadopoulos et al. (Reference Papadopoulos, Glytsis, Ram, Valvis, Papagiannis, Hizanidis and Zisis2019), a brief description of the simulation set-up and the ScaRF code is presented. In particular, in § 2 the geometry of the plasma structure (plasma grating) is presented and the relation of the coordinate system for microwave diffraction analysis with the magnetic field and plasma coordinate systems in the torus is explained. Next the anisotropic permittivity tensors for cold plasma in the interface regions are derived (Stix Reference Stix1992). A summary of the ScaRF code follows. In § 3, the PCE method in conjunction with the Smolyak grid multi-dimensional integration is presented, along with useful statistical quantities derived from it. In § 4, the PCE-SG numerical results are shown and discussed for a random periodic (of multiple spatial frequencies) plasma grating for the O-incident RF-mode (Papadopoulos et al. Reference Papadopoulos, Glytsis, Ram, Valvis, Papagiannis, Hizanidis and Zisis2019). The results are also compared with those obtained from the standard but very computational demanding Monte Carlo (MC) method for uncertainty quantification (UQ) (Crestaux, Le Maitre & Martinez Reference Crestaux, Le Maitre and Martinez2009), and the efficiency and accuracy of PCE-SG is verified. In addition, predictions are made for the maximum energy transmission of the incident RF wave into the fusion plasma, which can provide guidance to experimentalists on an appropriate choice of antenna phasing and spectrum. Finally in § 5, the conclusions and main results are presented.
2. Scattering geometry and ScaRF code
The coordinate system ScaRF code is based on the toroidal plasma configuration of figure 1, where two separate coordinate systems (CSs) are present relative to the toroidal plasma configuration. The $(x_B, y_B, z_B)$ CS corresponds to the magnetic flux density CS where the $z_B$
 direction corresponds to the direction of the magnetic field. The $(x_p, y_p, z_p)$
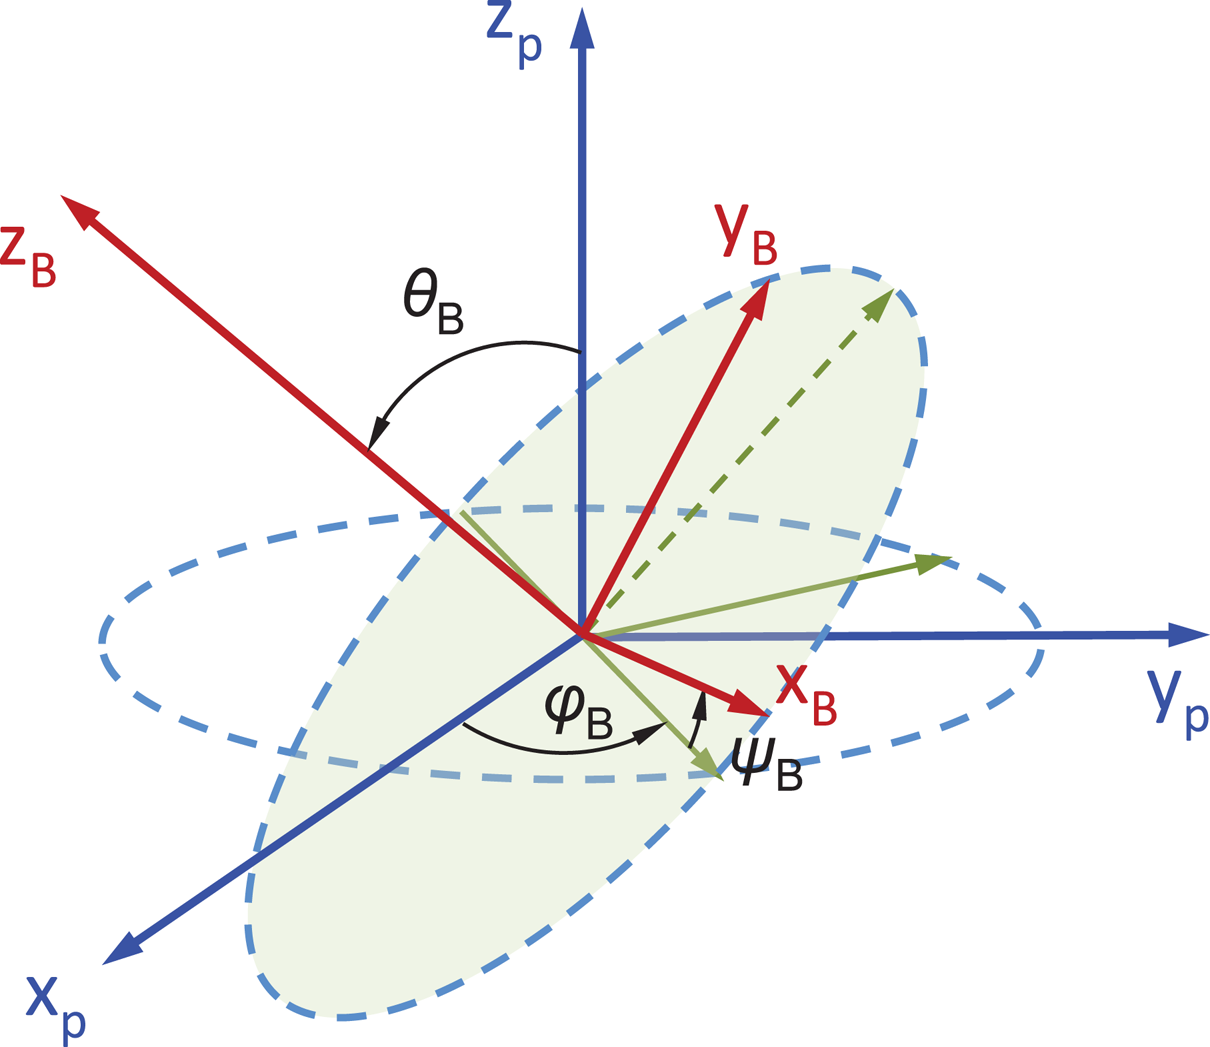
 CS corresponds to the plasma coordinate system. The magnetic flux density can have a poloidal and toroidal component therefore the two CSs can be related via Euler-rotation angles, as shown in figure 2. Following the work of Stix (Reference Stix1992)), the relative permittivity of the cold plasma is given by the following equation in the $(x_B, y_B, z_B)$
 CS:
CS:

where the $S$ , $D$
, $D$ , $P$
, $P$ parameters are defined as

The variables in the above equations are: the magnitude of the electron charge $q_e$ , the electron rest mass $m_e$
 , the atomic number $Z$
 , the atomic mass number $A$
 , the proton rest mass $m_p$
 , the permittivity of free space $\varepsilon _0$
 , the frequency of the electromagnetic radiation $\omega = 2{\rm \pi} f$
 (where $f$
 is the frequency in Hz), the electron and ion plasma densities $n_e$
 and $n_i$
 , respectively (in $\textrm {m}^{-3}$
 ), and the electron and ion collision rate $\nu _{\textrm {col}}$
 . The frequencies $\omega _{\textrm {pe}}$
 and $\omega _{\textrm {pi}}$
 are the electron and ion plasma resonant frequencies and $\omega _{\textrm {ce}}$
 and $\omega _{\textrm {ci}}$
 are the electron and ion cyclotron frequencies, respectively. In this work $\omega _{\textrm {ce}}=7.915\times 10^{11}\ \textrm {rad}\ \textrm {s}^{-1}$
 and $\omega _{\textrm {ci}}=2.155\times 10^{8}\ \textrm {rad}\ \textrm {s}^{-1}$
 . Collisional absorption is absent in the current model, but can be easily included by changing the relative permittivity tensor in (2.1) accordingly. The relative permittivity tensor of (2.1) can be expressed in the plasma CS $(x_p, y_p, z_p)$
 by use of the transformation:

where ${\boldsymbol{\tilde {\boldsymbol \varepsilon }}}_B$ is defined in (2.1) and $\boldsymbol{\tilde {{\boldsymbol{\mathsf{M}}}}}$
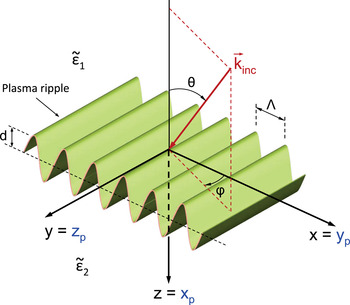
 is the Euler-angle transformation matrix. If a ripple is present at the torus–plasma surface, diffraction of the incident microwave radiation could occur. To study this effect, a periodic ripple at the plasma torus surface is considered. Its geometry is shown in figure 3, where the ripple has been defined as
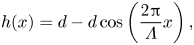
where $h(x)$ is the cosinusoidally varying ripple height, $d$
 is the ripple amplitude and $\varLambda$
 the spatial period of the ripple (spatial mode).
A tokamak plasma torus is shown with the corresponding coordinate systems of interest. The coordinate system $(x_B, y_B, z_B)$ corresponds to the magnetic flux density, $\boldsymbol {B}$
 , coordinate system while $(x_p, y_p, z_p)$
 corresponds to the plasma coordinate system. The $z_p$
 -component of the magnetic flux density corresponds to the toroidal magnetic flux density component, $B_{\textrm {tor}}$
 , while the $x_py_p$
 -component corresponds to the poloidal magnetic flux density component, $B_{\textrm {pol}}$
 (Papadopoulos et al. Reference Papadopoulos, Glytsis, Ram, Valvis, Papagiannis, Hizanidis and Zisis2019).

The relation between the $(x_B, y_B, z_B)$ and the $(x_p, y_p, z_p)$
 coordinate systems. The angles $\varphi _B$
 , $\theta _B$
 and $\psi _B$
 are the Euler angles that connect the two coordinate systems. All the angles are defined positive as counter-clockwise (Papadopoulos et al. Reference Papadopoulos, Glytsis, Ram, Valvis, Papagiannis, Hizanidis and Zisis2019).
A plasma ripple at the torus boundary is considered as a periodic spatial modulation, i.e. as a plasma grating. The microwave radiation is represented as a plane wave incident from the top towards the bottom region. The incident wavevector is shown as ${\boldsymbol {k}}_{\textrm {inc}}$ and the incident angles are defined as $\phi$
 and $\theta$
 . The scattering CS $(x,y,z)$
 is related to the plasma CS by $x=y_p$
 , $y=z_p$
 and $z=x_p$
 , as shown in the figure. The plasma relative permittivities of the top and of the bottom regions are defined as ${\boldsymbol{\tilde {\boldsymbol \varepsilon }}}_1$
 and ${\boldsymbol{\tilde {\boldsymbol \varepsilon }}}_2$
 , respectively. The plasma grating is assumed to have a sinusoidal profile of periodicity $\varLambda$
 along the $x$
 direction, and an amplitude spatial variation of $d$
 (Papadopoulos et al. Reference Papadopoulos, Glytsis, Ram, Valvis, Papagiannis, Hizanidis and Zisis2019).
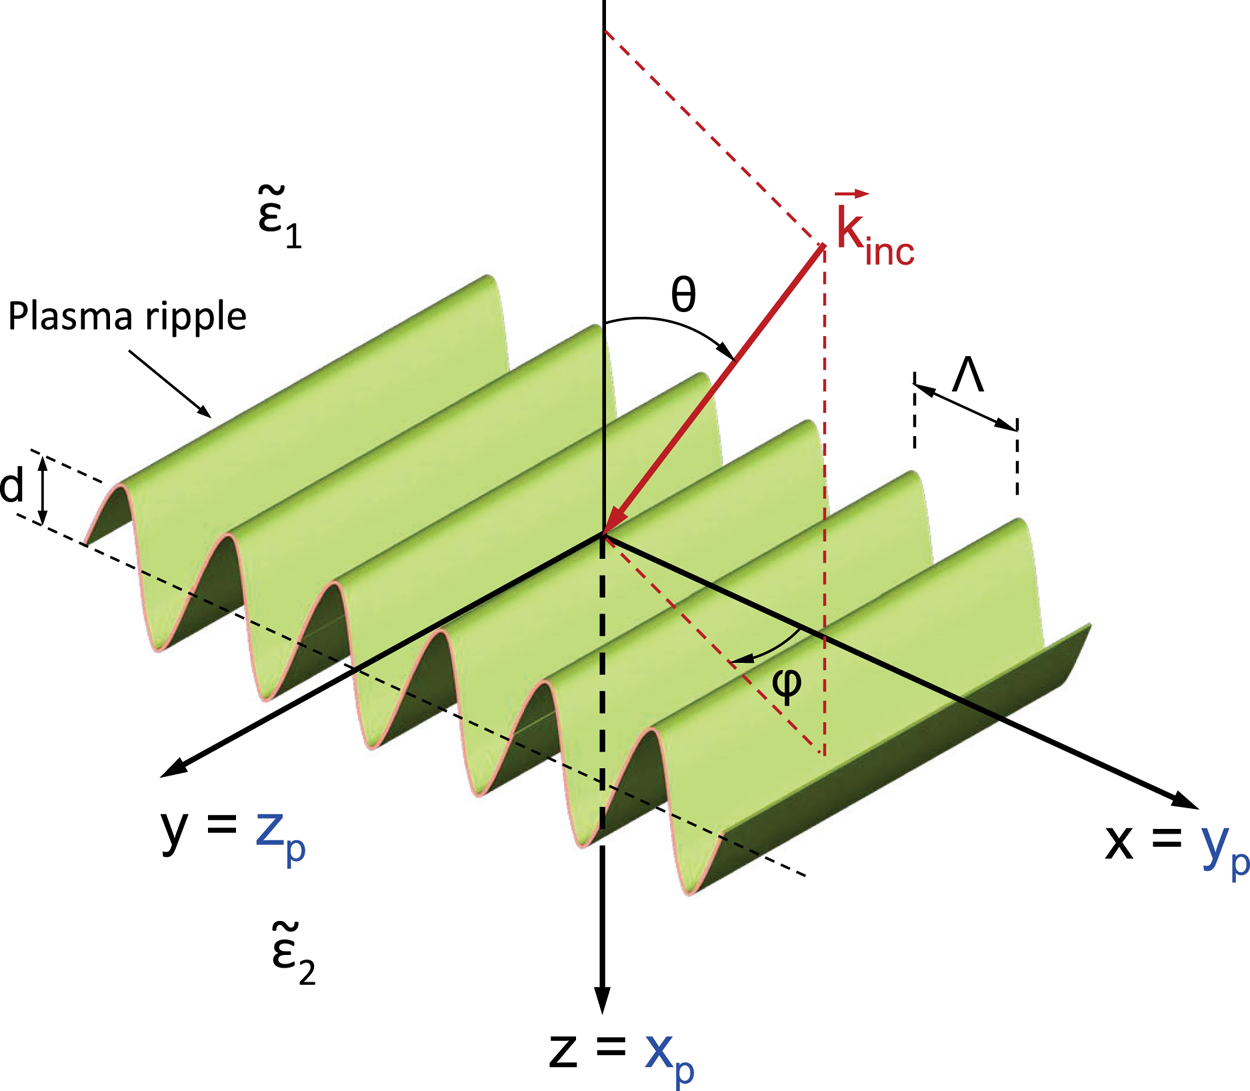
The incident microwave excitation is considered to be a plane wave with an azimuthal angle of incidence $\phi$ and a polar angle of incidence $\theta$
 (figure 3). The regions above and below the periodic interface are plasma regions of different plasma densities. Their tensor relative permittivities ${\boldsymbol{\tilde{\boldsymbol \varepsilon}}}_{l,p}$
 can be determined by suitable use of (2.3) in the plasma CS. Then the relative permittivities ${\boldsymbol{\tilde {\boldsymbol \varepsilon }}}_1$
 and ${\boldsymbol{\tilde {\boldsymbol \varepsilon }}}_2$
 needed for the diffraction analysis in the $(x,y,z)$
 CS can be found from

where $\boldsymbol{\tilde{ {\boldsymbol{\mathsf{Q}}}}}$ is the transformation matrix from the plasma CS $(x_p, y_p, z_p)$
 to the $(x,y,z)$
 CS of the ScaRF code. The FDFD method in ScaRF is used in the analysis of the plasma grating in figure 3, with FBPBC in the $xy$
 plane and PML in the $xy$
 planes parallel to the $z$
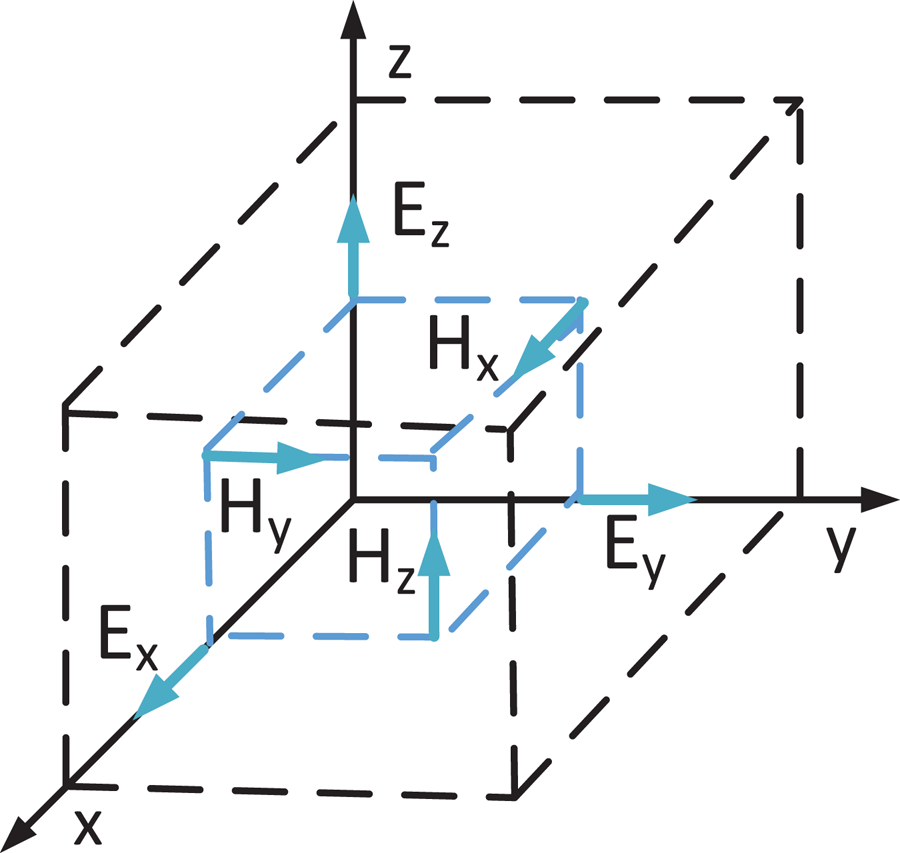
 axis. The FDFD method solves Maxwell's equations in the frequency domain. It is a stable and rigorous method of well-known error sources (Smith Reference Smith1996; Sadiku Reference Sadiku2001; Taflove & Hagness Reference Taflove and Hagness2005), it can model systems of complex geometry and can run in parallel for computationally intensive problems. In the FDFD method, electric and magnetic fields are staggered in space according to the Yee grid (figure 4) and finite differences are used to approximate Maxwell's equations. This results in a large linear algebraic system whose solution provides the electromagnetic fields in space. In particular, after normalization of the magnetic field according to $\boldsymbol {\tilde {H}} \equiv -\textrm {i}Z_{0}\boldsymbol {H}$
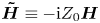 , where $Z_{0}$
 is the free space impedance and $i$
 is $\sqrt {-1}$
 , Maxwell's equations with the wave-absorbing PML layer truncating the computational grid become:


where $[\boldsymbol{ \tilde {\varepsilon }} ] \equiv {\boldsymbol{\mathsf{J}}} [\boldsymbol{ \varepsilon} ] {\boldsymbol{\mathsf{J}}}^{T}/{\mbox {det} ({\boldsymbol{\mathsf{J}}})}$ and $[\boldsymbol{ \tilde {\mu }} ] \equiv {\boldsymbol{\mathsf{J}}}[ \boldsymbol{\mu} ] {\boldsymbol{\mathsf{J}}}^{T}/{\mbox {det} ({\boldsymbol{\mathsf{J}}})}$
 are relative permittivity and permeability tensors, defined so as to implement the PML for anisotropic media (Oskooi & Johnson Reference Oskooi and Johnson2011), where $\boldsymbol{\boldsymbol{\mathsf{J}}}\equiv \mbox {diag}(s_{x}^{-1},s_{y}^{-1},s_{z}^{-1})$
 and $s_{w}\equiv \kappa _{w}+\textrm {i}({\sigma _{w}}/{\omega })$
 , $w=\{x,y,z\}$
 are the PML stretching factors with $\kappa _{w}\geqslant 1$
 as the evanescent wave absorption parameter and $\sigma _{w}$
 as the PML conductivity. The parameters of the stretching factors are polynomials (Oskooi & Johnson Reference Oskooi and Johnson2011) spatially varying along the $w$
 direction. It is numerically convenient to simplify Maxwell's equations (2.6)–(2.7) by normalization of the grid coordinates as $\tilde {w}=k_{0}w$
 , $w=\{x,y,z\}$
 , which leads to


In ScaRF, the discretization of (2.8)–(2.13) is applied by the approximation of the spatial derivatives by staggered central differences (Papadopoulos et al. Reference Papadopoulos, Glytsis, Ram, Valvis, Papagiannis, Hizanidis and Zisis2019). Then the electric and magnetic fields can be obtained everywhere in the computational domain by solving the linear system $\boldsymbol{\tilde{\boldsymbol{\mathsf{A}}}}[ \boldsymbol {e}, \boldsymbol {\tilde {h}} ]^{\textrm {T}}=\boldsymbol {b}$ , where $\boldsymbol {e} \equiv [ \boldsymbol{e_{x}},\boldsymbol{e_{y}},\boldsymbol{e_{x}}]^{\textrm {T}}$
 , $\boldsymbol {\tilde {h}} \equiv [ \boldsymbol{\tilde {h}_{x}},\boldsymbol{\tilde {h}_{y}},\boldsymbol{\tilde {h}_{x}}]^{\textrm {T}}$
 and the right-hand side $\boldsymbol {b}$
 is specified from the plane-wave incident source by use of the total field/scattered field (TFSF) technique (Papadopoulos et al. Reference Papadopoulos, Glytsis, Ram, Valvis, Papagiannis, Hizanidis and Zisis2019). The incident source field must satisfy the dispersion and polarization of waves in the cold plasma medium and is analytically described by Papadopoulos et al. (Reference Papadopoulos, Glytsis, Ram, Valvis, Papagiannis, Hizanidis and Zisis2019). It is noted that similarly, the right-hand side $\boldsymbol {b}$
 can by defined from a superposition of plane waves with amplitudes specified from spectral analysis to represent a spatially localized incident beam.
Three-dimensional Yee cell and electric and magnetic fields staggered in space by half a cell. Electric field components are staggered along their direction, while magnetic field components are staggered perpendicular to their direction (Papadopoulos et al. Reference Papadopoulos, Glytsis, Ram, Valvis, Papagiannis, Hizanidis and Zisis2019).
3. PCE method
Uncertainty Quantification (UQ) quantifies the impact of a system's (the ScaRF code in this work) uncertain input to the system's output quantities of interest (QoI). The PCE method is among the most popular probabilistic UQ methods.
In PCE it is assumed that the ScaRF's input uncertainty is specified by a $d$ -dimensional vector $\boldsymbol{\varXi }=(\varXi _{1}, \varXi _{2},\ldots , \varXi _{d} )$
 with $\varXi _{i}$
 , $i=1,\ldots , d$
 independent identically distributed variables and realizations $\boldsymbol {\xi }=( \xi _{1}, \xi _{2},\ldots , \xi _{d} )$
 . Then the joint probability density function (j.p.d.f.) is $f( \boldsymbol {\xi })=\prod _{k=1}^{d}f(\xi _{k} )$
 , where $f( \xi _{k})$
 is the p.d.f. of $\varXi _{k}$
 . If the QoI $y( \boldsymbol{\varXi} )$
 is a scalar with finite variance, $y(\boldsymbol{\varXi})$
 can be expanded (PCE method) as

where $\varPsi _{j}(\boldsymbol{\varXi })$ are multivariate polynomials that are orthogonal with $f( \boldsymbol {\xi } )$
 weights, and $c_{j}$
 are PCE deterministic coefficients that will be estimated.
In reality the summation in (3.1) is truncated to the first $P+1$ terms:

where $\epsilon ( \boldsymbol{\varXi })$ is the truncation error of the PCE. The construction of the multi-dimensional polynomial basis function $\varPsi _{j}( \boldsymbol{\varXi } )$
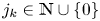
 is based on the Askey (Xiu & Karniadakis (Reference Xiu and Karniadakis2002)) scheme, which is suitable for general non-Gaussian random inputs. In particular if $\psi _{j_{k}}(\varXi _{k} )$
 specify a complete basis set of single variable polynomials of order $j_{k}$
 , where $j_{k} \in \mathbb {N} \cup \{ 0\}$
 and are orthonormal with respect to the p.d.f. $f ( \xi _{k})$
 , the multi-dimensional basis functions are

where ${j}=(j_{1},\ldots ,j_{d} )$ specifies the order of $\varPsi _{{j}}( \boldsymbol{\varXi } )$
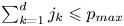
 . If the maximum total order of $\varPsi _{{j}}( \boldsymbol{\varXi } )$
 is $p_{max}$
 ($\sum _{k=1}^{d}j_{k}\leqslant p_{max}$
 ), the number $P$
 of basis functions in the truncated PCE expansion (3.2) is

If $y$ has finite variance then as $p_{max}$
 or $P$
 tend to infinity, the PCE in (3.2) is convergent (in the mean-square sense). In addition, if the univariate polynomial basis is chosen based on the Askey scheme, the error term in (3.2) tends to zero exponentially fast (Xiu & Karniadakis Reference Xiu and Karniadakis2002). The PCE coefficients $c_{j}$
 are computed by projecting the QoI into the corresponding PCE basis:

In reality, (3.5) is inefficient to apply and so other methods have been developed. These fall into two categories, intrusive and non-intrusive methods. In intrusive methods, the deterministic solvers that relate the system output and input are modified, which can be problematic (Crestaux et al. Reference Crestaux, Le Maitre and Martinez2009). In non-intrusive methods, the deterministic solvers are considered as a black box that provides QoI samples from particular system input samples. In this work, the PCE coefficients are determined using a non-intrusive method based on the Smolyak sparse-grid integration.
3.1. PCE coefficients calculation
The expansion coefficients in (3.2) can be calculated by use of the orthogonality of the basis functions. In particular, the projection of $y$ on each basis function leads to

In (3.6), the numerical calculation of $P+1$ integrals in the numerators need to be performed (the denominators are computed analytically). For this task, the Smolyak sparse-grid integration method is used, because it is more efficient than the full-grid integration techniques, as long as sufficiently smooth quantities are integrated (Crestaux et al. Reference Crestaux, Le Maitre and Martinez2009). The improved performance arises from the fact that sparse grids exhibit similar accuracy levels to full-grid integration with fewer nodes. Therefore, the number of deterministic simulations that are performed is reduced. The function values used in the Smolyak algorithm are located on nodal points of grids given by

where $\varTheta _{1}^{i} = \{\theta _{1}^{i},\theta _{2}^{i},\ldots ,\theta _{m_{i}}^{i} \}$ represent one-dimensional (1-D) sets of $m_{i}$
 nodes, $\mathbb {N}_{q}^{d}=\{\boldsymbol {i} \in \mathbb {N}^{d}:\sum _{l=1}^{d}i_{l}=d+q \}$
 and $m$
 is the accuracy order of the $d$
 -dimensional quadrature. Actually, the sparse grid is built by combining selected smaller grids that satisfy specific rules. For example, a 2-D sparse grid with accuracy order equal to $3$
 is built by considering the $\varTheta _{1}^{2} \times \varTheta _{1}^{1}$
 , $\varTheta _{1}^{1} \times \varTheta _{1}^{2}$
 , $\varTheta _{1}^{2} \times \varTheta _{1}^{2}$
 , $\varTheta _{1}^{3} \times \varTheta _{1}^{1}$
 and $\varTheta _{1}^{1} \times \varTheta _{1}^{3}$
 grids, and normally includes fewer nodes than the $\varTheta _{1}^{3} \times \varTheta _{1}^{3}$
 full grid. After the sparse grid has been defined, the required integrations in (3.6) are calculated by

where the terms $V^{i}[ y\varPsi _{k} ]$ represent the 1-D quadrature. In the case that $y\varPsi _{k}$
 is a polynomial of order $2m-1$
 or less, then (3.8) is exact.
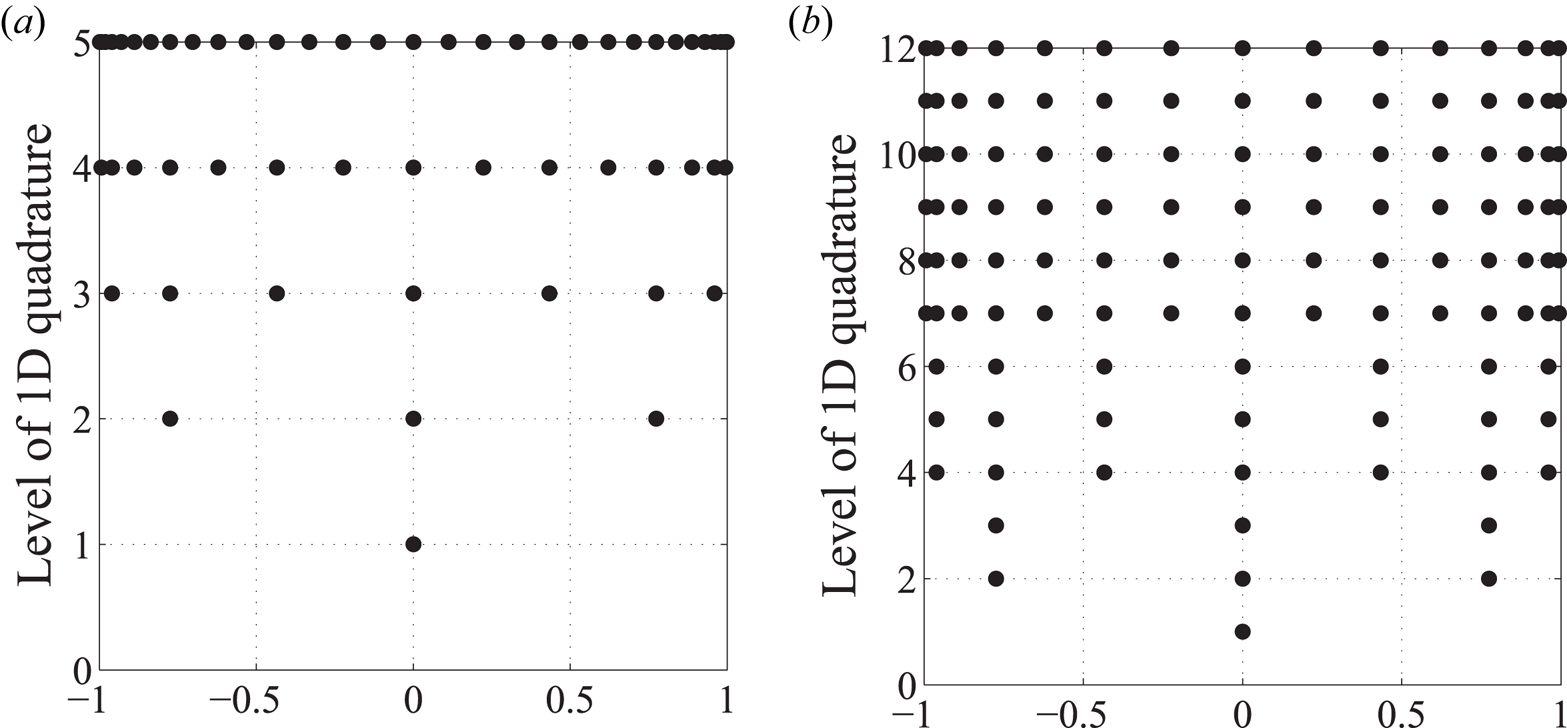
In this work, the nested Kronrod–Patterson (KP) nodal sets (Petras Reference Petras2003) are used for the construction of the various $\varTheta _1$ . These sets are nested, which means that lower-level nodes comprise subsets of higher-level sequences and thus a significant number of re-calculations are avoided when higher level sets are constructed. The number of nodes in a 1-D KP sequence increases at a fast rate, according to

Therefore, even in the Smolyak algorithm case (3.8), the number of nodes in multidimensional grids grows at an unnecessarily fast rate. To handle this issue, delayed KP sequences are applied (Petras Reference Petras2003) in a way that formulae are reused for some levels before being updated, such that the growth in the number of nodes is under control. In figure 5, the differences between ordinary and delayed KP sequences are shown. In addition, full and sparse 2-D grids are compared in figure 6, where the cases of tensor-based grids, sparse grids with normal KP sequences and sparse grids with delayed KP sequences are examined by considering various construction levels. It is observed that after a few iterations, a tensor grid contains more than $900$ tensor grid nodes. The Smolyak grid with normal KP nodes comprises 129 nodes in the same construction level, while this number reduces to just $33$
 nodes for the case where the Smolyak algorithm is applied for delayed sequences.
One-dimensional quadrature nodal distributions corresponding to different accuracy levels. Cases of (a) ordinary and (b) delayed KP sequences are shown (Papadopoulos et al. Reference Papadopoulos, Zygiridis, Glytsis, Kantartzis and Tsiboukis2018).
Comparison of various grids (full grids, normal sparse grids and sparse grids with delayed 1-D sequences) for different accuracy levels (Papadopoulos et al. Reference Papadopoulos, Zygiridis, Glytsis, Kantartzis and Tsiboukis2018).

3.2. Calculation of statistics
The knowledge of the PC expansion coefficients allows the direct computation of the statistical moments of the QoI. The mean value and the standard deviation of $y$ are calculated by


In addition, as will be explained later, sensitivity indices can be easily obtained by the PC coefficients.
3.3. Estimation of the reflection probability density function
Once the PCE coefficients have been calculated, the random output of the system is approximated by the PCE expansion. This easily provides a large enough number of output reflection samples such that a histogram can be built. This is an approximation to the p.d.f. of the reflection. Because a histogram is usually non-smooth, a kernel smoothing method is applied for better visualization of the p.d.f. In particular, the p.d.f. is approximated by

where $K(x )$ is a positive-definite function (the kernel) and $h_{K}$
 is the bandwidth parameter. A Gaussian kernel (standard normal p.d.f.) and an optimum bandwidth $h_{K}^{\ast }$
 (for the Gaussian kernel) is chosen as

where $\hat {\sigma }_{R}$ and $\hat {iqr}_{R}$
 are the empirical standard deviation and interquartile, respectively. Here, $\hat {\sigma }_{R}$
 is optimal in the sense that it minimizes the $\ell ^{2}$
 approximation error $\| \,f_{R}-\hat {f}_{R} \|_{2}$
 .
.
3.4. Sensitivity analysis
To quantify the effect of each random input variable $\xi$ (the random amplitude of each mode) the Total Sobol sensitivity indices ($ST_{\xi }$
 ) are calculated (Crestaux et al. Reference Crestaux, Le Maitre and Martinez2009). The $ST_{\xi }$
 , $\xi \in \{\varLambda ,d_1,d_2,f,\theta \}$
 are directly computed from the PC expansion coefficients as


where $u \subseteq \{1,2,\ldots ,d \}$ . The total Sobol index fpr each random input variable specifies the percentage contribution of the random variable to the variance of the reflection.
3.5. Percentile calculation
Another useful statistical quantity is the $P$ th percentile $\left( 0\leqslant P\leqslant 100 \right)$
 , of the reflection. If the $P$
 th percentile is $R_{P}$
 , it means that $P\%$
 of the observations $R$
 are smaller than $R_{P}$
 . The percentiles are directly obtained from the PCE method. Once the PCE coefficients $c_{k}$
 in (3.6) have been calculated, a sufficiently large number, $N$
 , of reflection observations can be generated analytically (and thus with insignificant computational cost) directly from the PCE expansion (3.1). Then the $P$
 th percentile, $R_{P}$
 , of $R$
 can be calculated by the nearest-rank method. In this method, the reflection samples $R_{i}$
 , $i=1,\ldots ,N$
 , are sorted in ascending order, which creates a set of sorted reflection observations, $R_{s,i}$
 , $i=1,\ldots ,N$
 . Then $R_{P}=R_{s,n}$
 , where $n=\lceil PN/100 \rceil$
 .
.
4. Numerical results
The ScaRF code, in conjunction with the PCE method described in § 3, is used for the scattering analysis of an incident $O$ -mode at 170 GHz (electron cyclotron (EC) frequency range) by a random periodic interface separating blob–background anisotropic media. The interface is a superposition of $5$
 spatial sinusoidal modes of wavelengths $c=[0.25, 0.5, 1, 2.5, 5]\lambda _{0}$
 and random amplitudes $\xi _{i}$
 , $i=\{1,\ldots , 5\}$
 , with a $5\,\%$
 variation around $\xi _{i}=1$
 . The toroidal, $H_{t}$
 , and poloidal, $H_{p}$
 , magnetic fields are $4.5T$
 and $0.473T$
 respectively. The incident wave has a polar angle $\phi =174^{\circ }$
 and experiments are performed for samples of azimuthal angles ${\pm }10\,\%$
 around $\theta =30^{\circ }$
 . For the $O$
 -mode, the normalized wavevector components are $\beta _{x}=0.3496$
 , $\beta _{y}=0.2007$
 , $\beta _{z}=-0.0211$
 , the background and blob densities are $3 \times 10^{20}\ \textrm {m}^{-3}$
 , $3.2 \times 10^{20}\ \textrm {m}^{-3}$
 , respectively, and the relative permittivity tensors, (2.1), are calculated via (2.2).
The use of ScaRF allows for the computation of the electric and magnetic field vectors $\boldsymbol {e}$ , $\boldsymbol {h}$
 at every node of the computational domain, where $\boldsymbol {h}=\textrm {i}Z_{0}^{-1}\boldsymbol {\tilde {h}}$
 and therefore the time-averaged Poynting vector, $\boldsymbol {S}$
 is computed by

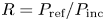
Because $\boldsymbol{S}$ is known everywhere in the computational domain, the power reflection $R$
 , defined as $R=P_{\textrm {ref}}/P_{\textrm {inc}}$
 , can be calculated simply by numerically integrating $\boldsymbol{S}$
 in the $y$
 direction, which provides the incident and reflected power $P_{\textrm {inc}}$
 , $P_{\textrm {ref}}$
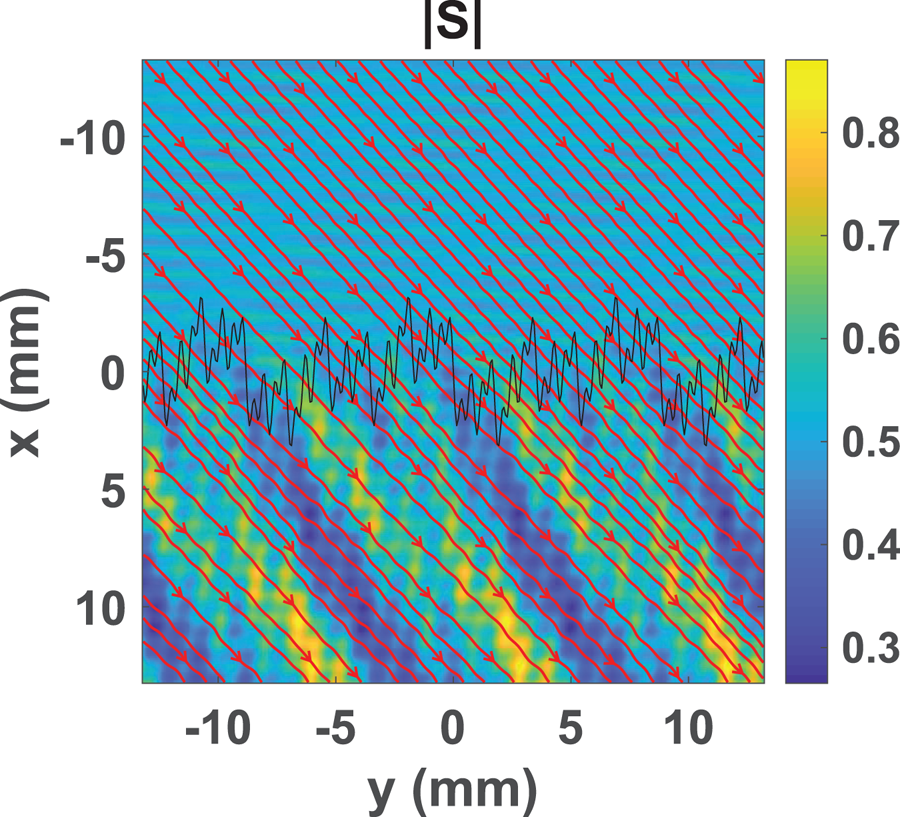
 , respectively. For visualization purposes, in figure 7, the amplitude of the Poynting vector $\boldsymbol{S}$
 and the $\boldsymbol{S}$
 -flow are shown for an incident $O$
 -mode at $\theta =30^{\circ }$
 , scattered by a realization of the random density interface.
Amplitude of the Poynting vector ($|\boldsymbol{S}|$ ) and $\boldsymbol{S}$
 -flow (red lines: ($S_{x}, S_{y}$
 ) vector) for a plane wave ($O$
 -mode) incident on a realization of a 5-mode interface (black line) with random amplitudes.
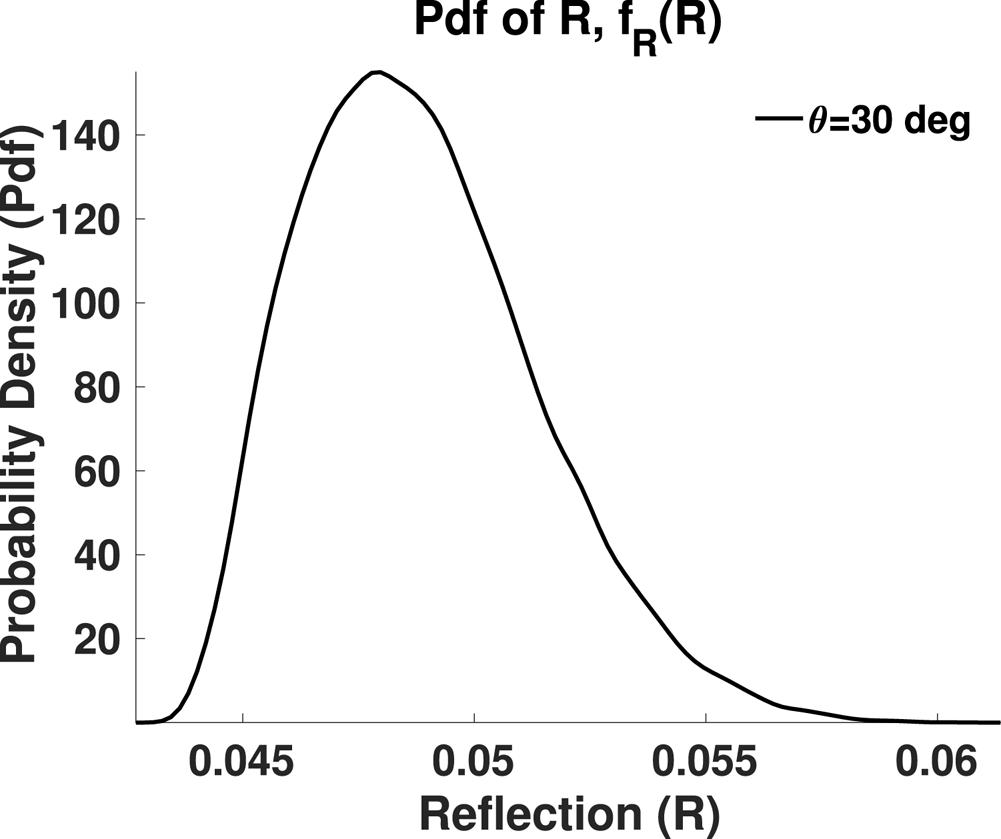
In figure 8, the mean value ($MV$ ) and standard deviation ($Std$
 ) of $R$
 are presented as a function of $\theta$
 , calculated by the PCE-SG and MC methods. For the PCE-SG and MC methods, 51 and 1000 samples of $R$
 were produced by the use of ScaRF, respectively. Therefore the MC method is orders of magnitude more computationally demanding than the PCE-SG method. However, it is observed in figure 8 that the $MV$
 and $Std$
 values of $R$
 are in good agreement, which verifies the accuracy and computational efficiency of the PCE-SG method. The PCE-SG method was used for the maximum polynomial order $p_{\max }=2$
 and an accuracy level of the Smolyak grid $m=3$
 . It is practical and desirable to achieve a minimum value of $R$
 so that the maximum power of the incident RF wave will be transmitted into the fusion plasma region. In figure 8, it is concluded that the minimum $MV$
 of $R, R\approx 0.04$
 , occurs at $\theta \approx 30.5^{\circ }$
 .
.
Mean Value ($MV$ ) and Standard Deviation ($Std$
 ) of reflection as a function of the angle of incidence ($\theta$
 ) of the incident wave: (a) calculated by the PCE method; and (b) calculated by the MC method.

The p.d.f. of $R$ is shown in figure 9. It is observed that the maximum of the p.d.f. for $\theta =30.5$
 is at $R \approx 0.047$
 , which, on average, occurs in figure 8 for $\theta \approx 30.5^{\circ }$
 as expected.
P.d.f. of reflection for $\theta = 30^{\circ }$ .
.
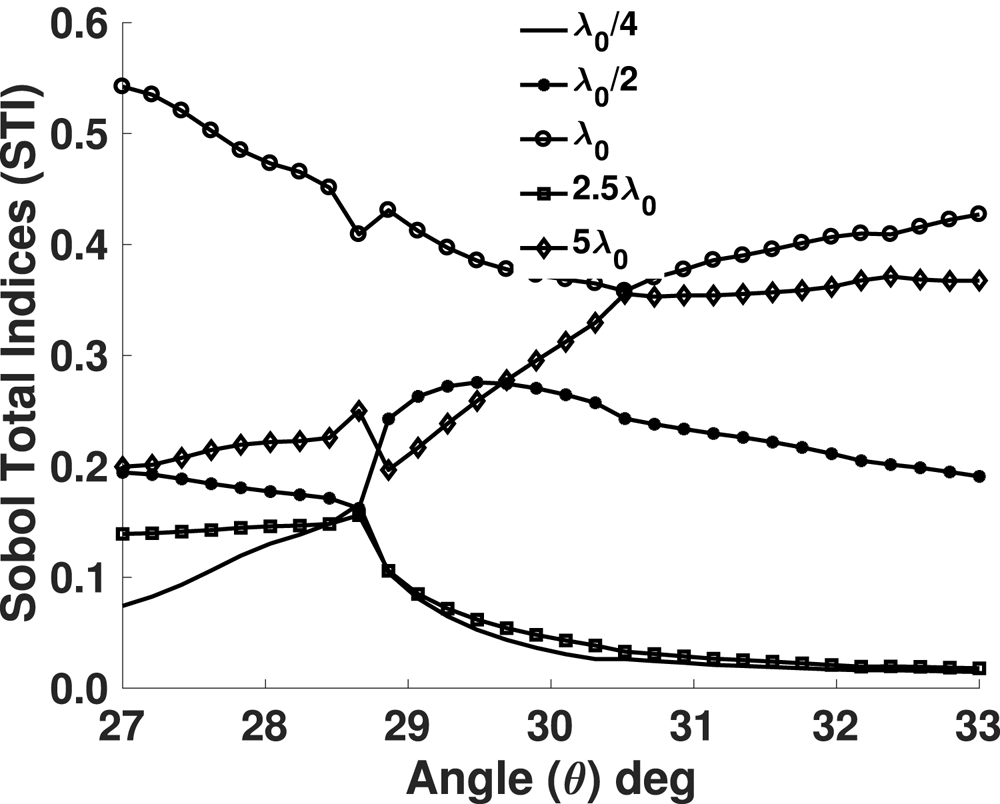
In figure 10, the Sobol total indices (STI) versus $\theta$ are presented for the five $\xi _{i}$
 random variables. The $R$
 is more sensitive to the $\xi _{i}$
 with the highest STI. From this figure it is concluded that the spatial modes $\lambda _{0}$
 and $\lambda _{0}/4$
 have respectively the highest and lowest contribution to the variance of $R$
 , for all angles $\theta$
 of the incident RF wave. For the angle $\theta \approx 30.5$
 , which is of practical interest, the $\lambda _{0}$
 , $5 \lambda _{0}$
 spatial modes have the same contribution to the $R$
 variance, the $2.5 \lambda _{0}$
 , $\lambda _{0} /4$
 spatial modes have the lowest contribution to the $R$
 variance, while the spatial mode $\lambda _{0} /2$
 is somewhere in between.
Sobol Total Indices for the 5 random amplitudes of the spatial modes ($\lambda _{0}/4, \lambda _{0}/2, \lambda _{0}, 2.5\lambda _{0}, 5\lambda _{0}$ ) that define the density interface.
Finally in figure 11 the 5th and 95th percentiles for the reflection, $R$ , are shown. They were calculated by the PCE-SG method, as described in § 3.5, where $N=20\,000$
 random reflection samples were used. An interesting observation in this figure is that the desirable minimum reflection $R \approx 0.04$
 occurs at $\theta \approx 30.25^{\circ }$
 and is a point closer to the $5\,\%$
 curve, which means that only roughly $5\,\%$
 of the $R$
 samples will have reflection smaller than 0.04. Therefore with high probability, launching the incident RF wave at $\theta \approx 30.25^{\circ }$
 will result in minimum reflection.
The 5 % and 95 % percentiles calculation as a function of the angle of incidence $\theta$ . Percentiles were calculated by the PCE-SG method using $N=20\,000$
 reflection samples.

It is noted that the computation of an optimal launch angle of the waves provides guidance to the experimentalists on an appropriate choice of antenna phasing and spectrum. The efficient use of RF waves requires that the coupling of the power to the plasma be optimal, so as to minimize reflections arising from turbulence. Becuase it is not completely possible to quantify the turbulent plasma to any reasonable precision (density variation in space and time), one has to develop statistical tools that can quantify the effect of turbulence and help guide the experimentalists simulations that can be tested on present experiments to gain confidence for future experiments and reactors. The emphasis is not that a certain angle for launching the waves is optimal, but rather there exists such a possibility, that is, there exists a launch window which minimizes the reflection. The existing tools theoretically and/or numerically do not answer the questions: in the presence of a large region of turbulent plasma, what is the most likely scenario for ideal delivery of power and momentum to the core plasma, to minimize reflections and side-scattering, and to control the spectrum of waves propagating in the core so as to optimize the current drive and heating efficiency. One of the first approaches to address these questions is the UQ method of this work whose effectiveness is shown in the presented scattering configuration.
5. Conclusions
We have carried out a statistical analysis of the reflection ($R$ ) for a plane wave $O$
 -mode (in the electron cyclotron range of frequencies) incident on a periodic plasma-density interface. The Maxwell's equations are solved for different realizations of the turbulent interface using ScaRF. The mean value, $MV$
 , and the standard deviation, $Std$
 , of $R$
 are calculated using the PCE-SG method. The PCE-SG method is much more computationally efficient for the statistical analysis of $R$
 than a Monte Carlo method that requires orders of magnitude more $R$
 samples from the ScaRF code.
The PCE-SG method provides additional useful statistical quantities. The Sobol Total Indices were calculated, which quantify the contribution to the variance of $R$ of each random design variable. The p.d.f. of $R$
 was also derived, for a particular angle of incidence of the incident RF wave, and results were in agreement with the calculated $MV$
 and $Std$
 of $R$
 . Finally, the $5\,\%$
 and $95\,\%$
 percentiles of $R$
 were calculated and it was concluded that with high probability, and for an angle of incidence $\theta \approx 30.25^{\circ }$
 , the reflection would be at a minimum, thus allowing most of the energy of the incident wave to be transmitted to the fusion plasma. These results help to guide experimental feedback, which is going to be important for future modifications and research. The present paper gets the ball rolling in that direction, that is, it draws a link between theory, modelling and experiments. This is the basis on which more sophisticated tools (analytical and numerical) can be built to advance insight into wave propagation through turbulent plasma.
In the near future, we will consider higher dimensional uncertainty quantification problems consisting, for example, of uncertain spatially localized incident beams and more complex plasma density interfaces and distributions. These can be treated based on Sparse and Adaptive PCE models (Blatman & Sudret Reference Blatman and Sudret2011)). In addition, the PCE method presented here could work in conjunction with other studies, such as the works of Kohn et al. (Reference Kohn, Guidi, Holtzhauer, Maj, Snicker and Weber2018); Snicker et al. (Reference Snicker, Poli, Maj, Guidi, Kohn, Weber, Conway, Henderson and Saibene2018), where the WKBeam code was used for beam propagation analysis through turbulent plasma media.
Acknowledgements
A.K.R. is supported by the US Department of Energy Grant numbers DE-FG02-91ER- 54109, DE-FG02-99ER-54525-NSTX, and DE-FC02-01ER54648. For all other authors, this work has been carried out within the framework of the EUROfusion Consortium and has received funding from the Euratom research and training programme 2014-2018 and 2019-2020 under grant agreement No 633053. The views and opinions expressed herein do not necessarily reflect those of the European Commission.
Editor Christos Tsironis thanks the referees for their advice in evaluating this article.
Declaration of interest
The authors report no conflict of interest.




 Open access

