


INTRODUCTION
According to many observers, the partisan and ideological divisions polarizing United States politics at the national level are now also manifest in state and local politics. Some even claim that this has created a situation in which voting behavior in local elections is divided along the same partisan divisions as national level voting. Our article provides new empirical evidence regarding this claim.
Scholars have theorized several possible forces driving state and local political divisions to align with national partisan or ideological cleavages. First, polarization among political elites may have created increasingly distinct Democratic and Republican brands associated with distinct ideological positions. Voters rely heavily on party cues, so their choices increasingly mirror their national partisan leanings even when voting at the state and local levels (Hopkins Reference Hopkins2018). Second, the policy agendas of state and local governments may have changed, or voters’ preferences over these agendas might have changed (or both), resulting in state and local political cleavages that align more closely with national partisan and ideological divisions. Third, the relative decline and nationalization of local news media may have reduced voters’ information about state and local politics, leading them to rely even more on partisan or ideological cues.Footnote 1
On the other hand, until recently the conventional wisdom was that local politics was largely disconnected from national politics. One reason is that the routine policy choices facing local governments differ from the main issues that divide the parties at the national level, and often relate more to managerial competence.Footnote 2 Moreover, local governments compete with one another for businesses and residents, constraining what they are able to do, particularly regarding the types of redistributive policies that divide the parties nationally (Tiebout Reference Tiebout1956). Interest group cleavages often differ at the local and national levels, so the cues voters receive from local interest groups may cross-cut the national partisan divisions. Anzia (Reference Anzia2022) renews this argument, studying how chambers of commerce, real estate developers, neighborhood associations, and police and fire labor unions participate in local policymaking.Footnote 3 Finally, voters have firsthand experience with many local government services, unlike most of the activities of the federal government, so they may be less dependent on party cues when voting in local elections.
Voting behavior in nominally partisan offices, that is, contests where a party label appears next to the candidates on a general election ballot, is closely correlated with party identification and the presidential vote, and the correlations have grown in recent years. This is well documented for congressional and gubernatorial races, and several studies find similar correlations for other partisan offices down the ballot. Separately, studies of state and local representation find that policy outcomes chosen by state and local governments are correlated with the partisan or ideological preferences of their constituents.Footnote 4
Most elected offices in the United States are nominally nonpartisan, that is, voters vote on candidates without a party label. About 75% of elected municipal offices and over 90% of school board elections are elected on nonpartisan ballots.Footnote 5 For these offices, the relationship between voters’ choices and partisanship or ideology appears to be weaker and more variable. Voting often seems more related to factors such as race, ethnicity, home ownership, incumbency, specific issues, and even local government performance.Footnote 6 Findings on votes for ballot measures are also mixed. At the state level, vote choice and partisanship or ideology are highly correlated for some hot-button issues, but relatively low for other measures. Partisanship and ideology may play even less of a role in voting on local ballot measures. Instead, studies find significant correlations with factors such as income, education, race, interest group endorsements, and proxies for self-interest.Footnote 7
However, we know little about the broad picture nationwide. Existing studies are based on a small number of elections in a small number of localities, and often study one or two of the six types of state and local contests discussed here: nominally partisan and nonpartisan state level offices, nominally partisan and nonpartisan local offices, statewide ballot measures, and local ballot measures.Footnote 8 There are over 500,000 local officials elected in the US, and many thousands of local ballot measures each election cycle. Even at the state level there are hundreds of nonpartisan races for judges and other offices each election cycle, and 150 or so statewide ballot measures. No studies have estimated the average levels or trends in nationalization for even a small fraction of these. As a result, as Anzia (Reference Anzia2021) argues in her review of the literature, we know little about the structure of voter preferences over local issues, and whether the cleavages among voters on those issues mirror the divisions over national issues.Footnote 9
In this article, we present the most comprehensive study to date of the relationship between a voter’s national partisanship and their voting pattern in state and local elections. We overcome the measurement challenges in previous literature by using cast vote record (CVR) data from the November 2020 general elections. These records capture the anonymous, individual-level ballots of millions of voters, allowing us to directly compare their votes for federal offices—that is, President and Congress—with their votes for state and local offices, such as state legislators, mayors, county commissioners, and sheriffs, as well as for state and local measures on a variety of issues, including taxes, bonds and spending by state and local governments. We have CVR data for 24 states and over 450 counties, with over 2,200 contested nonpartisan contests and nearly 1,850 ballot measures on the ballot at the state, county, municipal, school board, and special district levels.
Only a few existing studies use CVR data to analyze voting in state or local elections. Kuriwaki (Reference Kuriwaki2025) focuses on voting in nominally partisan state and local elections in South Carolina. Alvarez, Hall, and Levin (Reference Alvarez, Hall and Levin2018) analyze CVR data from both partisan and nonpartisan local elections, but limit attention to three offices in Pierce County, Washington, in 2008. Morse (Reference Morse2021) examines the correlation between votes on a 2018 state amendment and governor or U.S. senator in Florida.
Our findings show high levels of presidential party loyalty in state candidate elections with party labels (state partisan offices), slightly weaker levels in local candidate elections with party labels (local partisan offices), and much weaker levels in nonpartisan offices and ballot measures. We summarize our findings by simple comparisons between Democratic and Republican voters. Our main measure, the Absolute Partisan Gap ( $ APG $
) is the absolute percentage-point difference between nationally Democratic and nationally Republican voters (as inferred from their votes for President and Congress) in support for the winning candidate in each down-ballot contest. The
$ APG $
) is the absolute percentage-point difference between nationally Democratic and nationally Republican voters (as inferred from their votes for President and Congress) in support for the winning candidate in each down-ballot contest. The $ APG $
is 100 if national partisans vote exactly according to their national partisanship on the down-ballot contest, and 0 if there is no correlation between voters’ national partisanship and vote choice on the down-ballot contest. The APG is 91 percentage points for the average state partisan office, 85 points for the average local partisan office, but only 22 points for local nonpartisan offices (e.g., school boards and city councils) and 18 points for local ballot measures. In an individual-level regression predicting vote choice in these subnational offices, a voter’s national party allegiance explains nearly 89% of the within-contest variation in vote choices for state partisan office, but less than 8% of the same variation in vote choices for local ballot measures.
$ APG $
is 100 if national partisans vote exactly according to their national partisanship on the down-ballot contest, and 0 if there is no correlation between voters’ national partisanship and vote choice on the down-ballot contest. The APG is 91 percentage points for the average state partisan office, 85 points for the average local partisan office, but only 22 points for local nonpartisan offices (e.g., school boards and city councils) and 18 points for local ballot measures. In an individual-level regression predicting vote choice in these subnational offices, a voter’s national party allegiance explains nearly 89% of the within-contest variation in vote choices for state partisan office, but less than 8% of the same variation in vote choices for local ballot measures.
Some of the most interesting findings appear when we compare across local offices and across local ballot measures. Consider, for example, local nonpartisan offices. Nonpartisan county legislatures have an $ APG $
nearly 10 points higher than school board races, which have an
$ APG $
nearly 10 points higher than school board races, which have an $ APG $
of only 21 points. Within local ballot measures that specifically ask voters to approve local sales taxes or bonds, spending for school or library projects have an
$ APG $
of only 21 points. Within local ballot measures that specifically ask voters to approve local sales taxes or bonds, spending for school or library projects have an $ APG $
of 27 percentage points, but ballot measures for road projects have an
$ APG $
of 27 percentage points, but ballot measures for road projects have an $ APG $
of 14 points. Spending for police is the only type of ballot measure we find in which the direction of voting is reversed: Democrats are less likely to vote yes on the spending than Republicans are. We find some evidence of issue voting on local ballot measures. In particular, we find that the votes on local education spending measures correlate highly with each other, but are less correlated with national partisanship.
$ APG $
of 14 points. Spending for police is the only type of ballot measure we find in which the direction of voting is reversed: Democrats are less likely to vote yes on the spending than Republicans are. We find some evidence of issue voting on local ballot measures. In particular, we find that the votes on local education spending measures correlate highly with each other, but are less correlated with national partisanship.
In short, at the local level, not all politics is nationally partisan. Consider Republicans, that is, voters who cast a straight Republican ticket for all federal offices in 2020, including a vote for Donald Trump. In state partisan races, 3.2% of these voters split their ticket, voting for Democrats for some offices. In local partisan races, 6.8% split their ticket for a Democrat. However, also at the local level, on average 52.6% of the Republicans voted yes on local ballot measures to increase or maintain taxes or spending, or to pass bonds. These differences in voting behavior could reflect factors such as the ideological positions of the candidates and ballot measure proposals, variation in relative candidate qualifications and the salience of these qualifications for voters, local interest group activity, and differences in the way voters perceive the functioning of their local government relative to their state government or the federal government.
DATA AND MEASURES
Traditional sources of data on voting patterns pose a problem for studying voting in local elections. Post-election surveys rarely ask how people voted for mayor, school board, or ballot measures. While aggregate election results can provide estimates of ticket splitting rates by using the difference in presidential and local office vote-shares, these only measure net ticket splitting. Past research using vote-shares has also struggled to standardize precinct results covering all local offices across multiple states. In this study, we turn to CVRs to study patterns of voting behavior.
Cast Vote Record Data
CVRs are electronic records of every choice made on every ballot (Wack Reference Wack2019). They are by-products of voting scanners and tabulators, that scan paper ballots and translate each marked vote into an official vote. Election officials also often use CVRs to conduct post-election audits. CVRs are anonymous. While CVRs are not usually made public following an election, officials sometimes release them voluntarily to promote the transparency of their administration, and more commonly release them in response to public records requests. As noted above, CVR data have been used in previous studies of voting behavior (Bafumi et al. Reference Bafumi, Herron, Hill and Lewis2012; Frisina et al. Reference Frisina, Herron, Honaker and Lewis2008; Gerber and Lewis Reference Gerber and Lewis2004; Herron and Lewis Reference Herron and Lewis2007; Herron and Sekhon Reference Herron and Sekhon2003; Kuriwaki Reference Kuriwaki2025; Lewis Reference Lewis2001; Morse Reference Morse2021; Wand et al. Reference Wand, Shotts, Sekhon and Mebane2001). CVRs are unique in the ability to measure the joint relationships between different contests exactly, avoiding the limitations of aggregated election returns and surveys (Kuriwaki et al. Reference Kuriwaki, Reece, Baltz, Conevska, Loffredo, Samarth and Mutlu2024).
Until recently, CVRs covering large portions of the US were not available for academic research. After the 2020 election, a group of election skeptics, data scientists, and other interested parties engaged in a large-scale, crowd-sourced effort to collect CVR data from county officials, often flooding them with public records requests.Footnote 10 We use the CVR database that resulted from this activity, which Kuriwaki et al. (Reference Kuriwaki, Reece, Baltz, Conevska, Loffredo, Samarth and Mutlu2024) describe in detail. We build on the data in Kuriwaki et al. (Reference Kuriwaki, Reece, Baltz, Conevska, Loffredo, Samarth and Mutlu2024) with records collected or cleaned later, and we also include cases where the CVRs cover only a part of a county.
Our initial data includes over 50 million voters. Our entire dataset covers 24 states and 480 counties. In this sample, Biden’s share of the two-party vote is 56.2%, which is 4 percentage points more than his vote-share nationwide. Thus, our subset is slightly more Democratic than the nation as a whole. Administered during the pandemic, this election featured roughly 43% of the national electorate voting absentee or by mail, compared to 21% in 2016 and 29% in 2024.Footnote 11 In the collection of counties included in our data, 53% of the voting age population is white, 12% are Black, and 27% are Hispanic.Footnote 12
Categorizations of Local Offices and Ballot Measures
A time-consuming component of our data processing is the collection of information on the candidates and ballot measures. The raw CVRs do not include the wording of the local ballot measures. We used existing election databases, voter guides, and newspaper coverage to categorize as many offices and measures as possible. Details are given in subsequent sections.
For this article, we divide contests into six categories: a contest is either a partisan office, a nonpartisan office, or a ballot measure, and it is also either at the state or local level. Partisan offices are simply those where candidates run with party labels next to their names on the ballot. Almost always, those candidates must win their own party’s primaries to get to the general election. Nonpartisan offices are those without party labels. A given office, such as mayor or county council, or even state judicial offices, can be partisan in some places but nonpartisan in others. We define state offices to include elected officials the state government—statewide executive officers, commissioners, state legislators, and state judges. Local offices encompass everything else, from municipal and county districts to school districts.
Ballot measures are quite common in the US at the state and local level. All states except Delaware require voter approval of state constitutional amendments. Many states allow initiatives and referendums, allowing voters to pass laws or constitutional amendments directly, or to strike down a law passed by the legislature. Some states require voter approval of certain types of laws and policies, such as general obligation bonds or tax increases. In many localities, voter approval is required for bonds, tax increases, and to prevent some taxes from expiring. The state ballot measures in our sample are a mix of legislatively approved measures and initiatives. Almost all of the local measures were placed on the ballot by a local government, although a few are initiatives. Most measures require a simple majority to pass, although some require supermajorities.
Not all of the votes for President and other federal offices can be linked to subnational offices or ballot measures. Some voters do not face contested state or local races, or do not have the opportunity to vote on ballot measures. In certain cases, the CVR data split each voter’s complete ballot across two or more rows representing separate pages of their physical paper ballots, and we are unable to link voting across these split records (for details, see Kuriwaki et al. Reference Kuriwaki, Reece, Baltz, Conevska, Loffredo, Samarth and Mutlu2024). Therefore, we study various subsets of this data given the availability of offices on the ballot. Figure 1 shows our sample sizes and their locations after we limit them to those linked to a federal office. State-level offices are in the top row, while local offices are in the bottom. The columns are organized by partisan offices (left), nonpartisan offices (middle), and ballot measures (right).
Coverage of Cast Vote Records
Note: Total voters linked to their federal ballot, by state and category. Section A of the Supplementary Material shows exact counts by state.

Many local elections are held off-cycle, and our data are all from a presidential election year, 2020. Nonetheless, the data contain many local contests—for example, 544 school board races, 602 municipal legislative races, and 1,768 local ballot measures (see Tables 1 and 4). For each of these local contests—and also for state contests—the data contain a record of how each individual voted in that contest and how that voter voted for other offices such as the U.S. President and the U.S. House.
Voting Patterns by Partisanship

Note: $ {D}^D $
is the average percentage of the two-party vote cast for the Democratic candidate by National Democrats, and
$ {D}^D $
is the average percentage of the two-party vote cast for the Democratic candidate by National Democrats, and $ {D}^R $
is the percentage of the two-party vote cast for the Democratic candidate by National Republicans. The Absolute Partisan Gap shows the average across contests.
$ {D}^R $
is the percentage of the two-party vote cast for the Democratic candidate by National Republicans. The Absolute Partisan Gap shows the average across contests.
We further limit the sample analyzed in the following ways. First, we drop uncontested races, and minimally contested races where the winning candidate or choice received more than 95% of the votes. Second, for nonpartisan races, we drop cases where the top-two candidates received less than 75% of the total votes cast. Third, we drop contests with less than 100 votes. These small contests often occur in special districts, for example, for water or sanitation. Fourth, we drop contests where voters could cast votes for more than one candidate—for example, multi-member district and ranked choice elections. Just over 15% of the contests in our sample were of this type. For our replication data, see Conevska et al. (Reference Conevska, Hirano, Kuriwaki, B. Lewis, Mutlu and M. Snyder2025).
Measures of Partisan Voting
We want to capture the differences or similarities in how Democrats and Republicans vote as simply and intuitively as possible. We therefore focus on a measure we call the Absolute Partisan Gap. Computed at the contest level, it ranges from 0 to 100, and it can be applied to a wide variety of first-past-the-post contests, including partisan races, nonpartisan races, and ballot measures.
To construct this measure, we first divide voters according to their National Partisanship based on their vote choices in the elections for the President, the U.S. House, and U.S. Senate. Specifically, we call a voter Democratic if they voted only for Democratic candidates for federal offices, and we call a voter Republican if they voted only for Republican candidates for these offices. All others are split-ticket voters, who we set aside in most of our subsequent analyses. By this measure, only 6% of our sample are split-ticket voters.Footnote 13 Although our vote-based measure of partisanship differs from the conventional survey-based measure of partisan identity, election surveys indicate that over 90% of voters that would be classified as national partisans using our definition in fact identify with that party.Footnote 14
To define the $ APG $
, let
$ APG $
, let $ {V}_{1j}^D $
be the total votes cast for the winning candidate (or alternative) in contest j among Democratic voters, let
$ {V}_{1j}^D $
be the total votes cast for the winning candidate (or alternative) in contest j among Democratic voters, let $ {V}_{2j}^D $
be the total votes cast for the second place candidate (or alternative) among Democratic voters, and let
$ {V}_{2j}^D $
be the total votes cast for the second place candidate (or alternative) among Democratic voters, and let $ {W}_j^D=100\hskip0.3em {V}_{1j}^D/({V}_{1j}^D+{V}_{2j}^D) $
be the percentage of votes cast for the winner among Democratic voters. Let
$ {W}_j^D=100\hskip0.3em {V}_{1j}^D/({V}_{1j}^D+{V}_{2j}^D) $
be the percentage of votes cast for the winner among Democratic voters. Let $ {V}_{1j}^R $
,
$ {V}_{1j}^R $
, $ {V}_{2j}^R $
, and
$ {V}_{2j}^R $
, and $ {W}_j^R $
be the analogs for Republican voters. The
$ {W}_j^R $
be the analogs for Republican voters. The $ APG $
is simply:
$ APG $
is simply:
 $$ \begin{array}{rl}{APG}_j\equiv |{W}_j^D-{W}_j^R|.& \end{array} $$
For example, consider a race where the Democratic candidate wins. If all Democrats vote for the Democratic candidate and all Republicans vote for the Republican candidate, then $ APG\hskip0.3em =\hskip0.3em 100 $
(i.e., 100 percentage points). If 75% of Democrats vote for the Democratic candidate and 75% of Republicans vote for the Republican candidate, then
$ APG\hskip0.3em =\hskip0.3em 100 $
(i.e., 100 percentage points). If 75% of Democrats vote for the Democratic candidate and 75% of Republicans vote for the Republican candidate, then $ APG=50 $
. If 50% of Democrats vote for the Democratic candidate and 50% of Republicans vote for the Republican candidate, then
$ APG=50 $
. If 50% of Democrats vote for the Democratic candidate and 50% of Republicans vote for the Republican candidate, then $ APG=0 $
. As another example, consider a nonpartisan race in which candidate A wins, followed by second place loser candidate B, and third place loser C. Suppose that among Democrats who voted for either candidate A or B, 65% voted for candidate A, and among Republicans who voted for either candidate A or B, 40% voted for candidate A. Then
$ APG=0 $
. As another example, consider a nonpartisan race in which candidate A wins, followed by second place loser candidate B, and third place loser C. Suppose that among Democrats who voted for either candidate A or B, 65% voted for candidate A, and among Republicans who voted for either candidate A or B, 40% voted for candidate A. Then $ APG=25 $
.Footnote 15
$ APG=25 $
.Footnote 15
Note that we can compute $ APG $
in other ways. Consider a partisan office, and let
$ APG $
in other ways. Consider a partisan office, and let $ {D}_j^D $
be the percentage of the two-party vote cast for the Democratic candidate among Democratic voters, and let
$ {D}_j^D $
be the percentage of the two-party vote cast for the Democratic candidate among Democratic voters, and let $ {D}_j^R $
be the analogous percentage among Republican voters (that is,
$ {D}_j^R $
be the analogous percentage among Republican voters (that is, $ {D}_j^R $
is the percent of Republicans who split their ticket in the contest). Then
$ {D}_j^R $
is the percent of Republicans who split their ticket in the contest). Then
 $$ \begin{array}{rl}{APG}_j=|{D}_j^D\hskip0.3em -\hskip0.3em {D}_j^R|.& \end{array} $$
As a practical matter, the absolute value is unnecessary, because $ {D}_j^D>{D}_j^R $
in all cases. Note also that if there are only two alternatives in the contest and the absolute partisan advantage and the absolute vote share margin in the contest are equal, then the
$ {D}_j^D>{D}_j^R $
in all cases. Note also that if there are only two alternatives in the contest and the absolute partisan advantage and the absolute vote share margin in the contest are equal, then the $ APG $
is equal to the individual level correlation between partisanship and voting. More generally, if
$ APG $
is equal to the individual level correlation between partisanship and voting. More generally, if $ {y}_i $
is a binary variable for voter i voting Democrat in a local contest j, and
$ {y}_i $
is a binary variable for voter i voting Democrat in a local contest j, and $ {d}_i $
is a binary variable for being a Democrat, then
$ {d}_i $
is a binary variable for being a Democrat, then $ APG $
j
= |Corr(y, d)| · SD(y) / SD(d).Footnote 16
$ APG $
j
= |Corr(y, d)| · SD(y) / SD(d).Footnote 16
For ballot measure contests, similarly let $ {Y}_j^D $
be the percentage of votes cast for the Yes alternative among Democratic voters and let
$ {Y}_j^D $
be the percentage of votes cast for the Yes alternative among Democratic voters and let $ {Y}_j^R $
be the analogous percentage among Republican voters. Then
$ {Y}_j^R $
be the analogous percentage among Republican voters. Then $ {APG}_j=|{Y}_j^D\hskip0.3em -\hskip0.3em {Y}_j^R| $
. Finally, consider the following. We manually collect metadata about each state and local ballot measure to determine which of the two alternatives can be considered more “Liberal” or more “Conservative” (more details on this below). For each ballot measure j where we make this determination, let
$ {APG}_j=|{Y}_j^D\hskip0.3em -\hskip0.3em {Y}_j^R| $
. Finally, consider the following. We manually collect metadata about each state and local ballot measure to determine which of the two alternatives can be considered more “Liberal” or more “Conservative” (more details on this below). For each ballot measure j where we make this determination, let $ {L}_j^D $
be the percentage of votes cast for the Liberal alternative among Democratic voters, and let
$ {L}_j^D $
be the percentage of votes cast for the Liberal alternative among Democratic voters, and let $ {L}_j^R $
be the analogous percentage among Republican voters. Then
$ {L}_j^R $
be the analogous percentage among Republican voters. Then $ {APG}_j=|{L}_j^D\hskip0.3em -\hskip0.3em {L}_j^R| $
. The absolute value is almost unnecessary for these contests, because
$ {APG}_j=|{L}_j^D\hskip0.3em -\hskip0.3em {L}_j^R| $
. The absolute value is almost unnecessary for these contests, because $ {L}_j^D>{L}_j^R $
in almost all cases.
$ {L}_j^D>{L}_j^R $
in almost all cases.
One limitation of the $ APG $
is that it focuses on the top two candidates or alternatives, ignoring other choices and roll-off. Our measure using percentages may be sensitive to the small baseline prevalence of Democrats and Republicans in a locality. However, when we consider more complicated and general measures that incorporate these other choices, the quantitative estimates change only slightly, and the qualitative conclusions do not change at all.Footnote 17
$ APG $
is that it focuses on the top two candidates or alternatives, ignoring other choices and roll-off. Our measure using percentages may be sensitive to the small baseline prevalence of Democrats and Republicans in a locality. However, when we consider more complicated and general measures that incorporate these other choices, the quantitative estimates change only slightly, and the qualitative conclusions do not change at all.Footnote 17
THE PARTISAN GAP IN STATE AND LOCAL ELECTIONS
We first present the $ APG $
for each group of offices. In the subsequent sections, we further subdivide offices and contests within each office group, and explore associations between characteristics of the locality.
$ APG $
for each group of offices. In the subsequent sections, we further subdivide offices and contests within each office group, and explore associations between characteristics of the locality.
Main Results
Table 1 presents basic summary statistics for three types of contests—partisan races in the top panel, nonpartisan races in the middle panel, and ballot measures in the bottom panel. Within each panel, the first row covers state contests and the second covers local contests.
The first two columns of the top panel show, for each type of voter (Democratic or Republican), the average percentage voting for the Democratic candidate in state and local partisan races. Evidently, voting in these races is highly partisan, with 92% to 97% of choices matching voters’ National Partisanship. As a result, the average values of $ APG $
are quite high—91 points for state partisan races and 85 points for local partisan races.
$ APG $
are quite high—91 points for state partisan races and 85 points for local partisan races.
For nonpartisan races and ballot measures, the average $ APG $
is much lower. Also, within each panel, the average
$ APG $
is much lower. Also, within each panel, the average $ APG $
is noticeably lower in local contests than in state contests.
$ APG $
is noticeably lower in local contests than in state contests.
Table 1 shows that the average $ APG $
for partisan offices differs dramatically from those for nonpartisan offices and ballot measures. But what about the variation? Figure 2 below shows histograms that give a sense of the spread around the average values. The panels are ordered in the same way as in Figure 1. We see that among partisan offices, the
$ APG $
for partisan offices differs dramatically from those for nonpartisan offices and ballot measures. But what about the variation? Figure 2 below shows histograms that give a sense of the spread around the average values. The panels are ordered in the same way as in Figure 1. We see that among partisan offices, the $ APG $
s are all centered at the high end around 90 points, while the local ballot measures and nonpartisan offices are centered at the opposite end of the spectrum.
$ APG $
s are all centered at the high end around 90 points, while the local ballot measures and nonpartisan offices are centered at the opposite end of the spectrum.
The Distribution of the Absolute Partisan Gap, by Type of Office
Note: Each histogram shows the distribution of the Absolute Partisan Gap (horizontal axis). The vertical axis shows proportions within each type of office.

How many nonpartisan races for state and local offices exhibit highly partisan behavior? How many state and local ballot measures are highly partisan? It depends on what threshold we use to define “highly partisan.” For partisan offices, the average value of the $ APG $
is more than 80 percentage points. Using 80 points as the threshold, almost no nonpartisan elections or ballot measures qualify. Relaxing the threshold to 60 points changes the story only slightly. Relaxing it further to 40 points—produced by partisan differences of [70% – 30%] or more—we see that 41% of state contests are classified as highly partisan, as are 16% of local contests.
$ APG $
is more than 80 percentage points. Using 80 points as the threshold, almost no nonpartisan elections or ballot measures qualify. Relaxing the threshold to 60 points changes the story only slightly. Relaxing it further to 40 points—produced by partisan differences of [70% – 30%] or more—we see that 41% of state contests are classified as highly partisan, as are 16% of local contests.
Most of the nonpartisan state races with $ APG>40 $
are judicial contests in Ohio. Although these elections are nominally nonpartisan, they have a unique feature: party labels do not appear on the general election ballot, but the candidates are chosen in partisan primaries.Footnote 18 It is not surprising that these races are relatively partisan, since party organizations and politicians often campaign heavily for their nominees (Cheek and Champagne Reference Cheek and Champagne2003; Schotland Reference Schotland2006). If we set these aside, then the average value of
$ APG>40 $
are judicial contests in Ohio. Although these elections are nominally nonpartisan, they have a unique feature: party labels do not appear on the general election ballot, but the candidates are chosen in partisan primaries.Footnote 18 It is not surprising that these races are relatively partisan, since party organizations and politicians often campaign heavily for their nominees (Cheek and Champagne Reference Cheek and Champagne2003; Schotland Reference Schotland2006). If we set these aside, then the average value of $ APG $
for state offices is just 28 points, and only 25% of the contests have
$ APG $
for state offices is just 28 points, and only 25% of the contests have $ APG>40 $
.Footnote 19
$ APG>40 $
.Footnote 19
Theoretically, the $ APG $
s for local nonpartisan offices and local ballot measures might be small simply because the contests are extremely uncompetitive. If the winning side receives 80% of the votes, for example, then the gap between Democratic and Republican voters is unlikely to be large. Indeed, the relationship between
$ APG $
s for local nonpartisan offices and local ballot measures might be small simply because the contests are extremely uncompetitive. If the winning side receives 80% of the votes, for example, then the gap between Democratic and Republican voters is unlikely to be large. Indeed, the relationship between $ APG $
and the margin of victory is negative. However, as shown in Section C of the Supplementary Material: (i) most of the local contests in our sample, especially for nonpartisan offices, are actually fairly competitive; (ii) the relationship between the margin of victory and the
$ APG $
and the margin of victory is negative. However, as shown in Section C of the Supplementary Material: (i) most of the local contests in our sample, especially for nonpartisan offices, are actually fairly competitive; (ii) the relationship between the margin of victory and the $ APG $
is weak, and (iii) the relationship only becomes noticeable when the margin of victory is more than about 25 to 30 percentage points, where a small fraction of the contests lie. So, this factor cannot account for the small
$ APG $
is weak, and (iii) the relationship only becomes noticeable when the margin of victory is more than about 25 to 30 percentage points, where a small fraction of the contests lie. So, this factor cannot account for the small $ APG $
s.
$ APG $
s.
One reason that the $ APG $
tends to be small in local nonpartisan contests is that the top two candidates in many of these races probably have similar ideologies, party affiliations, and positions on national policies. But even when that is not the case, voters might care more about candidates’ positions on local issues or their performance on local matters, rather than candidates’ ideologies, party affiliations, and positions on national policies. The latter are likely irrelevant for the day-to-day work of a county treasurer, town clerk, or school board member. They are probably not often relevant for county commissioners or mayors either, except perhaps in major cities or the largest counties. Based on our own reading of hundreds of newspaper articles, campaign advertisements, and editorials, it appears that local issues dominate the coverage and debates (see also Oliver, Ha, and Callen Reference Oliver, Ha and Callen2012).
$ APG $
tends to be small in local nonpartisan contests is that the top two candidates in many of these races probably have similar ideologies, party affiliations, and positions on national policies. But even when that is not the case, voters might care more about candidates’ positions on local issues or their performance on local matters, rather than candidates’ ideologies, party affiliations, and positions on national policies. The latter are likely irrelevant for the day-to-day work of a county treasurer, town clerk, or school board member. They are probably not often relevant for county commissioners or mayors either, except perhaps in major cities or the largest counties. Based on our own reading of hundreds of newspaper articles, campaign advertisements, and editorials, it appears that local issues dominate the coverage and debates (see also Oliver, Ha, and Callen Reference Oliver, Ha and Callen2012).
Moreover, if the top two candidates in many nonpartisan local races have similar ideologies, party affiliations, and positions on national policies, it is important to acknowledge that this is equilibrium behavior. That is, there is probably no strong demand for candidates who espouse strongly opposing ideologies, party affiliations, and positions on national policies—otherwise, such candidates would have an incentive to run. Figure 3 shows that although there is some tendency for $ APG $
to be higher in areas that are more competitive, the differences between competitive and uncompetitive areas are small.Footnote 20 Thus, even in areas where there are roughly equal numbers of Democrats and Republicans, most of the nominally nonpartisan local races do not divide the electorate along partisan lines.
$ APG $
to be higher in areas that are more competitive, the differences between competitive and uncompetitive areas are small.Footnote 20 Thus, even in areas where there are roughly equal numbers of Democrats and Republicans, most of the nominally nonpartisan local races do not divide the electorate along partisan lines.
The Absolute Partisan Gap vs. Partisan Competitiveness in Local Area
Note: Red lines indicate local averages. A contest is considered competitive (right panel) if the winner receives less than two-thirds of the total votes cast for the top two candidates.

We also investigated the degree to which $ APG $
varies depending upon constituency size and racial segregation, focusing on local contests.Footnote 21 In large counties and cities, the local government might not seem very “local.” Fewer voters may be personally acquainted with the candidates running, or have firsthand knowledge of the overall quality of services in the polity. In these cases, partisan or ideological cues might have a larger role. We find that the
$ APG $
varies depending upon constituency size and racial segregation, focusing on local contests.Footnote 21 In large counties and cities, the local government might not seem very “local.” Fewer voters may be personally acquainted with the candidates running, or have firsthand knowledge of the overall quality of services in the polity. In these cases, partisan or ideological cues might have a larger role. We find that the $ APG $
is modestly higher in larger constituencies. The total number of voters explains between 4% and 17% of variation in
$ APG $
is modestly higher in larger constituencies. The total number of voters explains between 4% and 17% of variation in $ APG $
, depending on the type of contest. Second, given the claims regarding the significance of race in urban politics and the overlap between racial, ideological, and partisan cleavages in recent years, we might expect voting to be more partisan or ideological in racially segregated areas (e.g., Trounstine Reference Trounstine2018). An index of racial segregation explains between 1% and 7% of variation in the
$ APG $
, depending on the type of contest. Second, given the claims regarding the significance of race in urban politics and the overlap between racial, ideological, and partisan cleavages in recent years, we might expect voting to be more partisan or ideological in racially segregated areas (e.g., Trounstine Reference Trounstine2018). An index of racial segregation explains between 1% and 7% of variation in the $ APG $
in local contests. Evidently, these variables can only account for a small percentage of the variation in the
$ APG $
in local contests. Evidently, these variables can only account for a small percentage of the variation in the $ APG $
.
$ APG $
.
Defining Partisanship by Party Lever Use in Michigan
Above, we measure national partisanship using votes for presidential and congressional candidates. Voters in some states have the option to pull the party lever. This automatically votes a straight party ticket for all nominally partisan contests, which voters can then override on a race-by-race basis. For Michigan, we have information about whether voters exercised this straight-party option or not, and whether they deviated from this option anywhere on the ballot. This is arguably a more direct expression of partisan preference, and can also be used as a measure of partisanship. Using this measure produces $ APG $
s for partisan state and partisan local offices that are about 4–9 points higher than the estimates produced using our main measure (see Section C of the Supplementary Material). Part of this might be due to a type of mechanical effect—because voters know that their choices in partisan races are all filled in automatically, they might not check these races carefully down the ballot (Thornburg, Davis, and Buell Reference Thornburg, Davis and Buell2025). For nonpartisan contests and ballot measures, which are still left blank even after pulling the party lever, the
$ APG $
s for partisan state and partisan local offices that are about 4–9 points higher than the estimates produced using our main measure (see Section C of the Supplementary Material). Part of this might be due to a type of mechanical effect—because voters know that their choices in partisan races are all filled in automatically, they might not check these races carefully down the ballot (Thornburg, Davis, and Buell Reference Thornburg, Davis and Buell2025). For nonpartisan contests and ballot measures, which are still left blank even after pulling the party lever, the $ APG $
s are similar using either definition of partisanship.
$ APG $
s are similar using either definition of partisanship.
Roll-Off and Minor Candidates
The results above focus on the two leading candidates or alternatives. They therefore exclude roll-off—voters who turn out to vote but skip certain contests—as well as votes cast for candidates other than the winner and first runner-up, which we refer to as minor candidates. Here we show that including these other choices does not substantially change the results.
The first panel of Table 2 shows that 4.4% of voters in contested state partisan offices roll off, as do 4.5% in contested local partisan offices. Here, contested races include races with a Democrat and Republican candidate and both candidates receive at least 5% of the vote. The second panel shows a significant increase in roll-off in contested races for nonpartisan state and local offices, 22.5 and 16.2, respectively. In the last panel, we see that roll-off for both state and local ballot measures is only slightly higher than roll-off for the contested partisan offices, and less than half as large as the roll-off for contested nonpartisan offices. In many cases, this means voters are likely skipping nonpartisan offices but voting on local measures further down the ballot, or in columns further to the right.
Roll-Off and Votes for Minor Candidates, in Percentages

Note: Average percentage of roll-off and votes cast for minor candidates, across contests.
Regarding minor candidates, Table 2 reports the vote percentage for all candidates other than the top two that received more than 1% of the vote. Evidently, few voters voted for minor candidates in 2020. In some states and localities, no such candidates are allowed on the ballot (e.g., the top-two systems in California and Washington), and in many races no such candidates ran even though permitted. In any case, the number of votes cast for minor candidates is too small to alter our main conclusions.
Explanatory Power of National Partisanship
An alternative way to summarize our data involves calculating the amount of variation that national partisanship can explain at the individual-level. Such analyses are impossible with aggregated election results, but straightforward with CVRs.
We estimate regressions at the individual voter level with voting on a down-ballot contest as the dependent variable and National Partisanship as the independent variable. The regression model is of the form:
 $$ \begin{array}{rl}{v}_{ij}={\alpha}_j+\beta \hskip0.3em {d}_i+{\epsilon}_{ij},& \end{array} $$
where $ {v}_{ij} $
is a binary variable that denotes voter i’s choice in contest j,
$ {v}_{ij} $
is a binary variable that denotes voter i’s choice in contest j, $ {d}_i $
is voter i’s National Partisanship (1 if Democratic and 0 if Republican), and
$ {d}_i $
is voter i’s National Partisanship (1 if Democratic and 0 if Republican), and $ {\alpha}_j $
is shorthand for the contest-specific fixed-effects. If a single voter votes on three different contests, they enter the data three times with a fixed effect for each contest. For partisan races, we code
$ {\alpha}_j $
is shorthand for the contest-specific fixed-effects. If a single voter votes on three different contests, they enter the data three times with a fixed effect for each contest. For partisan races, we code $ {v}_{ij} $
= 1 whenever a voter votes for the Democrat. For nonpartisan races and ballot measures, we code
$ {v}_{ij} $
= 1 whenever a voter votes for the Democrat. For nonpartisan races and ballot measures, we code $ {v}_{ij} $
= 1 whenever a voter votes for the candidate or ballot measure choice that is preferred more by national Democrats than by national Republicans.Footnote 22 This coding scheme allows us to use the same specification for nonpartisan contests and ballot measures, where the Democratic-preferred candidate is not readily obvious. This data-driven coding scheme likely overestimates the explanatory power of national partisanship on the outcome.
$ {v}_{ij} $
= 1 whenever a voter votes for the candidate or ballot measure choice that is preferred more by national Democrats than by national Republicans.Footnote 22 This coding scheme allows us to use the same specification for nonpartisan contests and ballot measures, where the Democratic-preferred candidate is not readily obvious. This data-driven coding scheme likely overestimates the explanatory power of national partisanship on the outcome.
The within-group R-squared of the fixed-effects regression in Equation 3 captures the within-contest explanatory power of National Partisanship. This seems like the most natural measure to assess how well National Partisanship can account for voters’ choices.Footnote 23
Table 3 shows the within-contest R-squared estimates for each subset of offices. Each row represents a regression for a different outcome. The first column indicates the coefficient $ \widehat{\beta} $
on the National Partisanship variable. The patterns are the same as in Table 1. National Partisanship explains over 80% of the variance in voting for local partisan offices, but less than 8% of the variance in voting for local ballot measures and local nonpartisan offices.Footnote 24
$ \widehat{\beta} $
on the National Partisanship variable. The patterns are the same as in Table 1. National Partisanship explains over 80% of the variance in voting for local partisan offices, but less than 8% of the variance in voting for local ballot measures and local nonpartisan offices.Footnote 24
Voting Patterns by Partisanship, Regression Estimates

Note: Each row is a separate regression. Coefficient estimates in column labeled National Partisanship. Standard errors, clustered by contests, are in parentheses. Fixed effects for contests included in all cases.
Voting Patterns by Partisanship, Selected Local Offices
Note: $ {D}^D $
is the average percentage of the two-party vote cast for the Democratic candidate by National Democrats, and
$ {D}^D $
is the average percentage of the two-party vote cast for the Democratic candidate by National Democrats, and $ {D}^R $
is the percentage of the two-party vote cast for the Democratic candidate by National Republicans.
$ {D}^R $
is the percentage of the two-party vote cast for the Democratic candidate by National Republicans.
When we limit our attention to contests where we can identify the Democratic and Republican candidates, or the Liberal and Conservative alternatives, the explanatory power of National Partisanship is several percentage points larger. We manually identified ballot measures that could be considered as some form of spending increase, or if not a spending increase, a proposal that would move policy in a conventional liberal or left ideological direction (we explain this process in more detail when discussing ballot measures). We then define $ {v}_{ij} $
in Equation 3 so that in nominally partisan contests, 1 indicates voting for the Democratic candidate, and in spending-related or ideological ballot measures, 1 indicates voting in the liberal direction. With these specifications, state ballot measures that are either spending-related or ideological exhibit an R-squared of 0.206 (N = 170,412,065), and local ballot measures that are either spending-related or ideological exhibit an R-squared of 0.104 (N = 42,966,899).
$ {v}_{ij} $
in Equation 3 so that in nominally partisan contests, 1 indicates voting for the Democratic candidate, and in spending-related or ideological ballot measures, 1 indicates voting in the liberal direction. With these specifications, state ballot measures that are either spending-related or ideological exhibit an R-squared of 0.206 (N = 170,412,065), and local ballot measures that are either spending-related or ideological exhibit an R-squared of 0.104 (N = 42,966,899).
VARIATION IN PARTISANSHIP ACROSS LOCAL OFFICES
There are many different types of elected local offices. Some offices have a broad range of responsiblities, while others are more focused on more particular tasks or policy issues. Some are executive offices, while others are more legislative or judicial in character. Some are highly visible to the public, while others are relatively obscure. Is voting more partisan for some offices more than others?
Previous literature highlights the importance of information. Voters tend to have less information about the candidates competing in many down-ballot races—for example, for state legislative seats, and low-profile local offices such as county clerk, register of deeds, city treasurer, or town auditor (Rogers Reference Rogers2023). Both observational and experimental designs have shown that, for congressional, senatorial, and gubernatorial elections, less information leads voters to rely more heavily on party cues and to vote more consistently with their party identification (Moskowitz Reference Moskowitz2020; Peterson Reference Peterson2017). On the other hand, Kuriwaki (Reference Kuriwaki2025) shows that ticket splitting in local partisan offices is often higher than in congressional races, and even varies across local offices. He suggests that even if aggregate information is sparse, candidates in local offices may differ sharply on valence attributes, such as candidate performance, and that these measures correlate well with ticket splitting patterns.
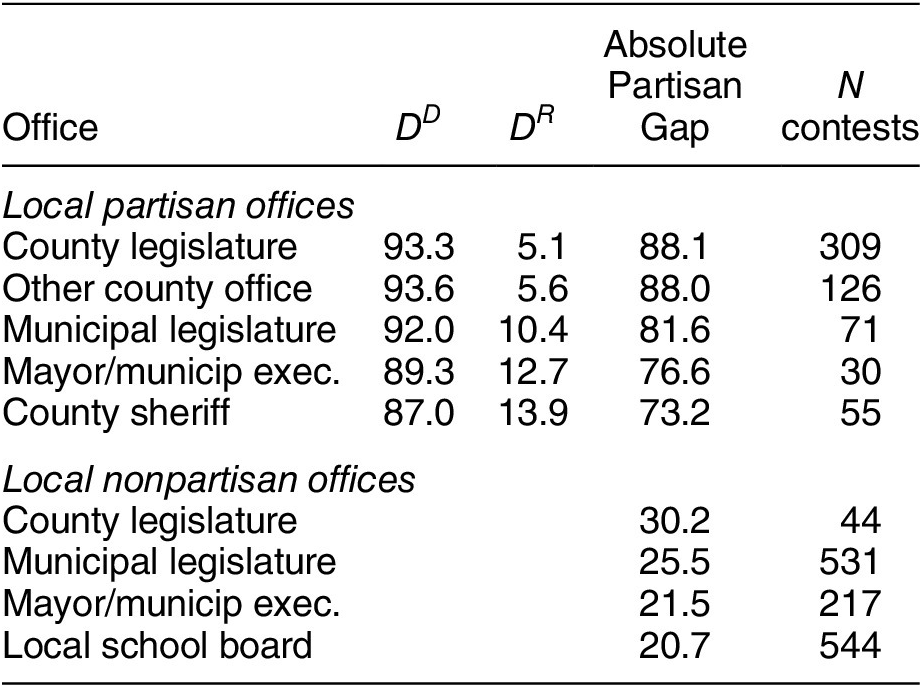
Our data are well-positioned to begin exploring variation in partisan behavior at the local level, since they cover a wide range of offices and contain precise, individual level choices. Table 4 computes the $ APG $
for each type of office. We divided partisan offices into county legislature, other county office, municipal legislature, and sheriff. We also divided nonpartisan offices into county legislature, municipal legislature, mayors, and school board. These are listed in decreasing order of the
$ APG $
for each type of office. We divided partisan offices into county legislature, other county office, municipal legislature, and sheriff. We also divided nonpartisan offices into county legislature, municipal legislature, mayors, and school board. These are listed in decreasing order of the $ APG $
.
$ APG $
.
Among local partisan offices, county legislators exhibit the highest $ APG $
, followed closely by miscellaneous county offices other than sheriff—both around 88 points. Sheriffs have the smallest
$ APG $
, followed closely by miscellaneous county offices other than sheriff—both around 88 points. Sheriffs have the smallest $ APG $
, 73 points, followed by mayors elected on partisan ballots. The
$ APG $
, 73 points, followed by mayors elected on partisan ballots. The $ APG $
s are much lower for all four groups of nonpartisan races. Again, county legislators are at the top. School boards races are the least partisan by our measure, with an
$ APG $
s are much lower for all four groups of nonpartisan races. Again, county legislators are at the top. School boards races are the least partisan by our measure, with an $ APG $
of 21 points.Footnote 25
$ APG $
of 21 points.Footnote 25
What factors might account for the patterns in Table 4? The low $ APG $
for sheriffs is consistent with previous literature that finds an especially high amount of split-ticket voting, and especially high incumbency advantage for sheriffs (Kuriwaki Reference Kuriwaki2025; Zoorob Reference Zoorob2022). They attribute their findings in part to high levels of name recognition or news coverage, suggesting that the availability of information plays a role. Moreover, similar to mayors, which also have relatively low
$ APG $
for sheriffs is consistent with previous literature that finds an especially high amount of split-ticket voting, and especially high incumbency advantage for sheriffs (Kuriwaki Reference Kuriwaki2025; Zoorob Reference Zoorob2022). They attribute their findings in part to high levels of name recognition or news coverage, suggesting that the availability of information plays a role. Moreover, similar to mayors, which also have relatively low $ APG $
s, the office is led by one person. It may be easier to assess performance when responsibilities are not broadly shared by many individuals, as in local legislatures. Third, sheriffs have a relatively limited set of responsibilities focused on law enforcement, for which it may be easier to recognize revelant qualifications and to evaluate incumbent performance. Citizens have a general sense of how safe they feel from personal experience, and they can also use commonly reported statistics, such as crime rates, to judge performance. This may also contribute to the low
$ APG $
s, the office is led by one person. It may be easier to assess performance when responsibilities are not broadly shared by many individuals, as in local legislatures. Third, sheriffs have a relatively limited set of responsibilities focused on law enforcement, for which it may be easier to recognize revelant qualifications and to evaluate incumbent performance. Citizens have a general sense of how safe they feel from personal experience, and they can also use commonly reported statistics, such as crime rates, to judge performance. This may also contribute to the low $ APG $
of local school officials, since this office also focuses on a particular policy area with which many have personal experience, and with relatively accessible metrics to evaluate performance. Of course, the differences between partisan and nonpartisan elections are much larger than the variation across offices within each group.
$ APG $
of local school officials, since this office also focuses on a particular policy area with which many have personal experience, and with relatively accessible metrics to evaluate performance. Of course, the differences between partisan and nonpartisan elections are much larger than the variation across offices within each group.
VARIATION IN PARTISANSHIP ACROSS ISSUE AREAS
Turning to ballot measures, there is much variation to consider. Some measures are closely related to contentious national issues, such as abortion, LGBTQ rights, labor regulations, affirmative action, and gun control. Others involve issues for which the positions of the national parties are unclear, such as gambling, alcohol, zoning, and land use. Whether voters have relatively well-formed preferences on these issues is an open question. Some measures might be even more obscure, including many administrative reforms. What should the residency requirement be for county commissioners? How often should the city charter commission be required to meet?
An especially large and important group of measures involve targeted spending, bonds, and state or local taxes. These tend to be highly specific, are proposed by state and local governments, and require voter approval. Take for example the following 2020 ballot measure, in the Dallas County (Texas) School District:
For/Against: “The issuance of $3,271,600,000 of bonds for the construction, acquisition, and equipment of school buildings and for the purchase of necessary sites for school buildings; and the levying of a tax sufficient, without limit as to rate or amount, to pay the principal of and interest on the bonds and to pay the costs of any credit agreements executed or authorized in anticipation of, in relation to or in connection with the bonds. THIS IS A PROPERTY TAX INCREASE.”Footnote 26
Some voters might view these measures through an ideological or partisan lens—for example, big government vs. small government, or government waste vs. private sector efficiency. Other voters might view them more in practical terms—“I drive on the roads, my children go to the schools, and my home and family are protected by the police and fire departments, so I am willing to pay more taxes to help maintain local infrastructure and services.” We study these in some detail.
We first divide the state and local ballot measures into two broad groups. These are shown in Table 5. The first two rows of the table cover non-spending ballot measures for which we can identify the ideologically more liberal or more conservative alternative. These classifications are based on a variety of sources, including endorsements by parties, politicians and interest groups, campaign spending patterns, voter guides, newspaper coverage and editorials, and our own reading of the text of the measures. These measures include issues such as: minimum wage, police oversight, labor relations, affirmative action, language regarding gender, same-sex marriage, rent control, abortion rights, gun control/rights, marijuana use, presidential election popular vote pact, voting rights, and environmental/business regulations. The second two rows of the table cover measures on spending, bonds, and taxes. For most of these measures, passage implies higher levels of spending and/or taxes. We rely heavily on the National Taxpayers’ Union Ballot Guide to identify and classify these, and we fill in the rest using other sources, especially local newspapers.Footnote 27
Voting Patterns by Partisanship, Ballot Measures by Type

Note: $ {L}^D $
is the average percentage of the two-party vote cast for the Liberal alternative by National Democrats, and
$ {L}^D $
is the average percentage of the two-party vote cast for the Liberal alternative by National Democrats, and $ {L}^R $
is the percentage of the two-party vote cast for the Liberal alternative by National Republicans.
$ {L}^R $
is the percentage of the two-party vote cast for the Liberal alternative by National Republicans.
In the top two rows, the first two columns show the average percentage of each type of voter (Democratic or Republican) that voted for the Liberal alternative for each measure. In the bottom two rows the first columns show the average percentage of each type of voter (Democratic or Republican) that voted for the alternative that represented higher taxes or spending. The next two columns show the average Partisan Gap and $ APG $
.
$ APG $
.
The bottom line is straightforward. First, the state ideological and tax/spending measures exhibit higher average $ APG $
s than the average across all state measures shown in Table 1. The same is true for the local ideological measures. Second, the average
$ APG $
s than the average across all state measures shown in Table 1. The same is true for the local ideological measures. Second, the average $ APG $
for local tax/spending measures is much lower than for the first three types of measures, and is only slightly higher than the average across all local measures shown in Table 1. Finally, all of the
$ APG $
for local tax/spending measures is much lower than for the first three types of measures, and is only slightly higher than the average across all local measures shown in Table 1. Finally, all of the $ APG $
s in the table are much lower than the average
$ APG $
s in the table are much lower than the average $ APG $
for state or local partisan races shown in Table 1.Footnote 28
$ APG $
for state or local partisan races shown in Table 1.Footnote 28
Table 6 divides the local ballot measures even more finely, into specific issue categories based on our reading of the ballot measure. It then shows how the $ APG $
varies across local issues. The
$ APG $
varies across local issues. The $ APG $
s tend to be small for the categories that the U.S. Census of Governments lists as “common city functions”—police, fire, sanitation (includes sewers, trash), roads (streets, highways, bridges, sidewalks), water supply and other functions including libraries and parks and recreation— on average, about 14 percentage points.Footnote 29 Note that these are generally the spending categories that Peterson (Reference Peterson1981) would classify as allocational or developmental.
$ APG $
s tend to be small for the categories that the U.S. Census of Governments lists as “common city functions”—police, fire, sanitation (includes sewers, trash), roads (streets, highways, bridges, sidewalks), water supply and other functions including libraries and parks and recreation— on average, about 14 percentage points.Footnote 29 Note that these are generally the spending categories that Peterson (Reference Peterson1981) would classify as allocational or developmental.
Voting on Local Ballot Measures, by Issue Domain

Note: $ {Y}^A $
is the average percentage of the two-party vote cast for the Yes alternative by all voters,
$ {Y}^A $
is the average percentage of the two-party vote cast for the Yes alternative by all voters, $ {Y}^D $
is the average percentage of the two-party vote cast for the Yes alternative by National Democrats, and
$ {Y}^D $
is the average percentage of the two-party vote cast for the Yes alternative by National Democrats, and $ {Y}^R $
is the percentage of the two-party vote cast for the Yes alternative by National Republicans.
$ {Y}^R $
is the percentage of the two-party vote cast for the Yes alternative by National Republicans.
K-12 education is another, almost universal, function of local governments. Conflict over education issues appears to have increased within local school districts with some evidence that the severity is correlated with partisan competition (Holman, Johnson, and Simko Reference Holman, Johnson and Simko2025). While slightly higher, the average value of the $ APG $
for education is still relatively low, 28 percentage points. The average
$ APG $
for education is still relatively low, 28 percentage points. The average $ APG $
for healthcare is similar to education. Peterson (Reference Peterson1981) classifies education as both developmental and redistributive, and he classifies healthcare as redistributive.
$ APG $
for healthcare is similar to education. Peterson (Reference Peterson1981) classifies education as both developmental and redistributive, and he classifies healthcare as redistributive.
Finally, housing, property development, and zoning are among the core functions of city governments. City governments have the authority to approve or stall changes to zoning codes and to construct or subsidize housing. The average $ APG $
for spending on housing measures is much higher than for other categories, about 47 percentage points—76% of Democrats voting in favor and 71% of Republicans voting against. Peterson (Reference Peterson1981) classifies housing as redistributive, and all of the measures in our sample included provisions for low-income/affordable housing. Housing proposals with no reservations for low-income housing might draw more bipartisan support.Footnote 30 Note also that the number of housing ballot measures is small, only 10, so we must be cautious in drawing broad conclusions.
$ APG $
for spending on housing measures is much higher than for other categories, about 47 percentage points—76% of Democrats voting in favor and 71% of Republicans voting against. Peterson (Reference Peterson1981) classifies housing as redistributive, and all of the measures in our sample included provisions for low-income/affordable housing. Housing proposals with no reservations for low-income housing might draw more bipartisan support.Footnote 30 Note also that the number of housing ballot measures is small, only 10, so we must be cautious in drawing broad conclusions.
The relatively small average $ APG $
s evident in most spending categories are mainly due to the propensity of Republicans to support higher levels of local government spending compared to their levels of support for state spending measures, with the exception of housing. It also contrasts sharply with the national Republican party’s general message to cut government spending.Footnote 31
$ APG $
s evident in most spending categories are mainly due to the propensity of Republicans to support higher levels of local government spending compared to their levels of support for state spending measures, with the exception of housing. It also contrasts sharply with the national Republican party’s general message to cut government spending.Footnote 31
The bottom panel of Table 6 shows the $ APG $
s for non-spending measures which we have not classified as having an ideological direction—for example, term limits, alcohol ordinances, and the expediting of certain development permits. For each of these issues, the average
$ APG $
s for non-spending measures which we have not classified as having an ideological direction—for example, term limits, alcohol ordinances, and the expediting of certain development permits. For each of these issues, the average $ APG $
is quite low. This is consistent with the view that partisan and ideological cleavages are less prominent among local issues and policies. Voting for zoning proposals, where we did not code a liberal stance, is much less divisive than voting for more spending on housing, but they also receive the lowest amount of overall support at 53%.
$ APG $
is quite low. This is consistent with the view that partisan and ideological cleavages are less prominent among local issues and policies. Voting for zoning proposals, where we did not code a liberal stance, is much less divisive than voting for more spending on housing, but they also receive the lowest amount of overall support at 53%.
EVIDENCE FOR ISSUE VOTING ON LOCAL BALLOT MEASURES
If partisanship does not explain much of the variation in voting in nonpartisan contests, then what does explain the variation? Various nonpartisan factors have been identified in the literature. In the absence of party labels, voters appear to rely on a number of different cues. In races for local nonpartisan offices vote shares are related to candidate attributes, such as incumbency, previous experience, place, race/ethnicity, and gender.Footnote 32 In voting on local ballot measures, researchers have found relationships between vote choice and various socio-economic characteristics of voters such as homeowner status that could reflect voters’ self-interests, as well as contextual factors such as campaigning and endorsements.Footnote 33
Here we present one analysis using our CVR data that suggests the existence of structure in voters’ choices in these nonpartisan elections. The analysis also shows that this structure accounts for a much larger percentage of voters’ choices than does partisanship. We focus on education spending. In particular, we identified all school districts in our sample for which two or more education funding measures appeared on the ballot simultaneously.Footnote 34 If voters have preferences over local education spending, then their choices on these education measures should be highly correlated with one another. Decisions to support local education spending might or might not be correlated with partisanship—and, consistent with the results above, we find that the relationship is at best modest.
There are different ways to present the correlations. To parallel the regression analyses above, for each district we treat the first education measure in the CVR data as the dependent variable, and we average the choices on the remaining education measures to create the independent variable. We call these $ \mathrm{Education}\hskip0.3em \mathrm{Spending}\hskip0.3em 1 $
and
$ \mathrm{Education}\hskip0.3em \mathrm{Spending}\hskip0.3em 1 $
and $ \mathrm{Education}\hskip0.3em \mathrm{Spending}\hskip0.3em 2 $
, respectively.Footnote 35 In all cases, we orient the choices so that votes cast for higher levels of spending are coded as 1, votes cast for the other option are coded as 0, and voters who rolled-off are dropped.
$ \mathrm{Education}\hskip0.3em \mathrm{Spending}\hskip0.3em 2 $
, respectively.Footnote 35 In all cases, we orient the choices so that votes cast for higher levels of spending are coded as 1, votes cast for the other option are coded as 0, and voters who rolled-off are dropped.
The top panel of Table 7 presents the regression coefficient estimates, standard errors, and regression R-squareds (within-contest). In the first row, the independent variable is National Partisanship (partisanship), as defined in Equation 3. Consistent with Tables 3 and 6, partisanship explains only a small fraction of voting on local education spending measures—the R-squared is only 0.12. In the second row, the independent variable is $ \mathrm{Education}\hskip0.3em \mathrm{Spending}\hskip0.3em 2 $
. The estimated coefficient is nearly twice as large as the coefficient estimate on partisanship, and the R-squared is more than four times as large as that in the first row. The last row shows that when both variables are included in the regression, the estimated coefficient on
$ \mathrm{Education}\hskip0.3em \mathrm{Spending}\hskip0.3em 2 $
. The estimated coefficient is nearly twice as large as the coefficient estimate on partisanship, and the R-squared is more than four times as large as that in the first row. The last row shows that when both variables are included in the regression, the estimated coefficient on $ \mathrm{Education}\hskip0.3em \mathrm{Spending}\hskip0.3em 2 $
is more than four times as large as the coefficient on partisanship. Also the R-squared is only slightly larger than the R-squared in the second row where the only independent variable is
$ \mathrm{Education}\hskip0.3em \mathrm{Spending}\hskip0.3em 2 $
is more than four times as large as the coefficient on partisanship. Also the R-squared is only slightly larger than the R-squared in the second row where the only independent variable is $ \mathrm{Education}\hskip0.3em \mathrm{Spending}\hskip0.3em 2 $
.
$ \mathrm{Education}\hskip0.3em \mathrm{Spending}\hskip0.3em 2 $
.
Voting Patterns by Partisanship and Preferences on Other Ballot Measures, Regression Estimates

Note: Each row is a separate regression. Coefficient estimates under labeled National Partisanship and Education Spending 2. Standard errors, clustered by contests, are in parentheses. Fixed effects for contests included in all cases.
The second panel in the table provides a check that the subsample under study—that is, localities with two or more local education spending measures on the November 2020 ballot—is similar overall to the full sample.Footnote 36 The first row of this panel replicates the analysis of the first row of Table 3, but restricting attention to the set of localities included in the top panel of Table 7. The coefficient on partisanship, and the regression R-squared, are only slightly lower than those for the full sample. The second and third rows show that $ \mathrm{Education}\hskip0.3em \mathrm{Spending}\hskip0.3em 2 $
is a poor predictor of party choice in state partisan offices.
$ \mathrm{Education}\hskip0.3em \mathrm{Spending}\hskip0.3em 2 $
is a poor predictor of party choice in state partisan offices.
Note that the R-squared in the second row of the first panel is smaller than the top row of the second panel involving partisanship—that is, $ \mathrm{Education}\hskip0.3em \mathrm{Spending}\hskip0.3em 2 $
explains less of the variation in
$ \mathrm{Education}\hskip0.3em \mathrm{Spending}\hskip0.3em 2 $
explains less of the variation in $ \mathrm{Education}\hskip0.3em \mathrm{Spending}\hskip0.3em 1 $
than partisanship explains in voting for state partisan offices. One reason this is not too surprising is that the education spending measures underlying
$ \mathrm{Education}\hskip0.3em \mathrm{Spending}\hskip0.3em 1 $
than partisanship explains in voting for state partisan offices. One reason this is not too surprising is that the education spending measures underlying $ \mathrm{Education}\hskip0.3em \mathrm{Spending}\hskip0.3em 1 $
and
$ \mathrm{Education}\hskip0.3em \mathrm{Spending}\hskip0.3em 1 $
and $ \mathrm{Education}\hskip0.3em \mathrm{Spending}\hskip0.3em 2 $
often differ in significant ways—for example, they sometimes involve spending on different types of facilities, including sports and arts facilities, and/or they involve different funding sources, in particular, bonds versus taxes. Some voters may favor some measures, but not others, based on these differences.Footnote 37
$ \mathrm{Education}\hskip0.3em \mathrm{Spending}\hskip0.3em 2 $
often differ in significant ways—for example, they sometimes involve spending on different types of facilities, including sports and arts facilities, and/or they involve different funding sources, in particular, bonds versus taxes. Some voters may favor some measures, but not others, based on these differences.Footnote 37
Overall, these results suggest the existence of a preference for local education spending that is only weakly correlated with partisanship, and that is far more important than partisanship in accounting for voting on local education measures. We also conducted analogous analyses of spending on fire and emergency medical services, and spending on roads, and find patterns quite similar to those for education spending.Footnote 38
DISCUSSION AND CONCLUSION
The U.S. system of federalism allows voters to directly vote on anything from the members of a partisan Congress to a decision on how their local taxes are spent. In this study, we found that the degree to which national partisanship correlated with voters’ choices in 2020 varied substantially across offices, ballot measures, and levels of government. Partisan voters rarely voted for candidates of the opposing party in partisan races for state offices, resulting in large $ APG $
s of 91 percentage points, on average. They voted for candidates of the opposite party more in partisan races for local offices, but not dramatically more. This is consistent with claims that polarization has created distinct national partisan brands that voters use even in state and local elections.
$ APG $
s of 91 percentage points, on average. They voted for candidates of the opposite party more in partisan races for local offices, but not dramatically more. This is consistent with claims that polarization has created distinct national partisan brands that voters use even in state and local elections.
In nonpartisan races, however, especially at the local level, the average $ APG $
s were much smaller. For example, there is only a weak sense in which a nonpartisan school board candidate is the Republican or Democratic candidate. The differences in voting between Democrats and Republicans were also relatively small on local ballot measures, including measures to maintain or increase taxes and spending. In particular, Republican voters’ support for spending by their local governments appears to be substantially higher than their support for spending by their state governments. This is not to say that national partisanship is completely absent from local politics. For example, as Figure 2 shows, there is noticeable variation in
$ APG $
s were much smaller. For example, there is only a weak sense in which a nonpartisan school board candidate is the Republican or Democratic candidate. The differences in voting between Democrats and Republicans were also relatively small on local ballot measures, including measures to maintain or increase taxes and spending. In particular, Republican voters’ support for spending by their local governments appears to be substantially higher than their support for spending by their state governments. This is not to say that national partisanship is completely absent from local politics. For example, as Figure 2 shows, there is noticeable variation in $ APG $
s across local nonpartisan offices, indicating that partisan cleavages are important in some cases. Also, some items, such as spending on housing assistance, exhibit large average
$ APG $
s across local nonpartisan offices, indicating that partisan cleavages are important in some cases. Also, some items, such as spending on housing assistance, exhibit large average $ APG $
s. However, these make up a small fraction of the local measures that appear on the ballot. Overall, our findings suggest that many of the policy items or agendas facing state and local governments do not divide voters in ways that align closely with national partisan or ideological cleavages.
$ APG $
s. However, these make up a small fraction of the local measures that appear on the ballot. Overall, our findings suggest that many of the policy items or agendas facing state and local governments do not divide voters in ways that align closely with national partisan or ideological cleavages.
Evidently, voters view their local governments differently than they view the federal government. Our findings regarding voting on education spending measures are consistent with the existence of distinct local issue dimensions that go beyond national partisanship. Other evidence also supports this claim. Consider for example, trust in government. Voters’ trust and confidence in their local governments has evolved quite differently from their trust in the federal government. This can be seen in Figure 4a, which shows the percentage of Gallup respondents who expressed a great deal or a fair amount of trust in various levels of government between 1997 and 2024 (Gallup News Service 2024). Trust and confidence in the federal government has fallen precipitously over the past 25 years. By contrast, trust and confidence in local governments is essentially flat.Footnote 39 Though noisier, trust in state governments generally lies somewhere in the middle. Moreover, trust and confidence in local government is bipartisan, while trust and confidence in the federal government is not. For example, in 2023, 73% of Democrats and 69% of Republicans expressed a great or a fair amount of trust/confidence in their local governments, a gap of just 4 points (Figure 4b). Up until 2017, in most years Republicans had a higher trust of local government than Democrats. By contrast, the partisan gap of trust is 44 points for federal government, and 18 points for state government.
Trust in Government, 1997–2024
Note: Data from Gallup polls. Question asks: “How much trust and confidence do you have in…(i) The federal government to handle domestic problems. (ii) The government of the state where you live when it comes to handling state problems. (iii) Local governments in the area where you live when it comes to handling local problems.” Figures show percentage of respondents who respond a “Great Deal” or “Fair Amount.”

Thus, despite the highly partisan and polarized environment that exists at the national level, in the absence of partisan cues, voter behavior on issues that confront local governments does not exhibit the same level of partisanship and polarization. These patterns also emphasize the need for continued research to identify the forces shaping voter choices and attitudes in state and local elections. Our findings regarding education spending measures are consistent with the existence of distinct local issue dimensions that go beyond national partisanship. Existing scholarship suggests that local media coverage, interest group activities, and local endorsements are likely to be particularly important for understanding voter preferences on these local issue dimensions. This suggests, for example, that the decline of local newspaper circulation and resources might have important implications for local elections going forward. Future research should also investigate the contribution of institutional changes, such as the effect of nonpartisan ballots per se, off-cycle elections, or mail-in ballot accessibility in limiting the extent to which national partisanship or ideological cleavages divide voters in state and local elections.Footnote 40
SUPPLEMENTARY MATERIAL
The supplementary material for this article can be found at http://doi.org/10.1017/S0003055425100920
DATA AVAILABILTY STATEMENT
Research documentation and data that support the findings of this study are openly available at the American Political Science Review Dataverse: https://doi.org/10.7910/DVN/QHGLJS.
ACKNOWLEDGEMENTS
We thank Anthony Fowler, Gary King, Stephanie Ternullo, Jessica Trounstine, Hye Young You, and participants at the University of California San Diego, Columbia University, the University of Copenhagen, University of Pennsylvania, the Bocconi–Collegio Carlo Alberto Workshop in Political Economy (Turin), the Midwest Political Science Association Annual Meeting, and Harvard University, for their helpful comments. We thank Jessica Y. Lee and Alisha Arshad for their excellent RA work. Authors are listed alphabetically.
CONFLICT OF INTEREST
The authors declare no ethical issues or conflicts of interest in this research.
ETHICAL STANDARDS
The authors affirm this research did not involve human participants.


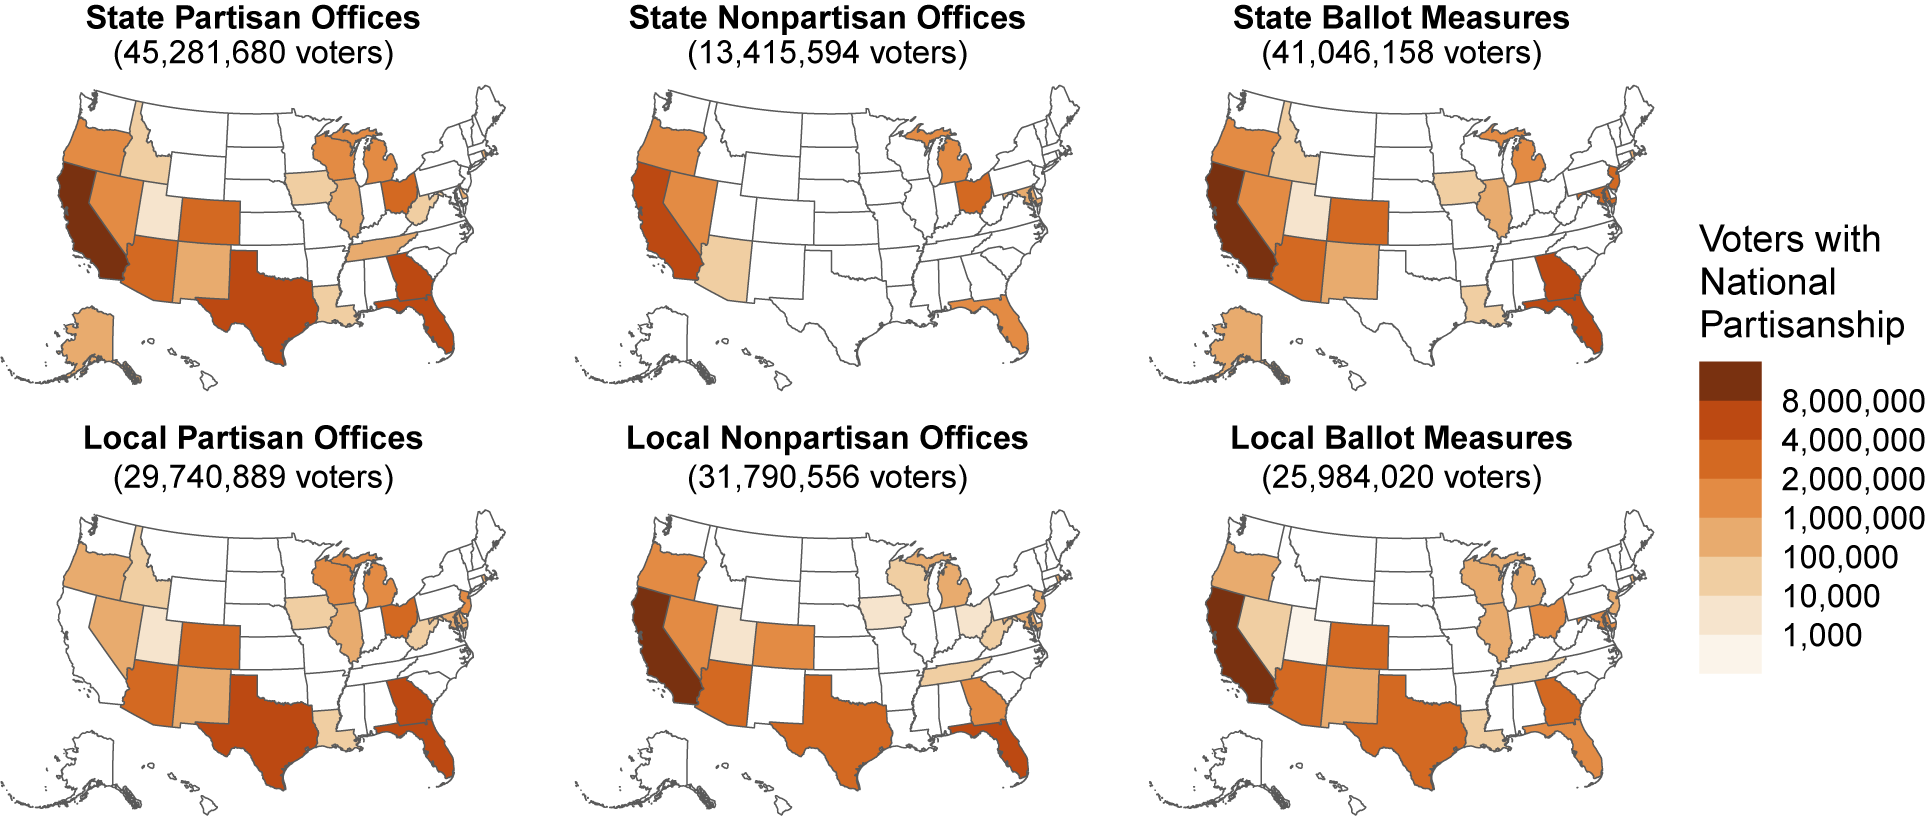
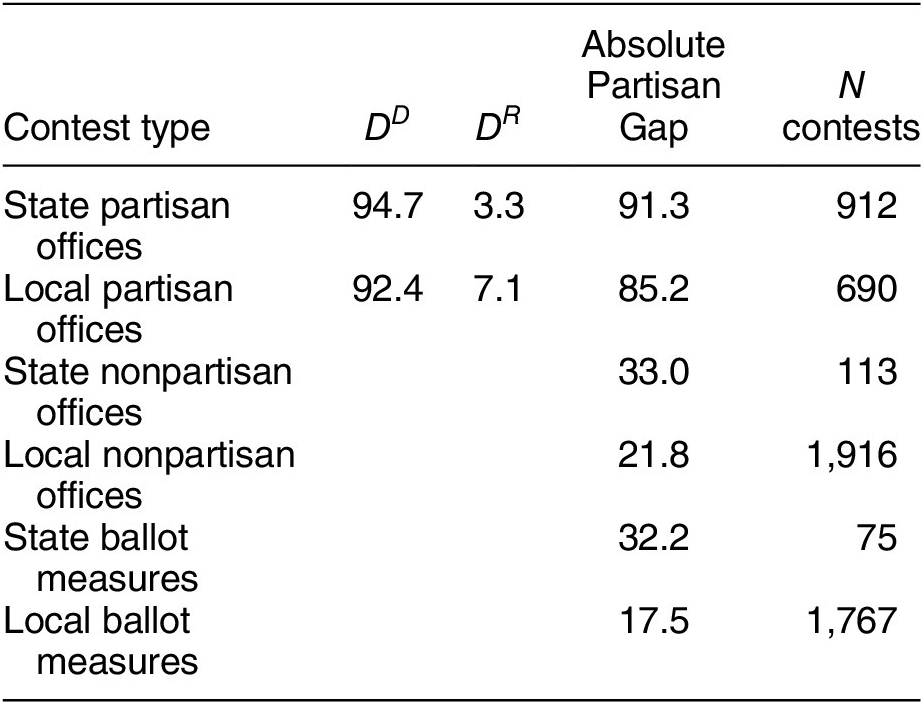


 Open access


Comments
No Comments have been published for this article.