


Animal-source foods are among the largest contributors to global warming and environmental degradation, with livestock production responsible for significant greenhouse gas emissions, deforestation and biodiversity loss(Reference Tilman and Clark1,Reference Ridoutt, Baird and Hendrie2) . However, foods such as seafood, milk, cheese and yogurt provide essential micronutrients such as iodine, calcium and vitamin B12, which are often more bioavailable than their plant-based counterparts(Reference Melse-Boonstra3). These nutrients are particularly important for vulnerable groups, including infants, young children, adolescents, women of reproductive age, pregnant and lactating women and older adults.
In recent years, dietary patterns in the UK have shifted, with a growing number of individuals reducing their consumption of animal-source foods. Between 2017 and 2019, the proportion of the UK population attempting to decrease their intake of these foods rose from 28 % to 39 %(4). The motivations for reducing or eliminating animal-source foods vary and include medical conditions such as lactose intolerance and milk protein allergies, ethical concerns regarding animal welfare, environmental sustainability, affordability and personal dietary choices such as vegetarianism and veganism(Reference Mäkinen, Wanhalinna and Zannini5,Reference Sethi, Tyagi and Anurag6) . In response to this changing consumer landscape, the market for plant-based alternatives (PBA) has expanded rapidly, offering a wide range of substitutes for milk, cheese, yogurt, seafood and other traditionally animal-derived products(Reference Nicol, Thomas and Nugent7).
Despite the increasing availability of PBA, there is currently no mandatory guidance in the UK regarding their fortification. As a result, the micronutrient composition of these products can vary widely depending on the brand and formulation. While some PBA are fortified with key nutrients such as calcium and vitamin B12 to align with their animal-based counterparts, iodine is often overlooked(Reference Clegg, Tarrado Ribes and Reynolds8). This is particularly concerning, as the primary ingredients used in PBA, such as soya, oats, almonds and coconut, are naturally low in iodine(Reference Finglas, Roe and Pinchen9).
The lack of iodine fortification of these products is concerning, given the essential role of iodine in human health. Iodine is a critical component of thyroid hormones, which regulate metabolism, growth and brain development(Reference Zimmermann and Boelaert10). In the UK, where iodine intake is generally insufficient rather than severely deficient(11), the primary concern is impaired neurodevelopment rather than clinical manifestations of severe iodine deficiency, such as goitre and hypothyroidism(Reference Zimmermann and Boelaert10). Mild-to-moderate insufficiency, particularly during pregnancy, has been linked to adverse cognitive outcomes in offspring(Reference Bath12). Pregnant and lactating women, along with infants and young children, are therefore particularly vulnerable(Reference Zimmermann and Boelaert10).
Although iodine deficiency (including goitre) was historically prevalent in the UK, iodine status improved during the mid-20th century largely due to increased iodine content of milk following changes in cattle feeding practices(Reference Phillips13) and the population was assumed to be iodine sufficient. The WHO recommended assessing population iodine status through measuring urinary iodine concentration (UIC) in spot-urine samples, a method now used by the National Diet and Nutrition Survey (NDNS); the criteria for iodine sufficiency in a population is a median UIC ≥ 100 µg/l and fewer than 20 % of individuals have a UIC below 50 µg/l(14). Data from the 2019–2023 NDNS report indicates that iodine deficiency has re-emerged among key groups, particularly among adults (median UIC: 89 µg/l, 25 % with UIC < 50 µg/l) and adolescent girls (median 95 µg/l, 29 % < 50 µg/l)(11).
In the UK today, cow’s milk and dairy products are the primary dietary sources of iodine, contributing significantly to population iodine intake, providing 48 % of total iodine intake in children aged 4–10 years and 34 % of intake in adults(15). Consequently, individuals who replace iodine-rich animal-source foods with unfortified PBA may be at risk of insufficient iodine intake(Reference Nicol, Nugent and Woodside16). In addition, many fish and seafood are rich sources of iodine. For example, a portion of cod would provide approximately 220 µg (146 % of the adult reference nutrient intake of 150 µg/d). Therefore, although fish and fish products provide a smaller contribution to total iodine intake in the UK (< 10 % in both children and adults), related to the poor intake of fish in general, replacement of fish with PBA that are not fortified would also potentially reduce iodine intake.
Market surveys from 2015(Reference Bath, Hill and Infante17) and 2020(Reference Clegg, Tarrado Ribes and Reynolds8) found that only 6 % and 4 %, respectively, of plant-based milk alternatives available in the UK were fortified with iodine; however, these surveys predate the dramatic growth of the PBA sector and do not reflect the increasing variety of PBA which may replace other iodine-rich foods, such as seafood and other dairy products. Given the growing consumer interest in plant-based diets and the continuous evolution of the market, there is a pressing need to capture year-on-year changes in the availability, diversity and fortification of PBA to accurately reflect current offerings and emerging trends. This assessment is essential for informing UK public health recommendations, ensuring consumers opt for fortified PBA to meet their iodine requirements. By systematically evaluating the iodine content of PBA and comparing it with that of their animal-source counterparts, this study aims to provide critical insights into the adequacy of iodine fortification within this rapidly expanding market.
Methods
Product search strategy
A cross-sectional survey was conducted annually over five years of plant-based milk, yogurt, cheese and seafood-alternative products. The following grocery retailer websites were surveyed: Tesco, Sainsbury’s, Asda, Morrisons, Aldi, Lidl, Waitrose and Ocado. These collectively constitute 88 % of the UK supermarket market share(18) and were chosen to reflect the readily available choices to the majority of British shoppers. Each supermarket was surveyed in December of each year (2020–2024) within 1 to 3 d to avoid any changes in product stock.
To ensure all available products were identified, the retailer’s online shopping website was used. The online search was first done using the drop-down menu on websites to identify ‘plant-based’, ‘vegan’ or ‘free-from’ categories. To capture all dairy products, and in the case of websites without a drop-down menu, the search bar was used for the following terms: ‘vegan milk’, ‘milk alternative’, ‘plant-based milk’ and ‘dairy-free milk’. The search was repeated, substituting ‘milk’ for either ‘cheese’ or ‘yogurt’. To identify seafood-alternative products, the search terms used were ‘vegan fish’, ‘fish alternative’, ‘fishless’, ‘plant-based fish’ and ‘fish-free’. For retailers without complete online shopping websites (Lidl and Aldi), in-store data were collected from food packaging in stores in South-East England, including nutritional information and ingredient lists. Plant-based milk, cheese and yogurt alternatives from both the refrigerated and long-life sections were included in the survey, where their intended use was similar to cow’s milk. Plant-based seafood alternative products from both the refrigerated and frozen sections were included. Products excluded from the survey were (i) products that were not sold as replacements to dairy products (i.e. coconut water and canned coconut milk), (ii) products aimed at children under one-year-old and (iii) products that were part of a composite meal (e.g. plant-based pizza with cheese-alternative topping).
Data extraction from product label
Data extraction was conducted independently by at least two researchers each year to ensure accuracy. Information was taken from the online product information or product packaging. A screenshot was taken from the retailer/manufacturer’s website, or a photograph of the commercial packaging was taken in-store. If more than one retailer sold a product, the data were extracted only once. The product name and brand were recorded. Data on nutrient content were extracted from the nutritional label (per 100 g); this included energy, macronutrients and, where available, calcium, iodine, riboflavin and vitamins B12 and D. The ingredient list was also checked for fortification with iodine (and other nutrients). We classified a product as iodine-fortified if potassium iodide/iodate was listed in the ingredients and the nutritional information indicated iodine content (> 0 μg/100 g). Products containing iodised salt or seaweed were not classified as iodine-fortified because, in the absence of declared iodine content, the iodine contribution from these ingredients is variable and cannot be reliably quantified.
Milk and yogurt alternatives were categorised by the main plant ingredient (e.g. soya/almond). The cheese replacement type was also noted for cheese alternatives (i.e. soft/hard cheese). Whether products were fresh or frozen was noted for the seafood alternatives. The products were also categorised based on whether they were organic, sweetened (for milk/yogurt) or fortified with at least one micronutrient. Results for organic and non-organic products were reported separately because organic product regulations do not allow the use of fortificants that are not required by law, meaning that many organic products will not contain micronutrients that non-organic equivalents may have added.
Data and statistical analysis
Data were collated, manually de-duplicated and cleaned in Microsoft Excel(19). Descriptive statistics were used to describe product characteristics in each survey year. Data presented are median and interquartile range due to the non-parametric nature of the data, as assessed by the Shapiro–Wilk test. A Mann–Whitney U test was used to compare the micronutrient concentration of conventional cow’s milk products or seafood products with their equivalent PBA. Differences between survey years were evaluated using the Kruskal–Wallis H test, with Bonferroni correction for multiple testing. All statistical analyses were performed using R environment for statistical computing(Reference Chalupa-Krebzdak, Long and Bohrer20). Significance was set at P < 0·05.
Results
Plant-Based products identified
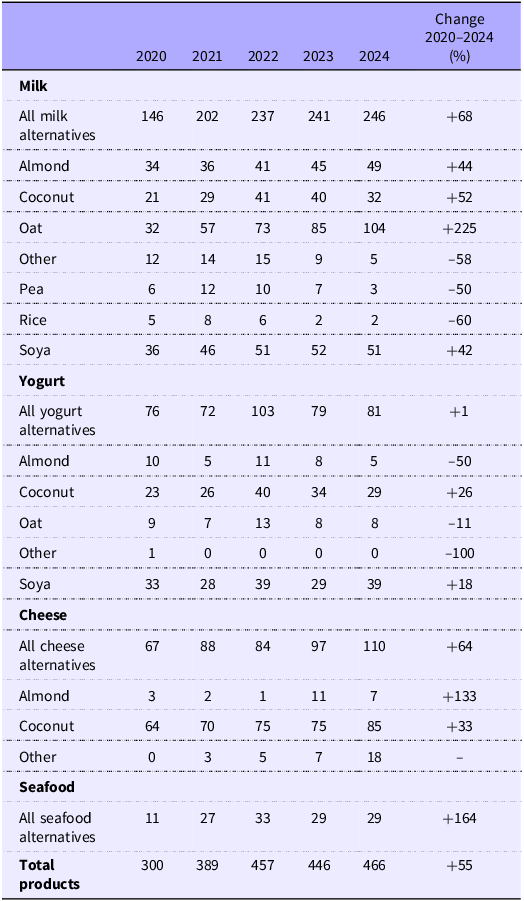
The total number of PBA and category breakdowns are shown in Table 1. In 2024, 466 products were identified, including plant-based milk (n 246), yogurt (n 81), cheese (n 110) and seafood alternatives (n 29), reflecting a 55 % increase since 2020.
Changes in product numbers and types of plant-based milk, yogurt, cheese and seafood alternatives on the UK market between 2020 and 2024

Among plant-based milk alternatives, oat-based drinks were most common (n 104; 42 %), followed by soya-based (n 51; 21 %), almond-based (n 49; 20 %), coconut-based (n 32; 13 %), ‘other’ seed/nut-based (n 5; 2 %), pea-based (n 3; 1 %) and rice-based (n 2; < 1 %). The total number of milk alternatives has increased by 68 % since 2020, with oat-based drinks showing the highest growth (+225 %). However, rice-based (–60 %) and ‘other’ drinks (–58 %) declined. In 2024, 29 % (n 72) were sweetened (v. 23 % in 2020), 16 % (n 39) were organic (v. 28 % in 2020) and 74 % (n 182) were fortified with at least one micronutrient (v. 72 % in 2020).
In 2024, eighty-one plant-based yogurt alternatives were identified, up from seventy-six in 2020 (+1 % change). Soya-based products remained most common (n 39; 48 %), followed by coconut-based (n 29; 36 %) and oat-based (n 8; 10 %). Flavoured plant-based yogurt alternatives comprised the majority of the market each survey year (69–78 %). In 2024, 110 plant-based cheese alternatives were identified, representing a 64 % increase since 2020, with most products using coconut oil as the base ingredient (77–95 %). Among these, 30 % (n 33) mimicked soft/fresh-style cheese (e.g. cream cheese and mozzarella), 39 % (n 43) Cheddar and 31 % (n 34) other styles (e.g. parmesan). The number of plant-based seafood alternatives grew from 11 in 2020 to 29 in 2024 (+164 % change). In 2024, 55 % (n 16) were breaded white fish alternatives, 31 % (n 9) were intended to replace oily fish and 14 % (n 4) to replace other seafood. In 2020, all products were breaded white fish alternatives.
Changes in micronutrient fortification
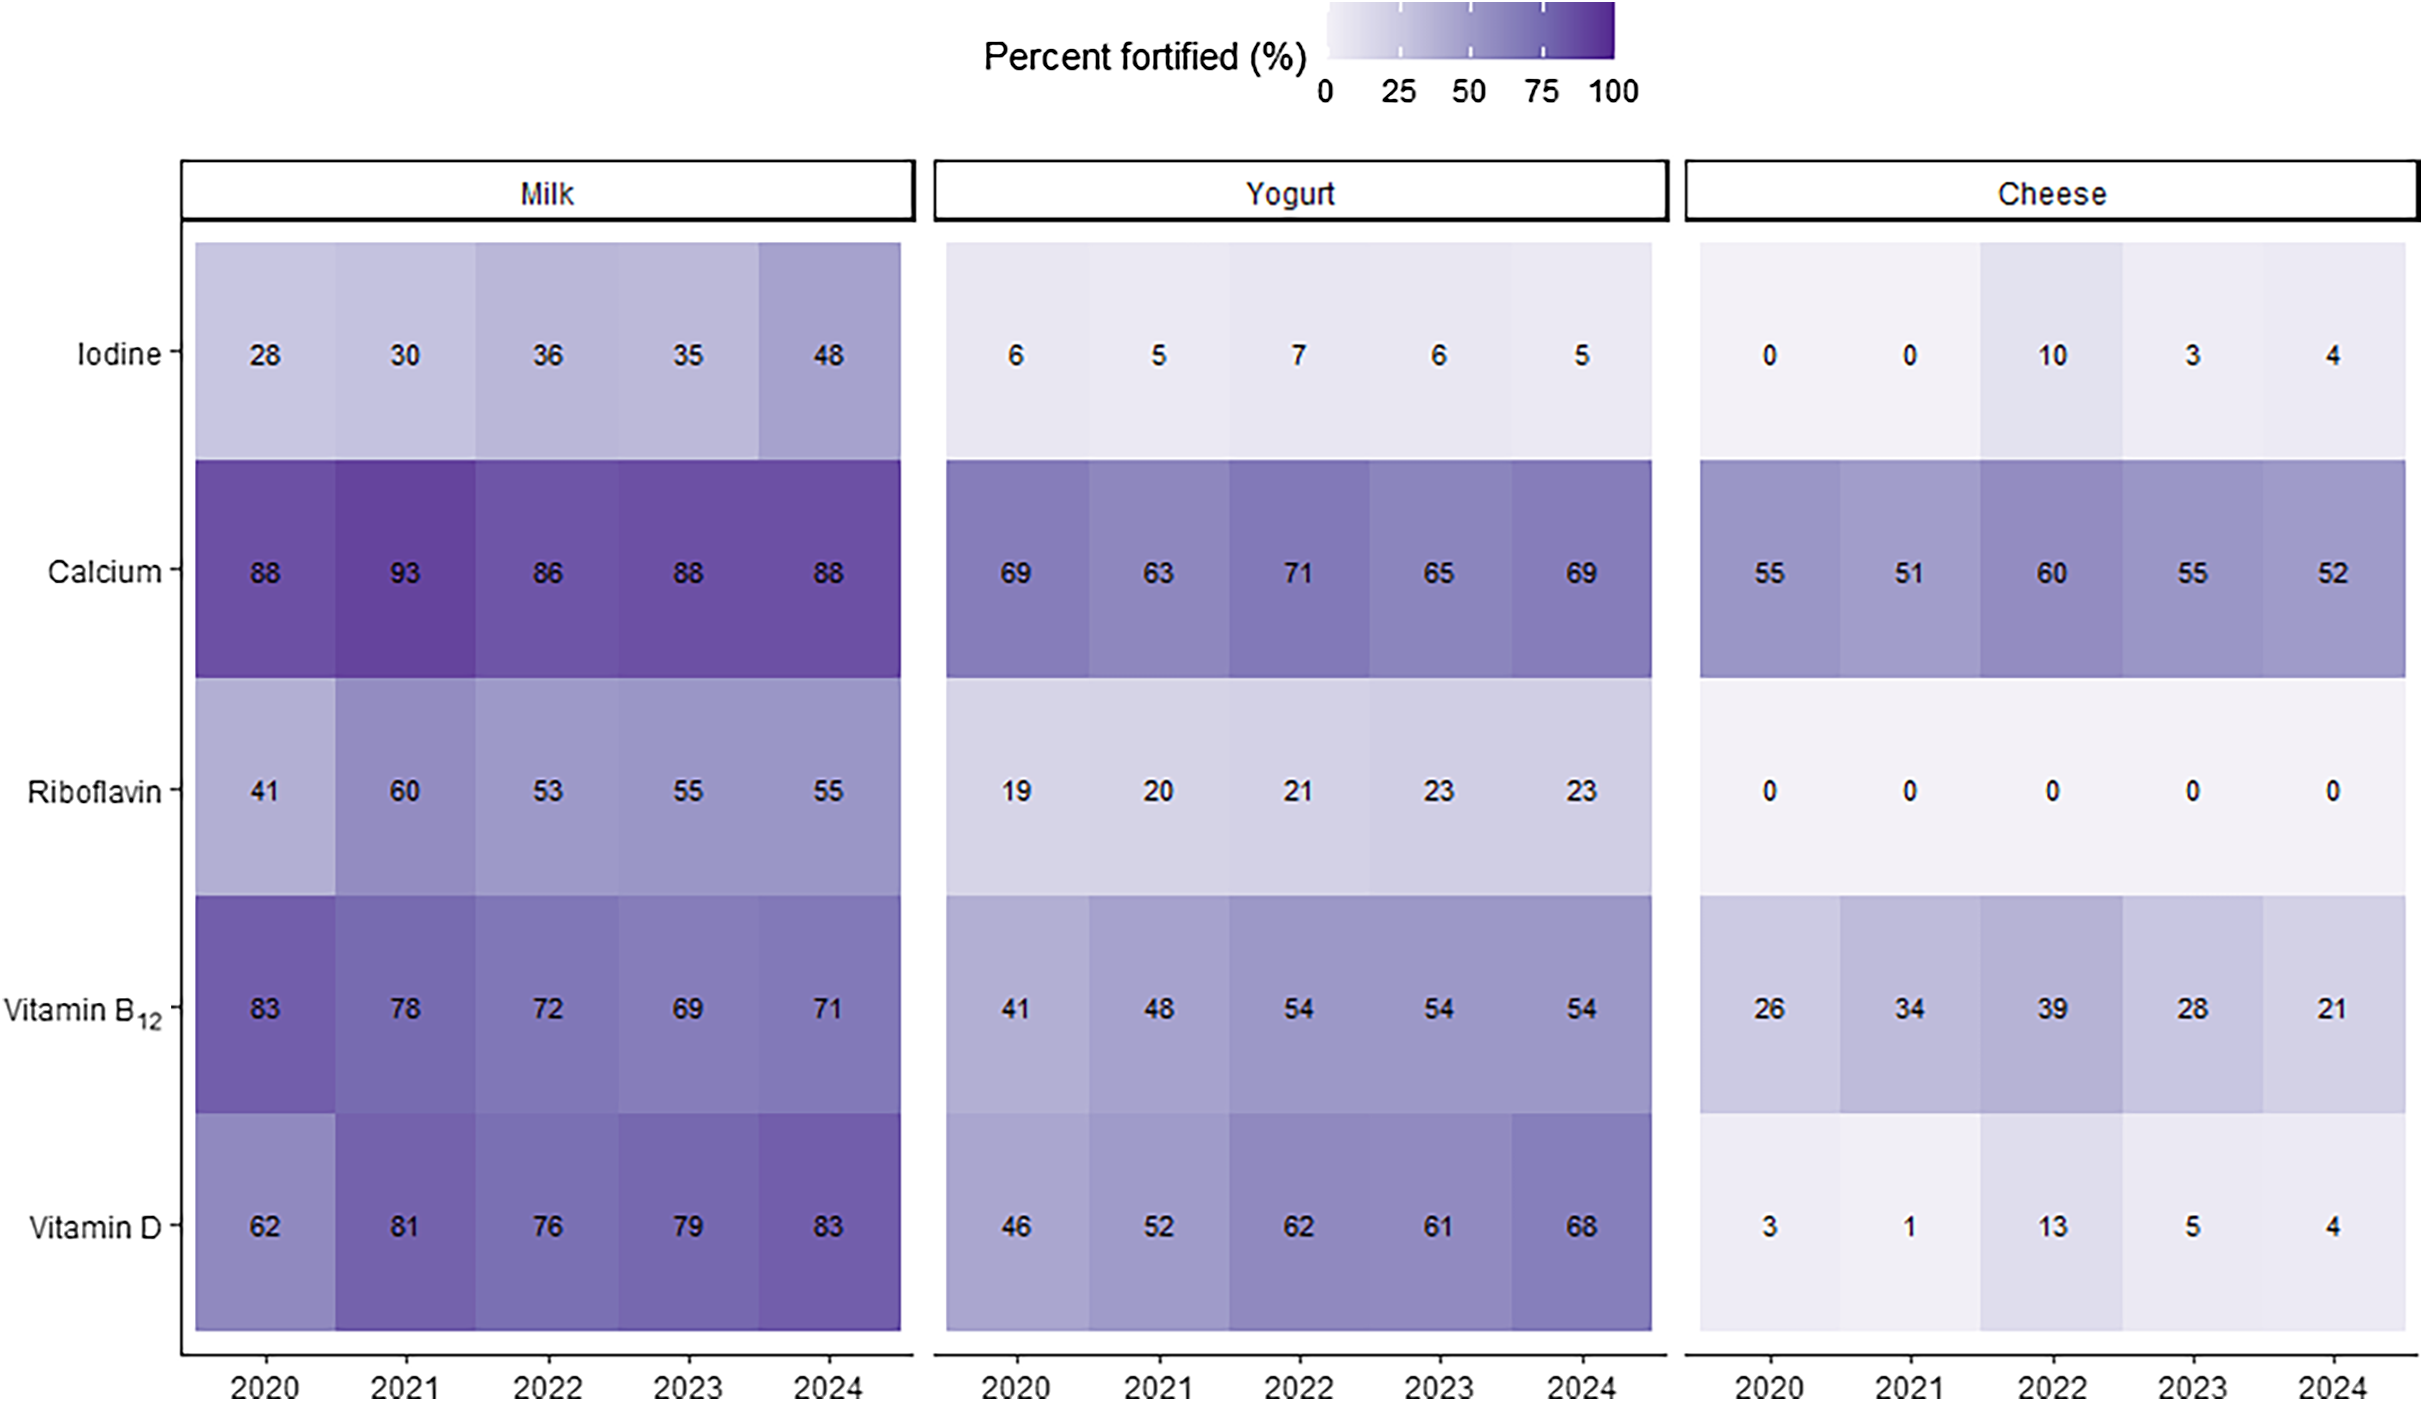
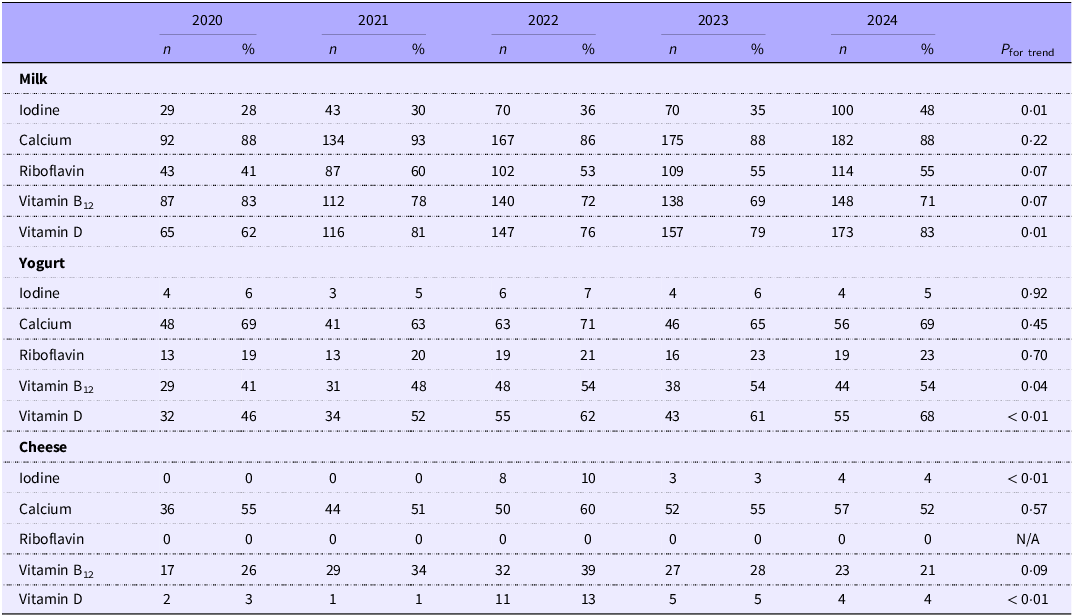
After excluding organic products, in 2024, 48 % (n 100) of plant-based milk alternatives were fortified with iodine, compared with 88 % (n 182) with calcium, 84 % (n 173) with vitamin D, 71 % (n 148) with vitamin B12 and 55 % (n 114) with riboflavin (Figure 1; Table 2). Oat-based (57 %, n 51) and soya-based (51 %, n 24) drinks were most commonly fortified, while no rice-based or ‘other’ drinks contained iodine. The number of iodine-fortified plant-based milk alternatives increased significantly over the five years, from 28 % in 2020 to a peak of 48 % in 2024 (P = 0·01). Significant changes occurred in vitamin D (P = 0·01) fortification over the five years, peaking at 83 % in 2024. Calcium and riboflavin fortification peaked in 2021, at 93 % and 60 %, respectively, before decreasing to 88 % and 55 %, respectively, in 2024. B12 fortification declined from 83 % in 2020 to 71 % in 2024.
Percentage of non-organic plant-based alternative products fortified with iodine, calcium riboflavin, vitamin B12 and vitamin D available in the UK market between 2020 and 2024.

Number and percentage of non-organic plant-based alternative products fortified with iodine, calcium, riboflavin, vitamin B12 and vitamin D available in the UK market between 2020 and 2024

NA, not applicable.
Differences between survey years were assessed by the Kruskal–Wallis test.
Only 5 % (n 4) of non-organic plant-based yogurts were iodine-fortified in 2024, unchanged from 2020. By contrast, 69 % (n 56) were fortified with calcium, 68 % (n 55) with vitamin D, 54 % (n 54) with B12 and 23 % (n 19) with riboflavin. Significant changes were observed for B12 (P = 0·04) and vitamin D (P < 0·001) fortification but not for iodine, calcium or riboflavin. There was a significant increase in iodine-fortified plant-based cheese alternatives (P < 0·001); iodine-fortified products were first identified in 2022 (n 8, 10 % of the market). However, by 2024, due to product discontinuation, only 4 % of products (n 4) were iodine-fortified. In 2024, 52 % of the cheese alternatives contained calcium and 21 % contained B12; no riboflavin-fortified cheese-alternative products were identified. No significant changes occurred for calcium, riboflavin, or B12. Between 2020 and 2024, no plant-based seafood alternatives were fortified with any of the micronutrients investigated.
Comparison of concentration in iodine-fortified products with cow’s milk equivalent
Between 2020 and 2024, the level of iodine fortification in plant-based milk alternatives remained stable (11·3–45 µg/100 g; online Supplementary Table 1), with a median of 22·5–24·8 µg/100 g, equivalent to 75–83 % of cow’s milk (median 29·3 µg/100 g, range 20–41 µg/100 g; P = 0·01). In 2024, a 200 g portion of fortified milk alternative provided 45 µg (30 % of adult recommendations) v. 60 µg from cow’s milk; unfortified alternatives would provide approximately 1·2 µg.
Iodine-fortified plant-based yogurt alternatives had a median concentration of 22·5 µg/100 g in 2020–2021 (62 % of cow’s milk yogurt, median 36·5 µg/100 g, range 17·0–63·0 µg/100 g). New fortified products in 2022 increased the median to 45 µg/100 g, but it fell to 33·6 µg/100 g in 2024 (92 % of cow’s milk yogurt). A 150 g portion of fortified yogurt provided 50 µg (33 % of adult recommendations), similar to cow’s milk yogurt, while unfortified versions contained approximately 1·3 µg.
From 2022 to 2024, iodine-fortified plant-based cheese alternatives had a median concentration of 45 µg/100 g, 153 % of cow’s milk cheese (median 29·5 µg/100 g, range 4·0–72·0 µg/100 g). A 30 g portion provided 13·5 µg, while unfortified versions contained approximately 0·3 µg. No iodine-fortified seafood alternatives were identified. Conventional processed fish products contain approximately 106 µg/100 g (average for fried/baked coated white fish, e.g. fish fingers).
Comparison of concentration in products fortified with other micronutrients with cow’s milk equivalent
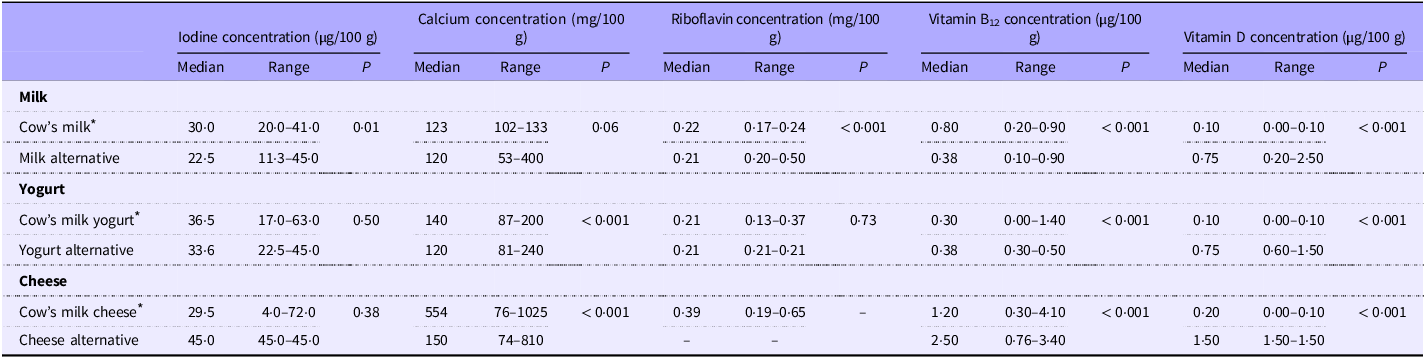
In 2024, calcium fortification in plant-based milk alternatives ranged from 53 to 186 mg/100 g, with a median similar to cow’s milk (120 v. 123 mg/100 g; Table 3). However, median calcium levels in plant-based yogurt (120 v. 140 mg/100 g) and cheese (150 v. 554 mg/100 g) were significantly lower (P < 0·001). In 2023, riboflavin and B12 concentrations in fortified plant-based milk alternatives were 95 % (0·21 mg/100 g) and 48 % (0·38 µg/100 g) of cow’s milk (P < 0·001). Vitamin D fortification in plant-based milk (0·75 v. 0·10 µg/100 g), yogurt (0·75 v. 0·10 µg/100 g) and cheese (1·50 v. 0·20 µg/100 g) was significantly higher than in cow’s milk products (P < 0·001).
Median and range of concentrations of iodine, calcium, riboflavin and vitamin B12 in fortified plant-based milk, yogurt and cheese-alternative products (per 100 g) fortified with each nutrient in 2024. Nutrient values for cow’s milk products are given for comparison

Comparison of the nutrient content of plant-based alternatives with that of cow’s milk products of the same category assessed by the Mann–Whitney U test.
–, values not available.
* Values from UK food tables(Reference Finglas, Roe and Pinchen9).
Discussion
This study underscores a critical gap in iodine fortification within the rapidly expanding market for plant-based dairy products and seafood alternatives. While PBA are becoming more widely available, most in the UK remain unfortified with iodine. Even among non-organic products (i.e. those eligible for fortification), only 26 % of all the PBA (milk/yogurt/cheese/fish) identified in 2024 contained iodine. This low rate of fortification, coupled with the increasing adoption of plant-based diets, raises concerns about adequate iodine intake for consumers transitioning away from animal-source foods.
The findings of this study reveal a growing yet inconsistent commitment to iodine fortification compared with earlier surveys(Reference Clegg, Tarrado Ribes and Reynolds8,Reference Sumner and Burbridge21) . Although the proportion of iodine-fortified plant-based milk alternatives has increased compared with earlier surveys, fortification rates remain significantly lower than for other micronutrients like calcium and vitamin B12. Additionally, fortification varies by beverage type: no rice-based drinks contained iodine, whereas oat- and pea-based drinks were more likely to be fortified. However, since pea-based drinks represent a small market share, their contribution to iodine intake is minimal. Furthermore, iodine fortification is nearly absent in plant-based cheese and yogurt alternatives, and no fortified seafood alternatives were identified. This is particularly concerning given the critical role that seafood and dairy products play in iodine provision within the UK diet(Reference Bath, Verkaik-Kloosterman and Sabatier22).
Similar trends are observed internationally, with iodine fortification in plant-based milk alternatives remaining rare across many countries(Reference Chalupa-Krebzdak, Long and Bohrer20,Reference Zhang, Hughes and Grafenauer23–Reference Dahl, Naess and Aakre28) . While most market surveys do not report iodine content, Australian(Reference Zhang, Hughes and Grafenauer23) and Norwegian(Reference Dahl, Naess and Aakre28) surveys noted minimal fortification, and an Italian study found no micronutrient fortification at all(Reference Angelino, Rosi and Vici25). In some European countries, such as France(29), regulations restrict iodine fortification to the use of iodised salt, which limits manufacturers’ ability to fortify PBA. These regulatory constraints may act as a barrier to fortification more broadly, particularly for brands that supply products across multiple European markets and therefore must align with the most restrictive policies.
Among iodine-fortified plant-based milk alternatives in 2024, the median iodine concentration was 22·5 µg/100 g, comparable to the lower range of iodine levels in UK cow’s milk (20–41 µg/100 g)(Reference Finglas, Roe and Pinchen9). However, this concentration exhibits variability, with some fortified products containing less iodine than cow’s milk, while others approach the higher end of the range. Notably, the iodine content of cow’s milk can fluctuate seasonally(Reference Tattersall, Peiris and Arai30), with UK milk generally having a higher concentration than milk from other countries(Reference van der Reijden, Zimmermann and Galetti31). In some regions, such as the Netherlands and New Zealand(Reference van der Reijden, Zimmermann and Galetti31), the iodine concentration of fortified plant-based milk alternatives identified in this study may exceed that of locally available cow’s milk.
Although PBA to iodine-rich foods have been available for many years, there has been a rapid rise in the availability and variety of plant-based options. The persistently low rates of iodine fortification raise concerns, particularly as more people adopt vegan or plant-based diets(Reference Bath, Hill and Infante17) or take flexitarian approaches. Vegans are at a higher risk of iodine deficiency, with studies consistently showing marginal or inadequate iodine intake in this group(Reference Eveleigh, Coneyworth and Avery32). Young women, the demographic most likely to follow plant-based diets(33), are of particular concern, as UK data already indicate iodine insufficiency among women of reproductive age(15). Switching to unfortified alternatives could further exacerbate this issue, increasing the risk of deficiency-related health consequences. Importantly, consumers who deliberately choose organic or minimally processed products may be at additional risk of iodine deficiency, as organic products are typically not eligible for fortification under UK and EU regulations(34). Although the proportion of organic PBA decreased from 28 % in 2020 to 16 % in 2024, individuals who preferentially select organic products for health or environmental reasons may unknowingly forgo a key dietary source of iodine, highlighting that the risk is primarily linked to consumer awareness rather than absolute market limitations.
Previous research has also shown that exclusive consumers of plant-based milk alternatives are more likely to experience insufficient iodine intake and low iodine status in comparison to cow’s milk consumers(Reference Dineva, Rayman and Bath35). This study is based on data from Years 7 and 8 (2014–2016) of the UK NDNS(36), during which the vast majority of plant-based drinks available were unfortified with iodine. Therefore, this highlights two main priorities: first, to increase the proportion of plant-based products fortified with iodine, and second, to conduct updated research on iodine status among consumers, especially as the plant-based market continues to expand and diversify.
Lack of standardised iodine fortification poses challenges for both consumers and public health. Many consumers are unaware of iodine’s importance or which foods provide it. Previous research has highlighted a widespread lack of public awareness about iodine and iodine-rich foods(Reference Combet, Bouga and Pan37,Reference O’Kane, Pourshahidi and Farren38) , with many individuals unaware of the importance of iodine or of the foods that provide it(Reference O’Kane, Pourshahidi and Farren38). For example, over half of mothers surveyed in Scotland incorrectly identified vegetables (54 %) and salt (21 %) as iodine-rich foods(Reference Combet, Bouga and Pan37). Consumers unaware of iodine in cow’s milk may not recognise the need to ensure alternative sources when making dietary changes. Moreover, iodine content is frequently omitted from nutritional labels, making it difficult for consumers to make informed choices. Only 8 % of UK cow’s milk labels declare iodine content, compared with 59 % listing calcium(Reference Clegg, Tarrado Ribes and Reynolds8). Without clear labelling, consumers may unknowingly select iodine-deficient alternatives. Beyond consumer awareness, market instability further complicates access to iodine-fortified options. Many fortified products disappear from shelves within a short time, raising concerns about long-term availability and the ability of consumers to access suitable products consistently.
However, this study provides the most up-to-date assessment of iodine fortification in UK PBA but has some limitations. First, iodine concentrations were derived from product labels rather than laboratory analysis. Second, the survey did not include independent retailers, health food stores or cafes, meaning niche products may be underrepresented. Third, the bioavailability of iodine in fortified PBA is currently unknown(39) and may vary depending on the iodine compound used and the product matrix. Finally, as a cross-sectional analysis, the findings reflect the current market landscape; changes in fortification practices over time will require ongoing monitoring.
This study highlights a persistent gap in iodine fortification, making PBA nutritionally inequivalent to conventional dairy products and seafood products in terms of iodine provision. Consumers replacing these foods with unfortified alternatives risk inadequate iodine intake, a growing concern as plant-based diets become more popular(40). To address this, clearer labelling and stronger policies encouraging iodine fortification are needed. Without such measures, plant-based consumers, especially young women, remain vulnerable to iodine insufficiency and its serious health consequences, including thyroid dysfunction and adverse pregnancy outcomes.
Supplementary material
For supplementary material/s referred to in this article, please visit https://doi.org/10.1017/S0007114526106758
Acknowledgements
K.N. was supported by the Biotechnology and Biological Sciences Research Council FoodBioSystems (BB/T008776/1). The funder had no role in the design, analysis or writing of this article.
K. N. and S. C. B designed the study. K. N. collected and reviewed data in each year of the study and conducted the data and statistical analysis. E-L. T. collected data in 2020; J. W., R. S., D. B. and L. S. collected data in 2021; F. W. and L. H. collected data in 2022; and H. B., H. T. and D. G. R. collected data in 2023. K. N., A. P. N., J. V. W. K. H. H. and S. C. B. interpreted the data. K. N. wrote the first draft of the manuscript; all authors edited and approved the final manuscript.
S. C. B. has received an honorarium from Oatly UK and Dairy UK for delivering webinars and online videos to healthcare professionals. A.N. has received an honorarium from Dairy Council NI for delivering a lecture to healthcare professionals. Other authors have no conflicts of interest to declare.


 Open access