




Introduction
Many phonetic and phonological variables can be captured reasonably well by a single acoustic correlate. For instance, vowel quality can be characterized according to the first formant (F1) frequency, which inversely correlates with tongue height, and the second formant (F2) frequency, which directly correlates with tongue advancement. Similarly, the place of articulation of /s/ can be characterized by spectral center of gravity, which correlates with frontness. Yet all variables in the domain of sound are phonetically multidimensional, and such multidimensionality can be both structurally and socially significant. With regard to the former, vowel classes typically contrast in terms of tongue position, but secondary phonetic characteristics like voice quality (DiPaolo & Faber, Reference DiPaolo and Faber1990) and duration (Labov & Baranowski, Reference Labov and Baranowski2006; Wassink, Reference Wassink2001) can play nontrivial roles in maintaining vowel distinctions in both production and perception. Regarding the latter, there is no doubt that the frontness of /s/ is socially significant, as scholars have offered ample evidence of its associations with gender (Stuart-Smith, Reference Stuart-Smith, Cole and Hualde2007; Zimman, Reference Zimman2017b), sexuality (Munson, Reference Munson2007; Zimman, Reference Zimman2013), and relation to urbanity (Campbell-Kibler, Reference Campbell-Kibler2011). Nevertheless, other phonetic dimensions that characterize any given instance of /s/, such as intensity, can give rise to different indexical possibilities, including “fierceness” (Calder, Reference Calder2019:350) and “sharpness” (Kajino, Reference Kajino2014:128). This paper examines another type of variable that is best understood by attending to multiple phonetic dimensions: creaky voice. We argue that for phonatory variables, it is necessary to consider the incidence of a particular phonation type in conjunction with, minimally, acoustic features that characterize degrees of glottal constriction and periodicity to best understand voice quality variation in a community.
The social distribution of creaky voice
Understanding the social distribution of creaky voice is crucial for evaluating the widespread ideology that creak is on the rise and most prevalent among young (cisgender) women (though we will argue in the following section that the quantitative patterning of creaky voice is not the only consideration). Yet, as Dallaston and Docherty (Reference Dallaston and Docherty2020) emphasized, studies that can empirically establish whether young women lead in the use of creaky voice are lacking, since speaker samples in previous work have been insufficiently diverse to isolate age- and gender-based patterns.
The great majority of studies investigating the social distribution of creaky voice have sampled the speech of young women (Abdelli-Beruh et al., Reference Abdelli-Beruh, Wolk and Slavin2014; Benoist-Lucy & Pillot-Loiseau, Reference Benoist-Lucy and Pillot-Loiseau2013; Borrie & Delfino, Reference Borrie and Delfino2017; Cantor-Cutiva et al., Reference Cantor-Cutiva, Bottalico and Hunter2018; Henton & Bladon, Reference Henton, Bladon, Hyman and Li1988; Luthern & Clopper, Reference Luthern and Clopper2015; Melvin & Clopper, Reference Melvin and Clopper2015; Oliveira et al., Reference Oliveira, Davidson, Holczer, Kaplan and Paretzky2016; Podesva, Reference Podesva2013; Wolk et al., Reference Wolk, Abdelli-Beruh and Slavin2012; Yuasa, Reference Yuasa2010), with most showing that young women use creaky voice often. However, a minority of these studies contrast the speech of young women to that of young men (Abdelli-Beruh et al., Reference Abdelli-Beruh, Wolk and Slavin2014; Becker et al., Reference Becker, Khan and Zimman2022; Henton & Bladon, Reference Henton, Bladon, Hyman and Li1988; Melvin & Clopper, Reference Melvin and Clopper2015; Podesva, Reference Podesva2013; Yuasa, Reference Yuasa2010), and fewer still sample speakers other than young adults (Oliveira et al., Reference Oliveira, Davidson, Holczer, Kaplan and Paretzky2016; Podesva, Reference Podesva2013). So even though previous work has shown that creaky voice is prevalent in the speech of young women, claims that young women creak more than others are not tenable without direct comparisons among individuals with differing gender identities or among women of different ages.
A few production studies have noted the prevalence of creak in the speech of men and older women. Henton and Bladon (Reference Henton, Bladon, Hyman and Li1988) reported that men in two varieties of UK English use higher rates than women in these varieties. And Pratt (Reference Pratt2021:1) showed that adolescent young men in a California school for the performing arts also use high rates, especially those described as “chill”; she argued that creaky voice serves as a resource for constructing not gender per se, but affect. Studies have also reported that middle-aged and older women produce creaky voice at rates similar to those of young women (Oliveira et al., Reference Oliveira, Davidson, Holczer, Kaplan and Paretzky2016; Podesva, Reference Podesva2013).
While an empirical examination of whether young women are leading a rise in creak use minimally requires a gender- and age-diverse sample, at least two additional sampling considerations must be taken into account. First, studies should control for regional variety (Henton & Bladon, Reference Henton, Bladon, Hyman and Li1988; Melvin & Clopper, Reference Melvin and Clopper2015; Podesva, Reference Podesva2013; Pratt, Reference Pratt2021; Yuasa, Reference Yuasa2010), as dialects can be distinguished in part based on phonatory properties. Henton and Bladon (Reference Henton, Bladon, Hyman and Li1988), for example, reported higher rates of creak among Northerners in the UK compared to speakers of Received Pronunciation. Further, studies should attend to speakers’ ethnoracial identities. While Podesva (Reference Podesva2013) reported no differences between African American and white speakers in Washington, DC, in terms of creaky voice use, differences between these groups arise for other phonation types, such as falsetto. And Mendoza-Denton (Reference Mendoza-Denton2011) discussed how creaky voice is recruited in the construction of Chicanx character types in mass-mediated contexts. Outside of an American context, ethnicity-based variation in voice quality has also been described in New Zealand (Szakay, Reference Szakay2012), Australia (White et al., Reference White, Penney, Gibson, Szakay and Cox2024), and England (specifically London in Szakay & Torgersen, Reference Szakay and Torgersen2015).
Methodological approaches
Apart from issues of sampling, previous studies have been unable to collectively shed light on the social distribution of creak because they employ a diversity of methods that preclude cross-study comparisons. Studies typically use a combination of auditory and acoustic methods to determine the onset and offset of creaky intervals, or to determine whether any given syllable or word has been uttered with any amount of creak. Studies then report on the percentage of vowels (Becker et al., Reference Becker, Khan and Zimman2022), syllables (Henton & Bladon, Reference Henton, Bladon, Hyman and Li1988; Luthern & Clopper, Reference Luthern and Clopper2015; Melvin & Clopper, Reference Melvin and Clopper2015; Podesva, Reference Podesva2013; Pratt, Reference Pratt2021), words (Yuasa, Reference Yuasa2010), or units of time irrespective of linguistic constituent (Benoist-Lucy & Pillot-Loiseau, Reference Benoist-Lucy and Pillot-Loiseau2013; Borrie & Delfino, Reference Borrie and Delfino2017; Oliveira et al., Reference Oliveira, Davidson, Holczer, Kaplan and Paretzky2016) containing creak. Occasionally, studies will supplement these reports with descriptions of acoustic properties of creaky intervals of speech (Wolk et al., Reference Wolk, Abdelli-Beruh and Slavin2012).
The aforementioned methods are time-intensive and introduce considerable room for cross-rater and cross-study variability in identifying creaky voice. Dallaston and Docherty (Reference Dallaston and Docherty2020) recommended using replicable, largely automated methods for quantifying creak to promote replicability and enable comparability across studies. We use such methods here and provide additional details about what phonetic dimensions should be captured at the conclusion of this section.
Another consequence of the labor-intensive coding practices characteristic of previous studies is relatively small sample sizes, as all but three of those reviewed here (Becker et al., Reference Becker, Khan and Zimman2022; Henton & Bladon, Reference Henton, Bladon, Hyman and Li1988; Oliveira et al., Reference Oliveira, Davidson, Holczer, Kaplan and Paretzky2016) consider the speech of fewer than 40 speakers. (Just coding phonation type for the 32 speakers considered in Podesva (Reference Podesva2013) took a team of 4 coders more than a full year.) Although samples of this size would not be considered small as a rule, they are small in the context of a study that requires a diverse sample of the sort described. Automated methods would enable larger sample sizes, which would not only facilitate more conclusive generalizations but also have the potential to promote inclusion by incorporating a greater diversity of speakers.
Previous studies on the social distribution of creaky voice also exhibit a diversity of data types. These range from controlled materials, including sustained vowels in isolation (Abdelli-Beruh et al., Reference Abdelli-Beruh, Wolk and Slavin2014; Wolk et al., Reference Wolk, Abdelli-Beruh and Slavin2012), read sentences (Abdelli-Beruh et al., Reference Abdelli-Beruh, Wolk and Slavin2014; Henton & Bladon, Reference Henton, Bladon, Hyman and Li1988; Wolk et al., Reference Wolk, Abdelli-Beruh and Slavin2012), and reading passages (Becker et al., Reference Becker, Khan and Zimman2022; Benoist-Lucy & Pillot-Loiseau, Reference Benoist-Lucy and Pillot-Loiseau2013; Borrie & Delfino, Reference Borrie and Delfino2017; Luthern & Clopper, Reference Luthern and Clopper2015; Melvin & Clopper, Reference Melvin and Clopper2015), to spontaneous speech, including monologic speech (Oliveira et al., Reference Oliveira, Davidson, Holczer, Kaplan and Paretzky2016), unscripted conversation (Yuasa, Reference Yuasa2010), and sociolinguistic interviews (Becker et al., Reference Becker, Khan and Zimman2022; Podesva, Reference Podesva2013; Pratt, Reference Pratt2021). While read speech of course has an important place in both phonetic and sociolinguistic research, it may not be the ideal place to examine creaky voice. Past studies have argued that creaky voice is a means of constructing “chill” affect (Pratt, Reference Pratt2021:1) or an aloof or stoic persona (Zimman, Reference Zimman2017a), and speakers are less likely to engage in interactional work of this sort when reading scripted materials. While few previous studies have sought to quantify the effects of data type on the realization of creak, Benoist-Lucy and Pillot-Loiseau (Reference Benoist-Lucy and Pillot-Loiseau2013) and Becker et al. (Reference Becker, Khan and Zimman2022) reported that creaky voice is more prevalent in spontaneous than read speech. Since the goal of this study is to investigate creaky voice in as close to its “real world” forms as possible, we examine unscripted, conversational speech, namely sociolinguistic interviews.
The decision to use unscripted conversation as data necessarily means that linguistic factors affecting phonation will introduce a great deal of variation that underlies variation attributable to social factors. One of the most important internal constraints is phrase position.Footnote 1 It has long been noted that creak occurs more commonly at the ends of phrases (Henton & Bladon, Reference Henton, Bladon, Hyman and Li1988), a finding that has been replicated often (Becker et al., Reference Becker, Khan and Zimman2022; Luthern & Clopper, Reference Luthern and Clopper2015; Podesva, Reference Podesva2013). This paper aims to identify and operationalize the most important internal constraints on creaky phonation so that they can be accounted for systematically in future work using uncontrolled conversational data. We direct the reader to Becker et al. (Reference Becker, Khan and Zimman2022), who additionally attended to several linguistic predictors of creaky voice.
Phrase position is also noteworthy from a sociolinguistic perspective because studies have noted the stylistic use of creak when it occurs in unfavored, nonfinal position (Callier, Reference Callier2011; Podesva, Reference Podesva2007). For example, D’Onofrio et al. (Reference D’Onofrio, Hilton and Pratt2013) compared the speech of the most burned-out burnout and the most squeaky-clean jock in Eckert’s (Reference Eckert2000) data and found that even though both girls used creak phrase-finally, the burnout used nonfinal creak more often. As we will show here, once we shift our focus to phrase position, we are able to observe that social factors mediate phrase position effects, or vice versa. We will show that the increase in the use of creaky voice is due not only to young people creaking more in favored prosodic environments (i.e., phrase-finally) but also to the expansion of the prosodic environments where creaky voice is licensed (i.e., creaking earlier in the phrase).
In short, we advocate like Dallaston and Docherty (Reference Dallaston and Docherty2020) for an approach that examines a large, age-diverse sample of speakers. We further recommend controlling for dialect region (inland California, for our purposes), analyzing conversational data (sociolinguistic interviews, here) that allow for wide-ranging expressions of affect, and taking account of internal constraints on creak’s use, including but not limited to phrase position.
The phonetic multidimensionality of creaky voice
A final consideration is how to quantify the realization of phonation type—the dependent variable itself. We argue that it is necessary to appeal to acoustic methods because doing so enables us to capture the diversity of phonetic qualities that fall under the umbrella of the cover term, “creak.” As Keating et al. (Reference Keating, Garellek and Kreiman2015) discussed, the label “creak” is used for a host of distinct phonetic qualities, including prototypical creak, vocal fry, and non-constricted creak, for example. The term “vocal fry” in its technical sense refers to a mode of phonation with relatively high glottal constriction but without irregular periodicity. So even though “vocal fry” is commonly used as a synonym for creaky voice in the popular media and even in published work on creaky voice, strictly speaking, it represents a particular mode of phonation distinct from others that would accurately be considered creaky. Each type of creak is characterized by a different set of phonetic properties, as summarized in Table 1, a simplification of the table in Keating et al. (Reference Keating, Garellek and Kreiman2015). Importantly, there is no one acoustic property that distinguishes all types of creak from one another. Still, all creak types can be differentiated by attending to a few phonetic properties, such as the three presented in Table 1. For example, prototypical creak and vocal fry can be distinguished from one another based on voicing irregularity, which the latter does not exhibit. And non-constricted creak is distinct from all other types by virtue of not being characterized by glottal constriction. Owing to the phonetic multidimensionality of creaky voice, and phonation type more generally, phoneticians have recently pursued empirical approaches that attend to multiple acoustic dimensions (see Garellek (Reference Garellek, Katz and Assmann2019) for a theoretical overview). Keating et al. (Reference Keating, Kuang, Garellek, Esposito and Khan2023), for example, showed that in an extensive acoustic analysis of 11 typologically diverse languages, most phonological distinctions in phonation could be captured in a two-dimensional space that opposes modality (regularity of vocal fold vibration) and degree of glottal constriction (a breathy-to-creaky continuum).
Types of creak and some of their phonetic properties, with primary acoustic correlates (after Keating et al., Reference Keating, Garellek and Kreiman2015)

Table 1 Long description
The table compares six types of creaky voice by whether they show three phonetic properties and their main acoustic correlates: low pitch, irregular voicing, and glottal constriction. Prototypical creak is the only type marked as having all three properties. Vocal fry has low pitch and glottal constriction but not irregular voicing. Multiply pulsed has irregular voicing and glottal constriction but not low pitch. Aperiodic is marked as not having low pitch, but it does have irregular voicing and glottal constriction. Non-constricted has low pitch and irregular voicing but is marked as not having glottal constriction. Tense is marked as not having low pitch and not having irregular voicing, but it does have glottal constriction. The entries indicate presence or absence of properties and should be read as categorical labels rather than precise measurements.
We advocate for a similar approach in investigating the social dimensions of phonation variation that captures creak in at least two ways: by attending to acoustic measures that correlate with glottal constriction (H1*–H2*) on the one hand and irregular voicing (smoothed cepstral peak prominence [CPPS]) on the other.Footnote 2 H1*–H2* is the amplitude of the first harmonic minus the amplitude of the second harmonic, corrected for the inflation of neighboring formant frequencies. This measure of spectral tilt is probably the most widely used acoustic measure of phonation, as it correlates with open quotient, which inversely correlates with the degree of glottal constriction (i.e., low values of this measure are indicative of creakier phonation). While H1*–H2* is an advantageous measure of phonation because it captures a phonetic property that characterizes nearly all types of creak—glottal constriction—it does not capture non-constricted creak. We therefore consider a second acoustic measure that captures the degree of periodicity: CPPS, low values of which are indicative of less periodic phonation. So creakier speech is characterized by lower CPPS values, but it is important to note that the same is true for other non-modal phonation types, such as breathy voice.
Even though the term “creak” subsumes a variety of distinct articulatory configurations that in turn give rise to distinct acoustic qualities, this set of qualities can be experienced by listeners as perceptually similar (Gerratt & Kreiman, Reference Gerratt and Kreiman2001). We therefore employ a method for holistically capturing whether a given unit of speech matches any of the labels in Table 1. We follow the method developed by Kane et al. (Reference Kane, Drugman and Gobl2013), which takes several acoustic measures that quantify periodicity and spectral dimensions of the acoustic signal and uses machine learning techniques to binarily classify tokens of speech as creaky or not. While this method does not differentiate among types of creak, it may approximate at least some listeners’ perceptions of creak. It is also a fully automated method which requires only an audio file as input—so large quantities of speech can be coded both quickly and systematically, avoiding human error.
Importantly, each of the three approaches to quantifying creak used here captures different dimensions of creak and accordingly has the potential to vary independently of one another. All offer valuable information, but each is limited on its own. It is only by taking account of all three in the context of the same study that it is possible to arrive at a comprehensive understanding of creak’s social patterning. In the following section, we establish as a starting point some of the most dominant linguistic ideologies about creaky voice, specifically who is believed to use it the most, by analyzing headlines in popular media. Then, in the remainder of this article, we describe a large-scale study on the social patterning of creaky voice in inland California, present results for each of the three approaches to quantifying creak, discuss the implications of our findings for the widely held belief that creak is on the rise and most prevalent in the speech of young women, and conclude.
Popular ideologies of creaky voice
We proceed in this section by examining popular discourses of creaky voice, as these discourses partly constitute what Silverstein (Reference Silverstein and Mertz1985:220) termed the “total linguistic fact.” The total linguistic fact encompasses not only language forms (creaky voice) and patterns of use (its social distribution) but also ideologies (about who uses it) and domains (who holds such ideologies, and how they shift over time and space). The concept of the total linguistic fact reminds us that ideologies of creak are distinct from patterns of use, and that the latter are not an objective truth that can on their own settle disputes about whether creaky voice indexes “young woman.” Put another way, even robust quantitative evidence that young women do not creak more than others would be insufficient for debunking the myth of the young female creaker. Rather, such a finding would need to be reconciled with ideologies that cast young women as the quintessential users of creaky voice.
Wortham (Reference Wortham2008:43) defined language ideologies as “models that link types of linguistic forms with the types of people who stereotypically use them.” Such models are perhaps most evident in mediatized contexts, which due to their relatively far reach play an important role in the circulation of ideology (Agha, Reference Agha2003, Reference Agha2006). When it comes to creaky voice, the media have promulgated the ideology that it is a distinctively young and feminine vocal practice. Because ideologies are themselves an object of study and should be understood as far from self-evident, we present a small dataset here to more firmly establish those that underlie the use of creaky voice. Table 2 lists 20 articles in popular news sources with “vocal fry” or “creaky voice” in the headline, from a Google News query. It bears mentioning first that modes of vocal fold vibration have hitherto never elicited so much attention in the media (Hornibrook et al., Reference Hornibrook, Ormond and Maclagan2018). Of the 20 headlines, 14 identify a typical user of creaky voice; all 14 of these single out women (n = 6) or young people (n = 1), usually intersectionally as young women (n = 7). As the main function of headlines is to summarize a news story (Iarovici & Amel, Reference Iarovici and Amel1989), these headlines illustrate that what is newsworthy about creaky voice is its use by young women. The fact that creaky voice is referred to as “vocal fry” in the great majority of articles (n = 17), as opposed to “creaky voice” or some variant thereof (n = 5), relates to the other function of headlines: to capture the reader’s attention (Iarovici & Amel, Reference Iarovici and Amel1989). Even though many of the news stories use “creaky voice” in the body of the article, most reserve “vocal fry” for headlines. We posit that this choice may tap into an ideology that “vocal fry” is the product of a life lived to excess. Some of the headlines even suggest that using creaky voice could be physiologically harmful or hurt one’s employment opportunities. In sum, creaky voice is ideologized as a feature of young women’s speech that is, for the most part, evaluated in rather negative terms.
Headlines about creaky voice in popular news sources

Table 2 Long description
The table lists 20 headlines about “vocal fry” or “creaky voice,” giving the news source, publication date, and headline text. Entries span from December 2011 through October 2021, showing recurring coverage over a decade. Early items in 2011 and 2012 (Science, Time, Huffington Post, CNBC) present it as a creeping speech trend and often tie it to women. In 2013 and 2014, coverage expands across outlets such as Slate, The Atlantic, Washington Post, and Business Insider, including pieces about annoyance reactions and claims about hiring and job prospects. Later headlines from 2015 to 2021 (NPR, The Guardian, Wall Street Journal, The Conversation, Pursuit, PsyBlog) continue to focus on “policing” young women’s voices, advice to stop using it, and ongoing polarization. Overall, the headlines suggest a persistent media narrative that frequently gender-codes the voice quality and sometimes links it to professional consequences. Because the table records headlines rather than study results, it reflects media framing and topic emphasis, not the prevalence of vocal fry or the strength of scientific evidence.
While the headlines in Table 2 clearly locate creaky voice in the bodies of young women, they leave other aspects of ideologies about creaky voice more unspoken. Consider the following quotation from an article in Time (Steinmetz, Reference Steinmetz2011):
Singers like Britney Spears slip into vocal fry when hitting low notes or for sultry effect, noted Science NOW’s Marissa Fessenden, characterizing the creak as a ‘language fad.’ Kim Kardashian is guilty of it. So is Zooey Deschanel.
This excerpt avoids even mentioning gender explicitly, instead providing a list of prototypical creakers, like Britney Spears, Kim Kardashian, and Zooey Deschanel. The reader is left to draw their own conclusions about what they have in common. In addition to being considered young (at least at the time the article was published) and women, all are also urban, affluent, and racialized as white (though see Tehranian (Reference Tehranian2020) for a discussion of Kardashian’s racial identity). Language ideologies about creaky voice are thus not only about young women. They are about young, white, upwardly mobile women, and these ideologies themselves have been enregistered into a stereotypical white girl style (Slobe, Reference Slobe2018). Patterns of use, which will be our concern for the remainder of this paper, should be interpreted in light of such ideologies, which we revisit in the discussion of the results.
The study
Communities, speakers, data
The data for this study are sociolinguistic interviews with residents of three communities in California’s Central Valley—Merced (recordings made in September 2010), Redding (September 2011), and Bakersfield (September 2012)—chosen to document a lesser-studied region of the state. Even these larger cities of the Central Valley are generally considered rural, and much of the economy centers around agriculture (farming, livestock) and other industries that rely on land use, such as timber and oil.
Audio recordings of interviews were made by faculty, graduate students, and undergraduates in the Department of Linguistics at Stanford University. Interviews (each about one hour in duration) took place in the field in quiet locations (e.g., homes, libraries, meeting rooms at community gathering places) and were recorded on solid-state recorders (Marantz PMD660, Zoom H2, or Sony PCM-M10) using external lavalier microphones (Audio Technica AT831b, Audio Technica ATPro70).
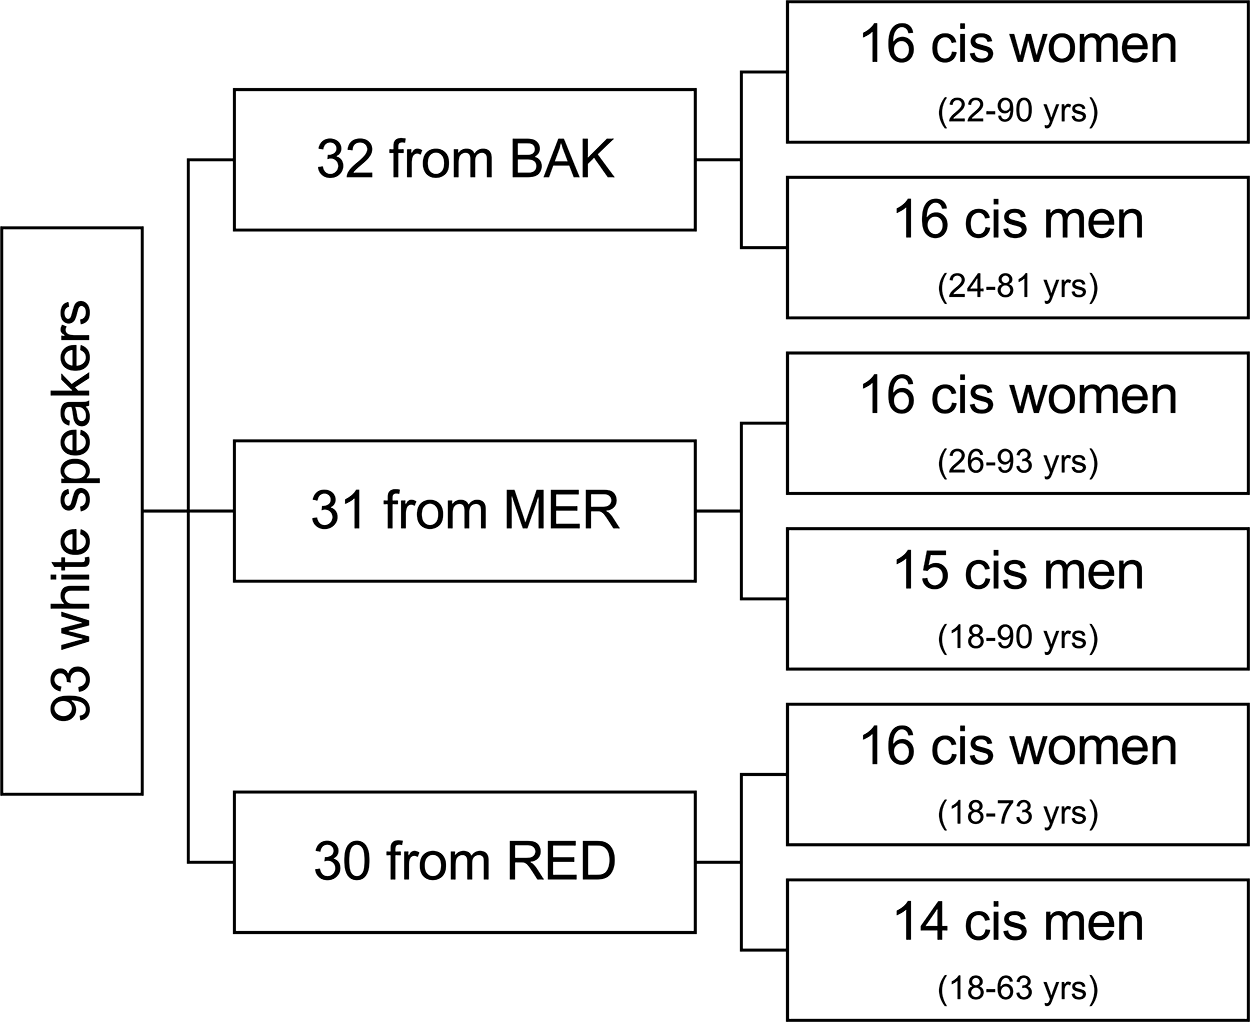
This paper reports on the speech of 93 white speakers, summarized in Figure 1. We sampled roughly equal numbers of speakers across field sites, with roughly equal numbers of cisgender women and men within each. While the larger corpus includes interviews with transgender and nonbinary individuals, we do not examine their speech here, as we did not collect detailed information on speaker gender in a way that would facilitate a sophisticated investigation of gender diversity like the one offered by Becker et al. (Reference Becker, Khan and Zimman2022). We note, nevertheless, that we followed their recommendation to elicit open-ended gender identifications; all speakers here elected to report their gender identities in ways that are consistent with binary identification. Within each field site/gender cell, we include 14-16 speakers distributed across the age range, from young adult to the oldest old (i.e., individuals well beyond the age of retirement). Such age diversity has been mostly lacking from previous studies, despite its importance to questions of whether creak is on the rise and young women use it relatively often (though see Oliveira et al., Reference Oliveira, Davidson, Holczer, Kaplan and Paretzky2016; Podesva, Reference Podesva2013, who included young and middle-aged adults). Finally, each speaker is coded for whether they earn their living off the land, as the social importance of whether people were oriented more to the country or the more urban town emerged over the course of fieldwork in 2010-2012 (Podesva et al., Reference Podesva, D’Onofrio, Van Hofwegen and Kim2015a; Podesva & Van Hofwegen, Reference Podesva, Van Hofwegen, Levon and Mendes2016). A third of the speakers, represented in all cells in Figure 1, rely on the land to earn their living. While many of these speakers would be considered working-class, some are upper-middle-class owners of farms.
Summary of speaker sample in terms of race, community of residence, gender, and age.

Figure 1 Long description
A branching flowchart with connected boxes and split lines. The leftmost box reads 93 white speakers. A set of branching connector lines splits to three boxes, listed from top to bottom as 32 from BAK, 31 from MER and 30 from RED. Each of these three boxes branches to two boxes on the right, listed top to bottom as cis women then cis men. For 32 from BAK: 16 cis women (22-90 yrs) and 16 cis men (24-81 yrs). For 31 from MER: 16 cis women (26-93 yrs) and 15 cis men (18-90 yrs). For 30 from RED: 16 cis women (18-73 yrs) and 14 cis men (18-63 yrs). No decision points or conditional paths are shown.
Before continuing, a note on race is required. In this paper, we consider the speech of white speakers only, as this is the only racial group with a sizable population in each of the three sites. Further, the stereotype of the creaky young woman is typically ideologized as white—so we place our initial focus on white speakers. At the same time, we recognize the problems with and consequences of longstanding exclusionary sampling practices that have been standard even in the field of variationist sociolinguistics. As a result, we commit in future work to examine voice quality patterns among racially minoritized speakers in the Voices of California corpus. Our goal will not be to compare such practices to those of white speakers described in this paper, but rather to understand them in their own right. Creaky voice is a resource available to all speakers of English (and arguably speakers of all languages), and we will not have an adequate understanding of its distribution, to say nothing of its use, until it has been studied for a variety of minoritized groups, racially or otherwise.
Methods
All recordings were orthographically transcribed, and data were force-aligned using FAVE-align (Rosenfelder et al., Reference Rosenfelder, Fruehwald, Evanini and Yuan2011). Using uncorrected alignments, we took several measurements every 1 ms of every vocalic interval using a Praat (Boersma & Weenink, Reference Boersma and Weenink2015) scriptFootnote 3 that functions similarly to VoiceSauce (Shue et al., Reference Shue, Keating, Vicenik and Kristine2011). The current study examines one measure of spectral tilt (H1*–H2*)Footnote 4 and one measure of periodicity (CPPS), although several others were taken. We chose these two measures to ensure that we were attending to more than one articulatory dimension of voice quality variation and to be maximally comparable to previous work. We also measured A1*−P0, as a correlate of nasality (Zellou & Tamminga, Reference Zellou and Tamminga2014), to control for gender differences in harmonic amplification due to the nasal resonance. Finally, we also took measurements of the fundamental frequency (F0)Footnote 5, the first and second formant frequencies (F1 and F2), and intensity as potential predictors of the target variables.
Data were additionally coded binarily as creaky or not using Kane et al.’s (Reference Kane, Drugman and Gobl2013) neural network classifier. The output of the classifier’s MATLAB implementation is a list of time intervals deemed to represent creak in any of its forms. We considered a vowel creaky if any part of its duration overlapped with a classifier-determined creaky interval. It is important to note that, since classifiers make predictions regarding whether speech samples are creaky, they generate both false alarms (non-creaky tokens labeled creaky) and misses (creaky tokens labeled non-creaky). While some scholars (Murton et al., Reference Murton, Shattuck-Hufnagel, Choi and Mehta2019; White et al., Reference White, Penney, Gibson, Szakay and Cox2022) have fine-tuned probability thresholds with promising results, we have opted for a more hands-off approach here assuming that significant patterns will still emerge through the large dataset under consideration.
To make the amount of data manageable, and in an effort to eliminate erroneous measurements, we treated each vowel token as a potential observation. That is, for each acoustic measure, we took the median value across all intervals contained within the bounds of the vowel. We also excluded a number of outliers. We eliminated all vowels shorter than 50 ms and longer than 283 ms. These bounds represent two standard deviations below and above the median log duration for vowels across the dataset. We also excluded all tokens for which the median value of any acoustic measure (within a given vowel class, within a given speaker) lay beyond two standard deviations above or below the median. After exclusions, the total number of vowel tokens considered was 270,623.
Factoring in the effects of phrase position is essential to any analysis of phonation. Though few studies have quantitatively attended to positional effects, Becker et al. (Reference Becker, Khan and Zimman2022) did so by making a binary distinction between vowels in intonational phrase (IP)-final position and those preceding this position. Here, we treat phrase position continuously. Speech was parsed into phrases by identifying pause-bounded units, as described in Voigt et al. (Reference Voigt, Podesva and Jurafsky2014). Then, each vowel’s phrase position was defined as the point in time where the vowel midpoint occurred relative to the start (0) and end (1) of the phrase. The total number of phrases considered was 53,314.
Finally, word frequency was taken based on the in-corpus token count. We opted to use an in-corpus measure of frequency because many place names were uttered frequently in interviews, much of which were focused on the speaker’s experiences in the local community, despite the low frequency of such place names outside of these interviews.
Regarding statistical methods, we constructed three mixed-effects regression models, one for each of our approaches to characterizing creak (linear models for H1*–H2* and CPPS, logistic models for ±creak). Models were stepped up and factors added if they improved the Akaike information criterion (AIC) adjusted to account for different numbers of predictors and levels of predictors (AICc). Each model included several random intercepts (speaker, preceding sound, following sound) and linguistic predictors: F0; F1; F2; vowel duration; intensity; word frequency; phrase position; phrase duration; and A1*−P0. Of these, F0, vowel duration, word frequency, and IP duration were log-transformed to ensure a normal distribution for parametric statistical tests. Continuous variables were scaled and centered. The social factors under consideration, on their own and in interaction, were as follows: gender (binary male or female); age (in years); field site (Redding, Merced, or Bakersfield); and livelihood (earn living off land or not). To capture the quadratic effect of age on spectral tilt among women, age squared was included in the model in addition to age. (While the age factors are of course collinear, p-values are unaffected by this collinearity.)
Results
In this section, we report results for each of the three approaches to quantifying creak: H1*−H2* as a measure of spectral tilt, CPPS as a measure of periodicity, and incidence of creak as determined by a neural network. In the interest of space, we focus on the significant social factors so that we can shed light on creaky voice’s distribution across the community. However, given our earlier point that phonatory characteristics will be heavily influenced by several internal constraints in spontaneous speech data, and that these constraints have not been well described in previous work, we offer a brief word about them first. We direct the reader to Appendices A-C, which summarize the regression models for the three approaches and provide further details about internal constraints.
Lower H1*–H2* (indicative of more glottal closure) correlates with several internal factors: lower log F0 (β = 0.339, p < 0.0001), an effect that decreases with greater intensity (β = −0.039, p < 0.0001); vowels with longer log duration (β = −0.014, p < 0.000); phrases of longer log duration (β = −0.014, p < .0001); later positions in the phrase (for female speakers only, β = 0.016, p < 0.0001, see the Discussion section); and greater nasality for men, lesser for women (β = −0.045, p < 0.0001, see discussion on effects of nasality on gender differences in H1−H2, or the difference between the first and second harmonics without correction for nearby formant frequencies). Regarding CPPS, lower values (indicative of less periodic phonation) exhibit the same internal constraints—with the exception of log F0 and A1*−P0, the effects of which are specific to H1*–H2*. The only noteworthy differences with respect to CPPS are that the phrase position effect (whereby later positions in the phrase occasion lower CPPS levels, or less periodic phonation) holds for all speakers in the sample regardless of gender (β = −2.025, p < 0.0001) and lower CPPS was evident for words with higher log word frequency (β = −0.059, p < 0.0001). The same four effects—of log vowel duration (β = 0.809, p < 0.0001), log phrase duration (β = −0.373, p < 0.0001), phrase position (β = 1.099, p < 0.0001), and log word frequency (β = 0.048, p < 0.0001)—emerge as significant predictors of whether a given vowel was classified as creaky. That the phonetic character and occurrence of creak generally pattern according to previously described effects of internal constraints like phrase position, phrase duration, and F0 suggests that the acoustic methods are capturing creak reasonably accurately.
Spectral tilt: H1*–H2*
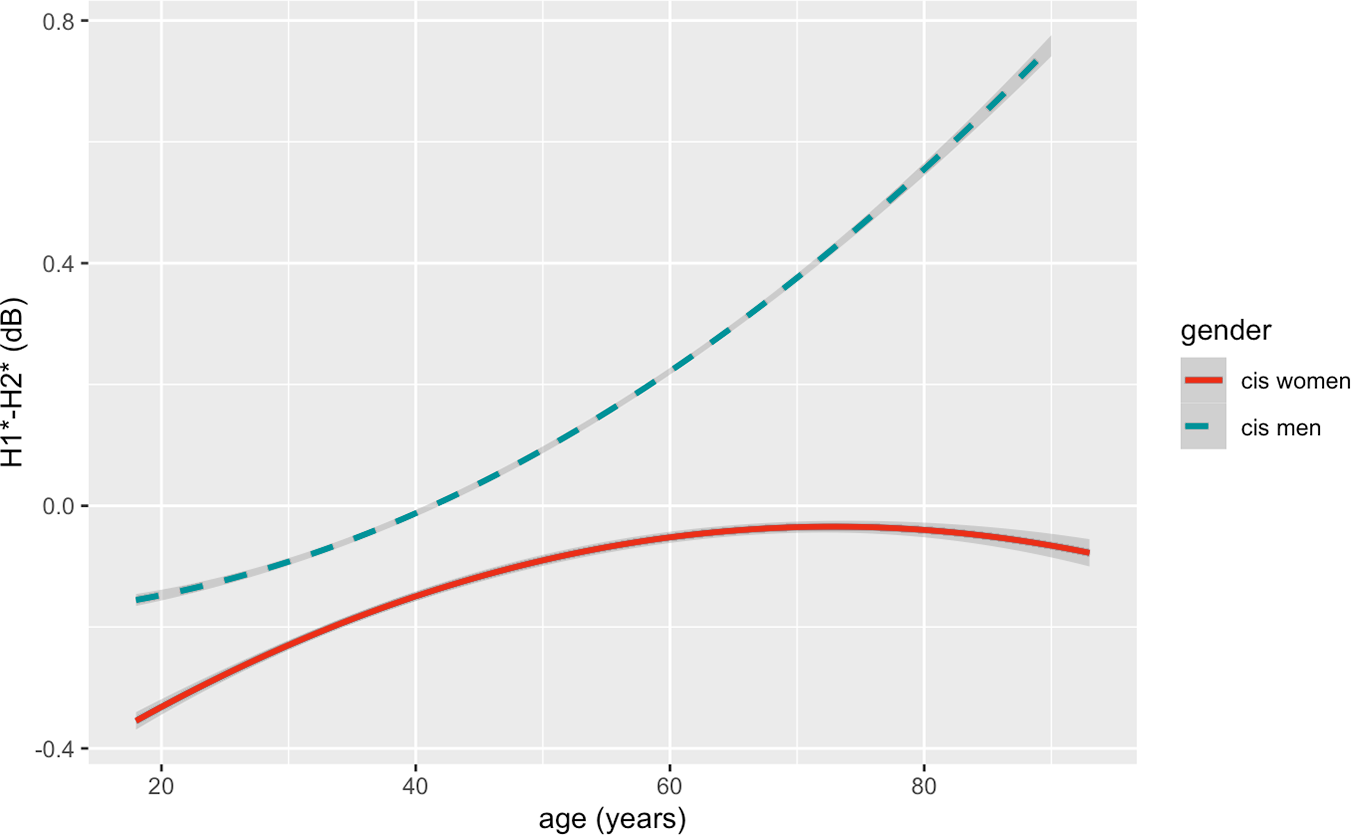
Of the social factors we considered, gender and age are the only two that predicted H1*–H2*. The effects of both can be seen in Figure 2. Regarding gender, women have a lower H1*–H2* than men (β = −0.360, p < 0.0001). This acoustic pattern is indicative of lower glottal aperture, one of the most common phonetic properties associated with most types of creak. This pattern surfaces despite Simpson’s (Reference Simpson2012) finding that H1–H2 artificially inflates women’s H1–H2 values. Simpson argued that spontaneous nasalization introduces a (relatively low frequency) nasal resonance near H1 for women and H2 for men. To state the argument in terms of source-filter theory of speech production, women’s H1–H2 will be inflated by a property of the filter (the nasal resonance), which is undesirable if the measure is being used to quantify a property of the source (glottal aperture). Still, we find here that women are creakier than men according to this measure.
Best-fit quadratic functions for H1*–H2* by speaker age, for cisgender women (solid red line) and cisgender men (dashed blue line).

Figure 2 Long description
The x- axis label is age (years). The x- axis shows values from 20 to 90 with tick labels at 20, 40, 60 and 80. The y- axis label is H1* minus H2* (dB). The y- axis shows values from minus 0.4 to 0.8 with tick labels at minus 0.4, 0.0, 0.4 and 0.8. A legend titled gender lists cis women and cis men. Two lines are plotted. The cis women line starts near (20, minus 0.4), rises to about (60, 0.0), reaches about (70, 0.0) and ends near (90, minus 0.05). The cis men line starts near (20, minus 0.1), rises through about (40, 0.0) and (60, 0.2) and ends near (90, 0.8).
There is also an effect of age, with younger people being creakier than older people, but age and gender interact in a significant way. Figure 2 depicts the interaction by plotting H1*–H2* as a function of age, for women and men separately. Men exhibit a linear pattern, with younger men trending toward exhibiting lower H1*–H2* values than the oldest men. In other words, younger men exhibit an acoustic pattern consistent with a high degree of glottal closure, a robust correlate of creak. Women, on the other hand, show a curvilinear pattern (β = −0.127, p < 0.0037). Like young men, young women also exhibit low H1*–H2* values. But beginning with the middle-aged women, H1*–H2* values start to dip. So among the women, glottal closure is most prevalent among the youngest and oldest speakers in the sample. We suggest that the high incidence of creak among young women, which is also evident among young men, can be attributed to a change in progress. The relatively high incidence of creak among the oldest women, we speculate, may be due to vocal aging (e.g., Oliveira Santos et al., Reference Oliveira Santos, Godoy, Silvério and Brasolotto2023). This leaves open the question of why older men do not show a similar pattern, which we revisit in the following subsection.
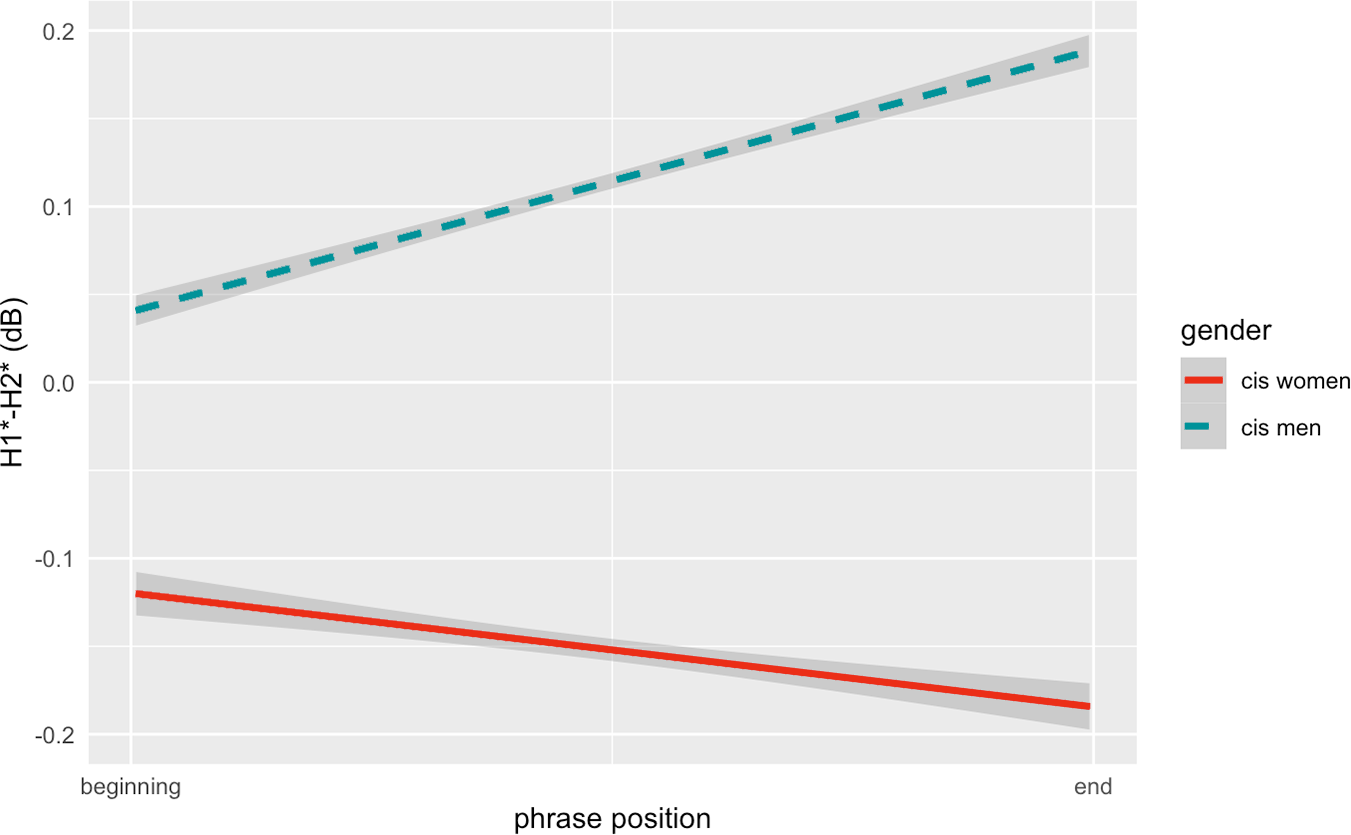
Phrase position interacts significantly with gender, such that women and men, with respect to H1*–H2*, exhibit opposite patterns over the phrase (β = 0.016, p < 0.0001). The interaction is plotted in Figure 3. Women, in red, exhibit the expected pattern, with the degree of glottal closure increasing as phrases progress. Men, by contrast, exhibit the opposite pattern, with H1*–H2* rising over the phrase. This acoustic pattern indicates decreasing degrees of glottal closure over the phrase, which could in principle be attributed to breathy voice or alternatively to what Keating et al. (Reference Keating, Garellek and Kreiman2015) called non-constricted creak (unconstricted creak in Garellek, Reference Garellek, Katz and Assmann2019). This type of creak occurs phrase-finally, when the vocal folds begin spreading at a time when sub-glottal pressure is already at its lowest. This physiological arrangement and aerodynamic state conspire to challenge sustained voicing, yielding “slow and irregular vibrations [that] indicate voicing at the edge of failing” (Keating et al., Reference Keating, Garellek and Kreiman2015:3). Given that higher H1*–H2* arises at the ends of phrases, coupled with the fact that non-constricted creak has been observed in this position in several previous studies on American English (Garellek, Reference Garellek2015; Kreiman, Reference Kreiman1982; Redi & Shattuck-Hufnagel, Reference Redi and Shattuck-Hufnagel2001; Slifka, Reference Slifka2006), whereas breathy voice is more likely to occur phrase-initially (Podesva, Reference Podesva2013), we interpret this pattern to indicate non-constricted creak rather than breathy voice. We also wish to note that male speakers did not impressionistically sound breathy at the ends of phrases, though we have not quantified this impression.
Best-fit lines for H1*–H2* by phrase position, for cisgender women (solid red line) and cisgender men (dashed blue line).

Figure 3 Long description
A line graph with the title text: Best-fit lines for H1* minus H2* by phrase position, for cisgender women (solid red line) and cisgender men (dashed blue line). Horizontal axis label: phrase position. Tick labels: beginning, end. Vertical axis label: H1 asterisk dash H2 asterisk (decibel). Vertical axis tick labels: negative 0.2, negative 0.1, 0.0, 0.1, 0.2. Legend label: gender. Legend entries: cis women, cis men. cis women series (solid line): (beginning, negative 0.12), (end, negative 0.18). cis men series (dashed line): (beginning, 0.05), (end, 0.18).
Figure 4 provides two examples of non-constricted creak on the final syllables of the words younger and Sunday, both produced by a white man from Redding born in 1993. Both tokens occur phrase-finally in utterances that end in an exhalation, precisely the data under consideration in Slifka’s (Reference Slifka2006) study of non-constricted creak. Slifka (Reference Slifka2006:185) argued that in contrast to other types of creak that may require a glottal gesture as part of an articulatory plan, non-constricted creak can arise from a “slight change in one or more control parameters” influenced by actions of the respiratory system, leading “to a change in the nature of phonation.” The acoustic result of these changes is irregular spacing of glottal pulses, evident in the final vowels in both spectrograms in Figure 4. Both tokens exhibit additional acoustic characteristics of non-constricted creak, with their H1*−H2* among the highest 10% of all vowel tokens (indicative of glottal aperture) and CPPS value among the lowest 10% of all vowel tokens (indicative of low periodicity). As non-constricted creak is characterized by less periodic phonation, we turn now to consider the CPPS patterns in greater detail.
Non-constricted creak at the end of two relatively long utterances ending in exhalations. Left: Waveform (top) and spectrogram (bottom) of the phrase-final word, younger, taken from the utterance, “Being uh one year younger, I got picked on a lot when I was, uh, younger.” Right: Waveform (top) and spectrogram (bottom) of the phrase-final word, Sunday, taken from the utterance, “When you’re in college, you go to the college group, and you go to the big service on Sunday.”.

Figure 4. Long description
The image A showing the waveform and spectrogram for the token younger. The waveform occupies the top portion, with the y-axis representing amplitude in arbitrary units and the x-axis representing time. The spectrogram occupies the bottom portion, with the x-axis representing time and the y-axis labeled frequency in kilohertz, ranging from 0 to 5 kilohertz in visible increments. Vertical striations in the spectrogram represent individual glottal pulses. Toward the phrase-final region of the token, the spacing between these vertical striations becomes visibly irregular and wider, concentrated primarily in the frequency band below 1 kilohertz. The waveform amplitude decreases and becomes less periodic in the same phrase-final time window, consistent with the irregular pulse pattern visible in the spectrogram. The image B showing the waveform and spectrogram for the token Sunday. The layout mirrors that of image A, with the waveform on top and the spectrogram below. The x-axis represents time and the y-axis of the spectrogram represents frequency in kilohertz, ranging from 0 to 5 kilohertz. In the phrase-final portion of Sunday, irregular pulse spacing is visible in the spectrogram as widened and unevenly distributed striations below 1 kilohertz. The waveform shows reduced and irregular amplitude in the same terminal region. The creak region in Sunday appears to extend across a comparable terminal window to that observed in younger, with similar low-frequency energy concentration and reduced periodicity visible in both the waveform and spectrogram.
Periodicity: CPPS
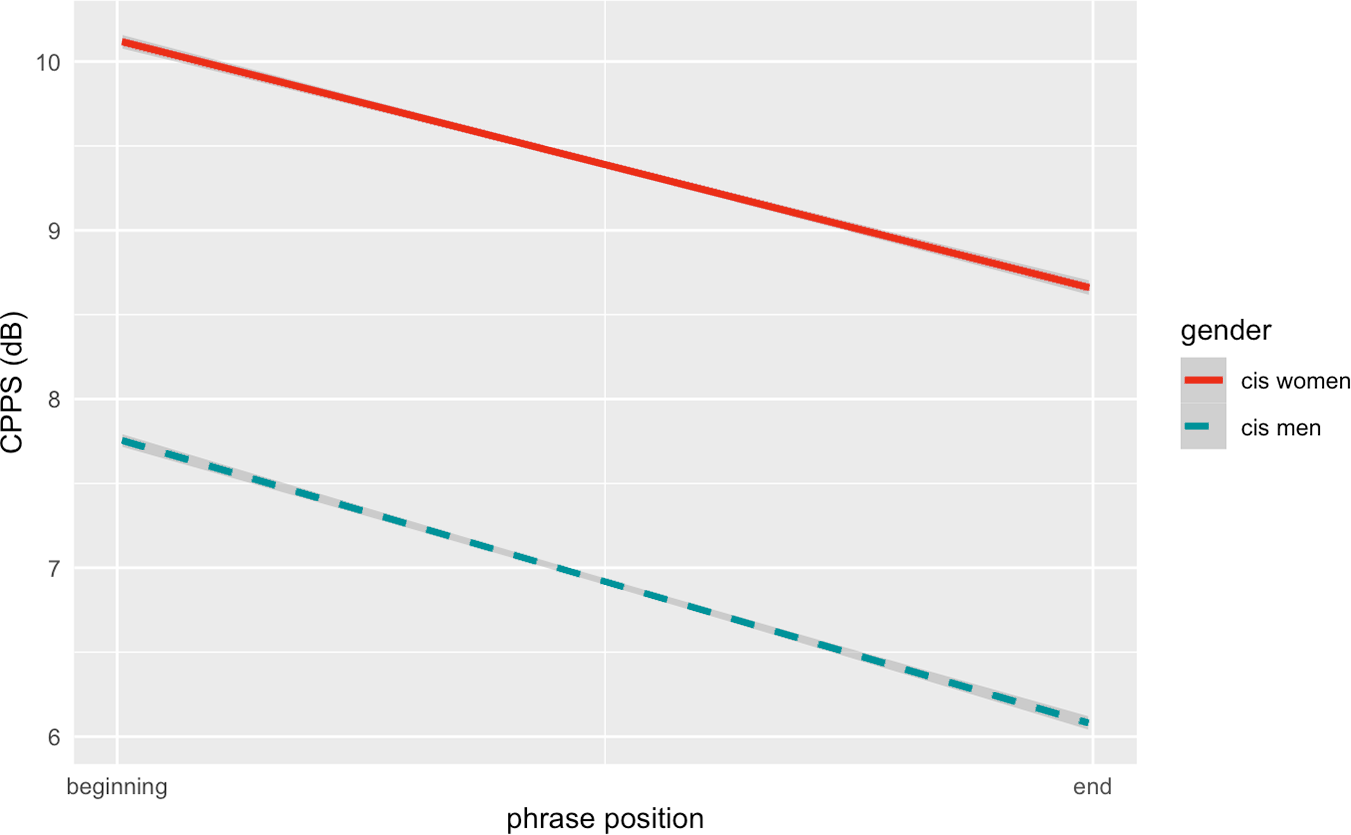
In contrast with H1*–H2*, CPPS, lower values of which are indicative of less periodic phonation, is not predicted by speaker age. There is, however, a strong effect of both phrase position (β = −2.025, p < 0.0001) and gender (β = 0.915, p < 0.0001), as illustrated in Figure 5. As expected, both women and men become less periodic as the phrase progresses. For women, we can conclude that they are becoming creakier over the course of the phrase, since the H1*–H2* and CPPS results converge on the same interpretation: that women are most likely producing what Keating et al. (Reference Keating, Garellek and Kreiman2015) called prototypical creaky voice. The fact that men become less periodic as the phrase progresses is consistent with an increase in the degree of creak, but the pattern is also consistent with increased breathiness. So we need more information still to understand the phrase position effect for male speakers. Namely, we need to know whether men exhibit creak, regardless of its phonetic particulars, particularly at the ends of phrases.
Best-fit lines for CPPS by phrase position, for cisgender women (solid red line) and cisgender men (dashed blue line).

Figure 5. Long description
The x-axis represents phrase position, with tick labels beginning and end. The y-axis represents CPPS (dB), with tick labels 6, 7, 8, 9 and 10. A legend titled gender lists cis women and cis men. The cis women line slopes downward from about 10.1 at beginning to about 8.7 at end. The cis men line slopes downward from about 7.8 at beginning to about 6.1 at end.
Incidence of creak
Recall that our analysis of the incidence of creak is based on a logistic model, since the neural network (Kane et al., Reference Kane, Drugman and Gobl2013), which takes several acoustic measures into consideration, classifies each vowel as ±creaky. The effects of social factors, especially gender, age, and their interaction, on whether a given vowel is creaky are similar to what was observed for H1*–H2*, with two primary differences.
First, there was an effect of whether speakers earn their living off the land. Speakers who do not earn their living off the land exhibit more creaky voice than those who do (β = −0.11, p < 0.0001). This recalls similar patterns in the region for other variables, as people’s orientation to the land has been shown to influence vowel quality (Podesva et al., Reference Podesva, D’Onofrio, Van Hofwegen and Kim2015a), the place of articulation of /s/ (Podesva & Van Hofwegen, Reference Podesva, Van Hofwegen, Levon and Mendes2016), and the strength of voicing during stop closures (Podesva et al., Reference Podesva, Eckert, Fine, Hilton, Jeong, King and Pratt2015b). It is worth pointing out that this factor was not found to have a significant effect for H1*–H2* or CPPS.
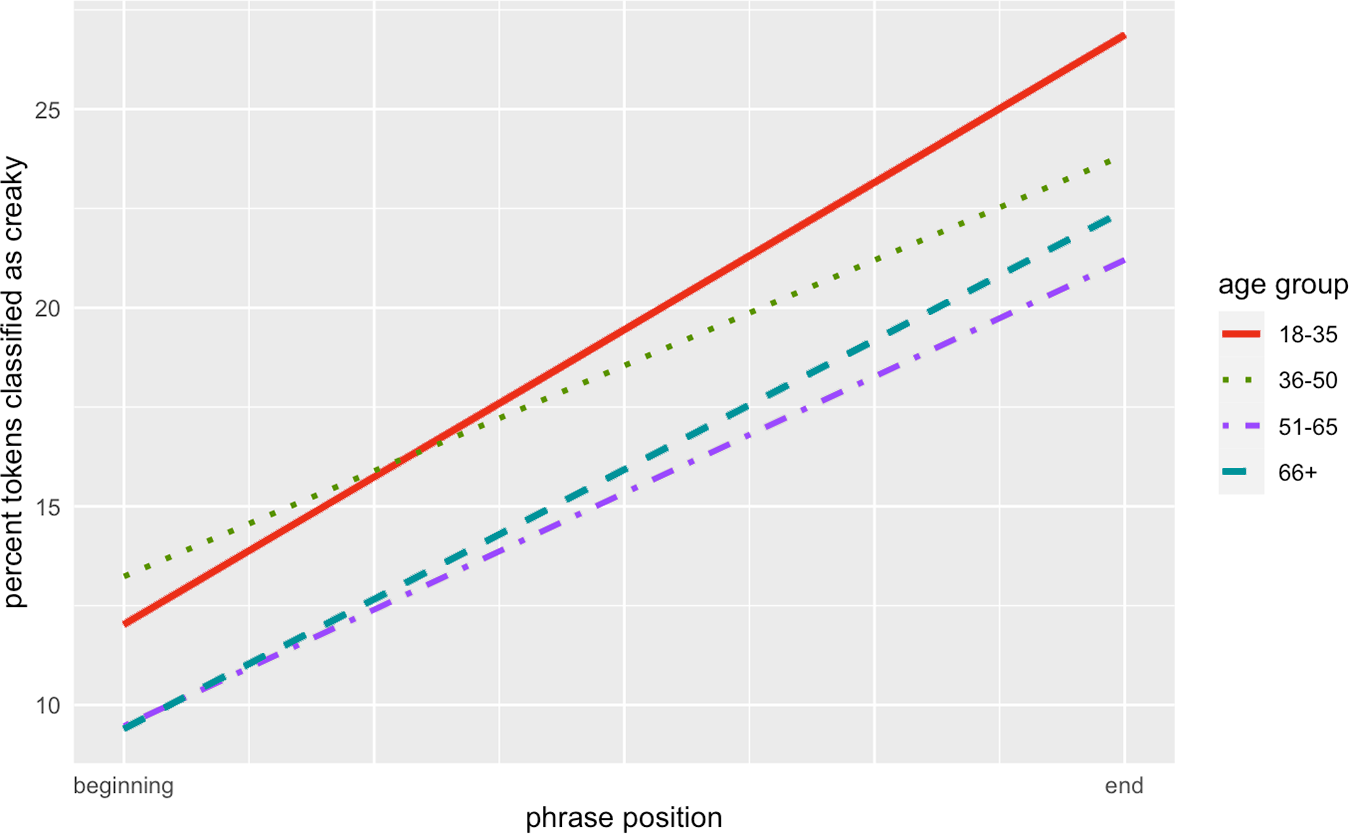
The creak detection results also differed from the H1*–H2* results with respect to the relation between age and phrase position, which were found to interact in the model of creak incidence. Figure 6 plots the percentage of tokens classified as creaky (on the y-axis) as a function of phrase-position (on the x-axis), with each line representing people of different age-groups. All the lines slope upward, which shows unsurprisingly that the incidence of creak increases as the phrase progresses (β = 1.099, p < 0.0001). If we look at the effects of speaker age, we see that younger people, in solid red, are generally creakier than the oldest people, in dashed blue. There is also an interaction between age and phrase position. According to the model, the effect of phrase position is stronger among older speakers (β = .004, p < 0.0001). Put another way, younger speakers are less influenced by positional constraints on creak—because they have started creaking at earlier positions in the phrase.Footnote 6
Best-fit lines for percent of tokens classified as creaky by phrase position for four age-groups: 18-35 (solid red line); 36-50 (dotted green line); 51-65 (dash and dotted purple line); and 66+ (dashed blue line).

Figure 6 Long description
The graph shows the percent of tokens classified as creaky on the vertical axis, ranging from 10 to 25 percent and phrase position on the horizontal axis, from beginning to end. Four age groups are represented: 18-35 with a solid line, 36-50 with a dotted line, 51-65 with a dash and dotted line and 66+ with a dashed line. All lines slope upward, indicating an increase in creakiness as the phrase progresses. The solid line for ages 18-35 is the highest throughout, while the dashed line for ages 66+ is the lowest. The dotted line for ages 36-50 and the dash and dotted line for ages 51-65 fall between these two. The graph highlights differences in creakiness across age groups as the phrase position advances.
A trajectory of change, at least with respect to incidence of creak, is suggested by the patterns shown in Figure 6. Creak likely originated phrase-finally, where everyone, even the oldest speakers, creak quite a bit. Then young people began to creak more in this favored prosodic position, a change that women appear to lead. It is worth noting that it is precisely in this final position that we see the greatest differentiation according to age (widest separation among lines). Finally, young speakers started to produce creak in previously disfavored positions earlier in the phrase, while older people nearly categorically resist creaking in this environment. Importantly, the data suggest that young people have led a change toward creaking more. Creaky voice is not on the rise merely because people are indiscriminately creaking more; rather, young people are producing more creaky voice in both favored and disfavored positions.
Recall from the discussion that there was some question about gender differences in the realization of creaky voice at the ends of phrases. We have also just seen that the rise in creaky voice has been on the rise both phrase-finally, and at earlier positions in the phrase. To gain further clarity, we hand-coded a subset of 500 randomly selected phrases for whether they exhibited final creak, which we operationalized as having creak only on or after the nuclear phrase accent, or extensive creak, which we operationalized as having creak on one or more syllables before the nuclear accent.
The results are summarized in the smoothing spline analyses of variance in Figure 7. CPPS patterns are on the top, and H1*–H2* patterns are on the bottom. In all facets, phrase position is represented on the x-axis, women’s patterns are represented in red, and men’s in blue. For utterances exhibiting phrase-final creak, we see the same pattern as was evident in the full dataset. As shown in the top panel, both women and men show decreasing CPPS values (i.e., become less periodic) as the phrase progresses. And as shown in the bottom panel, women exhibit lower H1*–H2* (i.e., increased glottal closure) as the phrase progresses, while men exhibit higher H1*–H2* (i.e., decreased glottal tension). In the case of extensive creak, the gender difference does not hold, as both women and men exhibit a low H1*–H2*, or increased glottal closure. These patterns suggest that final and extensive creak exhibit distinct acoustic properties.
Best-fit lines for CPPS (top) and H1*–H2* (bottom) by phrase position in phrases exhibiting extensive (left) and final (right) creak, for cisgender women (red lines) and cisgender men (blue lines).

Figure 7 Long description
Panel 1 shows CPPS in extensive creak. The x-axis is phrase position from beginning to end and the y-axis is CPPS in decibel from negative 1 to positive 1. Cis women start higher and decrease, while cis men start lower and increase slightly. Panel 2 shows CPPS in final creak. The x-axis is phrase position from beginning to end and the y-axis is CPPS in decibel from negative 1 to positive 1. Both cis women and cis men decrease, with cis women starting higher. Panel 3 shows H1 asterisk dash H2 asterisk in extensive creak. The x-axis is phrase position from beginning to end and the y-axis is H1 asterisk dash H2 asterisk in decibel from negative 1 to positive 1. Cis women start lower and increase, while cis men start higher and decrease. Panel 4 shows H1 asterisk dash H2 asterisk in final creak. The x-axis is phrase position from beginning to end and the y-axis is H1 asterisk minus H2 asterisk in decibel from negative 1 to positive 1. Cis women decrease, while cis men increase slightly. The legend indicates cis women with one line style and cis men with another, showing differences in trends and values across conditions.
Discussion
The results in the previous section enable us to bring empirical patterns to bear on two questions: whether creaky voice is on the rise, and if so, who is leading. Regarding the first question, apparent time data indicate that the community is undergoing phonatory change toward creakier phonation, for all measures considered. The creak incidence analysis reveals that younger speakers are more likely to produce creak, irrespective of its phonetic particulars, than older speakers. The H1*–H2* analysis further shows that young women and young men have higher glottal constriction than speakers of other ages, though the H1*–H2* values for the oldest women approach those of the youngest women. The apparent phonatory change is further mediated by phrase position: The effect of age on the incidence of creak was most pronounced at the ends of phrases, a favored environment in which younger speakers creak the most. Younger speakers also effect the change toward creakier phonation by creaking at earlier, even initial, phrase positions. In other words, the prosodic domain of creaky voice has expanded. Interestingly, and in contrast to the creak incidence and H1*–H2* results, we do not find an age effect for CPPS, a pattern which we attribute to the high incidence of non-modal phonation among younger and older speakers.
The other question, whether (young) women are leading the change, and its relation to the ideologies discussed at the start of the paper, must be answered with caution. At first blush, there is strong support for an affirmative response. Young women were found to creak the most (in the creak incidence analysis) and to exhibit the lowest H1*–H2* values (indicative of greatest glottal constriction). At the same time, a closer look at the data shows that young men also creak at high rates relative to the whole sample and produce similarly strong creak (with respect to glottal constriction, as captured by H1*–H2*) to young women. In addition, young men, like young women, creak at earlier positions in the phrase, and extensive creak (preceding the nuclear accent) is produced with higher glottal constriction regardless of speaker gender. Further, the oldest women exhibit H1*–H2* values that resemble those of younger (if not the youngest) women, suggesting that the acoustic character of their creak, as it relates to glottal constriction at least, is not qualitatively different from that of younger women.Footnote 7 And finally, we observed that creaky voice is more prevalent in the speech of people who do not earn their living off the land, as revealed by the incidence of creak analysis. Given the fact that such speakers tend to be more positively oriented to their relatively more cosmopolitan towns, this finding is consistent with Yuasa’s (Reference Yuasa2010) assertion that creaky voice can index urbanity and also in line with the language ideologies about creaky voice discussed earlier. Thus, generalizations of the form “young women creak the most,” while not entirely inaccurate, erase the phonatory practices of the oldest women and especially young men from the discourse. They also fail to acknowledge that using creaky voice may be a distinctively urban practice. And this is to say nothing of how the phonatory practices of transgender and nonbinary speakers complicate the conversation (Becker et al., Reference Becker, Khan and Zimman2022).
We want at this juncture to consider whether the social distribution and acoustic character of creaky voice described in this study might have any relation to the spike in media attention on phonatory behavior, particularly for women. As we suggested at the outset of the paper, the social distribution of creak must be reconciled with widely circulating ideologies about its social distribution. We argue that creak’s ascendance to the metalinguistic level may not simply be a case of the media disparaging the totality of linguistic practices that young people, and especially young women, engage in. That creak is arising at earlier phrase positions may have led to an increase in its salience. And our observation that extensive creak and final creak exhibit some acoustic differences may further set the stage for creak to be noticed and subsequently commented upon. The data for this study were collected as media coverage on creaky voice was just beginning. It would be interesting to examine in future work whether there is any connection between the spike in public commentary and voice quality patterns in subsequent years.
Why the newly salient creaky phonation has been associated so strongly with women is another question. Melvin and Clopper (Reference Melvin and Clopper2015) had suggested that the perceptual distance between modal voicing and creak in the pitch domain may play a role. That is, the F0 difference between modal and creaky voice will generally be larger for women than men. In an experiment that probed listener perceptions of creak in unmanipulated samples of American English, Davidson (Reference Davidson2019) found some support for this suggestion, as listeners showed a weak tendency to identify creak more often in the speech of two female speakers compared to two male speakers when speech samples were entirely creaky. White et al. (Reference White, Penney, Gibson, Szakay and Cox2024) experimentally manipulated two-word stimuli for the presence/absence of creak and found that in Australian English listeners rely relatively more heavily on pitch as a cue to creaky voice than speaker gender. Melvin and Clopper (Reference Melvin and Clopper2015) further suggested that women may exploit creak because of its perceptual salience. That is, creaky voice may be available as a resource for doing social work because it stands out phonetically. Discourse analytic work that situates creak in its interactional and sociocultural contexts suggests that it indexes distance between speakers and what they are talking about or who they are talking to (Becker et al., Reference Becker, Khan and Zimman2022; Grivicic & Nilep, Reference Grivicic and Nilep2004; Lee, Reference Lee2015; Zimman, Reference Zimman2017a). Determining what interactional functions creaky voice may serve, and how widespread these functions may be, will be an important future direction, as these functions may shed much-needed light on the questions of why younger speakers have picked up on creak and whether the functions of creak are disproportionately more useful to women than men. As work examining the interactional functions of creak proceeds, we hope that studies will consider the effects of the internal constraints described in this study and others, as such constraints structure a great deal of the variation.
We observed in this study that cisgender women and men do not produce nonfinal, extensive creak appreciably differently from one another. This relatively newly pervasive creak is thus not a uniquely feminine vocal practice, even if it is ideologized as such. But how should such creak be phonetically described? We have refrained from labeling the types of creak that occur in different phrase positions, as such a project would require a more detailed analysis that is largely at odds with the kind of large-scale study required to answer the present research question. But a goal of future work should be to qualitatively describe extensive creak that precedes the nuclear accent; it is possible that such instances of creak would be more precisely characterized as vocal fry.
In summary, we can definitively conclude that creaky voice is on the rise in inland California. Young speakers are producing stronger creak in favored phrase-final positions, with young women producing the strongest creak (though their creak strength is rivaled by that of young men and the oldest women) and expanding the prosodic domain of creaky voice to earlier, nonfinal phrase positions.
Conclusion
We have argued in this paper that to understand the social patterning of voice quality, and to properly evaluate ideologies about creaky voice, we must consider phonation type from a variety of methodological perspectives. We have appealed to both holistic categorizations of phonation type that ignore fine-grained phonetic distinctions and acoustic measures that capture different phonetic properties (glottal constriction and periodicity). Crucially, each measure can pattern largely or fully independently of the others, and indeed the three approaches have yielded different insights. For example, the effect of whether people earned their living off the land was significant only in the analysis of creak incidence. That this factor did not structure patterns for H1*–H2* or CPPS suggests that it is the simultaneous effect of constriction degree and periodicity that indexes urbanity rather than either on its own. Also, the two phonetic measures (H1*–H2* and CPPS) show contrasting patterns with respect to the interaction between gender and phrase position. This is unsurprising on the one hand, as the measures capture different phonetic properties. On the other hand, myriad sociophonetic studies appeal to H1*–H2* alone as a proxy for phonation type. The data presented here reveal that measures of spectral tilt tell only one part of the story, and that fuller accounts are possible only by operationalizing voice quality in multiple ways and triangulating patterns.
To drive this point home, we want to look closer at the ways in which creaky voice varies as a function of phrase position for men. We saw that CPPS diminished (became less periodic) as the phrase progressed. But does this indicate breathier or creakier phonation? The creak detection results provided us with the answer—it was indeed creaky. But it couldn’t tell us what kind of creak men were producing at the ends of phrases. The H1*–H2* results revealed a direct correlation with phrase position, so men exhibit a decreased degree of glottal constriction at the ends of phrases. We needed to examine all three measures to draw a firm conclusion, and we also needed to look at different phrase positions. Above all other linguistic factors, phrase position should be considered in variationist analyses of phonation.
In studies of voice quality, we recommend some form of holistic coding (ideally using an automated system like that produced by Kane et al., Reference Kane, Drugman and Gobl2013) and attending to acoustic features that capture, minimally, glottal constriction and periodicity. We grant that a different set of variables could, in principle, better characterize creaky voice, and that a different set of variables might be necessary to properly characterize other voice qualities. But one thing is clear: A single-variable approach is insufficient for variationist studies of voice quality. Any analysis that relies on just one would yield partial understandings.
Supplementary material.
The supplementary material for this article can be found at https://doi.org/10.1017/S0954394526100684.
Acknowledgements
Many thanks to audiences at New Ways of Analyzing Variation (NWAV) 44 in Toronto; Experimental and Theoretical Approaches to Prosody (ETAP) 4 at the University of Massachusetts, Amherst; and the University of London, Queen Mary, for feedback on segments of this work. We accept responsibility for any errors.
Financial support.
Data collection was supported by Stanford University and the Richard A. Karp Foundation.
Competing interests
The authors declare none.
Appendix A
Summary of mixed-effects linear regression on H1*−H2* (intercept: male)

Note: p<0.05
Appendix B
Summary of mixed-effects linear regression on CPPS (intercept: male)

Note: p<0.05
Appendix C
Summary of mixed-effects logistic regression on incidence of creak (intercept: male, not land)

Note: p<0.05





 Open access

