

Fibroblast growth factor (FGF) 21 is a member of the FGF superfamily, which is believed to act in an endocrine manner and to have pleiotropic effects on glucose and lipid metabolism( Reference Iglesias, Selgas and Romero 1 ). FGF21 was initially found to be preferentially expressed in the liver( Reference Nishimura, Nakatake and Konishi 2 ) and later reported to be expressed in pancreas, testis, adipose tissue and muscle as well( Reference Kharitonenkov and Shanafelt 3 , Reference Fon Tacer, Bookout and Ding 4 ). Gene expression in the liver and the circulating level of FGF21 are reportedly increased by means of fasting( Reference Inagaki, Dutchak and Zhao 5 – Reference Lundåsen, Hunt and Nilsson 7 ), a high-fat/low-carbohydrate ketogenic diet( Reference Badman, Pissios and Kennedy 6 , Reference Murata, Nishio and Mochiyama 8 ) and endoplasmic reticulum (ER) stress( Reference Schaap, Kremer and Lamers 9 ), and men with obesity, type 2 diabetes and non-alcoholic fatty liver disease show elevated circulating FGF21 levels( Reference Iglesias, Selgas and Romero 1 ). Moreover, FGF21 expression is increased by mitochondrial myopathy, autophagy deficiency or mitochondrial uncoupling in skeletal muscle( Reference Tyynismaa, Carroll and Raimundo 10 – Reference Keipert, Ost and Johann 12 ), and by cold exposure or β3-adrenergic stimulation in brown adipose tissue (BAT)( Reference Chartoumpekis, Habeos and Ziros 13 , Reference Hondares, Iglesias and Giralt 14 ). In addition to these observations, the results of our present DNA microarray analysis revealed a very rapid up-regulation of Fgf21 expression in the liver of rats fed an isoenergetic low-protein diet. The increase in Fgf21 is reportedly mediated by activating transcription factor 4 (ATF4) during treatment with His-OH, which mimics amino acid deprivation( Reference De Sousa-Coelho, Marrero and Haro 15 ), treatment with the anti-hyperglycaemic drug Metformin( Reference Kim, Jeong and Kim 16 ) or ER stress( Reference Schaap, Kremer and Lamers 9 ). In addition, peroxisome proliferator-activated receptor-α (PPAR-α) regulates Fgf21 expression during fasting( Reference Inagaki, Dutchak and Zhao 5 , Reference Lundåsen, Hunt and Nilsson 7 ) and ketosis( Reference Badman, Pissios and Kennedy 6 ).
Growth retardation accompanied by decreased insulin-like growth factor (IGF)-I levels is a well-known symptom observed in protein-malnourished animals during the growth phase( Reference Thissen, Ketelslegers and Underwood 17 ). Moreover, animals fed low-protein diets show impaired glucose-induced insulin secretion( Reference Okitolonda, Brichard and Henquin 18 – Reference Reis, Carneiro and Mello 20 ). Direct stimulation of hepatic IGF-I production by insulin treatment has been reported( Reference Böni-Schnetzler, Schmid and Meier 21 ); however, our previous study showed that impaired insulin secretion is not the cause of decreased IGF-I and growth retardation in protein-malnourished animals( Reference Ozaki, Takeda and Akanishi 22 ), and the molecular mechanism underlying the decrease in IGF-I remains unknown. Although FGF21 is classified as a member of the FGF family, it has never been reported to promote growth in fibroblasts or in vivo ( Reference Kharitonenkov and Larsen 23 ). Instead, Fgf21-transgenic (Tg) mice with increased plasma FGF21 concentration show significant growth retardation accompanied by suppression of growth hormone (GH) signalling, including down-regulation of IGF-I and up-regulation of IGF binding protein (IGFBP)-1, which sequesters IGF-I action( Reference Inagaki, Lin and Goetz 24 ). Moreover, 1–3 d of FGF21 treatment decreases plasma IGF-I levels and increases liver Igfbp-1 mRNA levels in wild-type (WT) mice( Reference Inagaki, Lin and Goetz 24 ). Therefore, up-regulated FGF21 seemed to have the potential to suppress IGF-I.
Liver steatosis is another major phenotype observed under protein malnutrition conditions in growing animals or patients with kwashiorkor, possibly in part due to impaired lipid release from the liver( Reference Flores, Sierralta and Monckeberg 25 , Reference Flores, Pak and Maccioni 26 ). However, the effect of FGF21 on liver steatosis in protein malnutrition has not been studied. Contradictory results have been reported from several independent studies of FGF21 function in lipid metabolism. For example, Fgf21-Tg mice and recombinant FGF21 treatment showed that FGF21 stimulates lipolysis( Reference Inagaki, Dutchak and Zhao 5 ). In addition, FGF21 promotes lipolysis during normal feeding in Fgf21-knockout (KO) mice( Reference Hotta, Nakamura and Konishi 27 ). By contrast, FGF21 suppresses lipolysis under conditions of fasting( Reference Hotta, Nakamura and Konishi 27 ) and ketogenic diet consumption( Reference Badman, Pissios and Kennedy 6 ) and also suppresses GH-stimulated lipolysis( Reference Chen, RL-c and Konishi 28 ). Similarly, FGF21 treatment suppresses lipolysis in obese (ob/ob) mice and in cultured adipocyte cells( Reference Li, Ge and Weiszmann 29 ). In the liver, FGF21 does not seem to regulate fasting-induced hepatic TAG accumulation because no effect of Fgf21-KO has been observed on liver TAG levels( Reference Hotta, Nakamura and Konishi 27 ). On the contrary, treatment with recombinant FGF21 reverses liver steatosis in diet-induced obese (DIO) mice fed a high-fat diet( Reference Coskun, Bina and Schneider 30 , Reference Xu, Lloyd and Hale 31 ). Thus, the role of FGF21 in systemic lipid metabolism seems complicated, and its effect during protein malnutrition is unknown. Therefore, to investigate whether the up-regulation of FGF21 in protein malnutrition is responsible for growth retardation or liver steatosis, we fed an isoenergetic low-protein diet to Fgf21-KO mice and monitored their growth and IGF-I concentrations and lipid profiles.
Methods
DNA microarray analysis
Male Wistar strain rats were maintained under conditions described previously( Reference Ozaki, Takeda and Akanishi 22 ). Six-week-old rats were fed a control diet (containing 15 % casein as a protein source) or an isoenergetic low-protein diet (containing 5 % casein) for 8 h. Because we had previously observed a significant increase in liver TAG accumulation in rats fed this regimen, we collected the rat livers after 16 h of starvation( Reference Ozaki, Takeda and Akanishi 22 ). The complete composition of the experimental diet is given elsewhere( Reference Ozaki, Takeda and Akanishi 22 ). Total RNA was extracted from the livers of three rats from each diet group using an RNeasy mini kit (Qiagen), and the samples were prepared for hybridisation by using a GeneChip 3′ IVT express kit (Affymetrix) according to the manufacturers’ instructions. Each sample was hybridised to a GeneChip Rat Genome 230 2·0 Array (Affymetrix), and fluorescence signals were scanned with an Affymetrix GeneChip Scanner 3000 7G (Affymetrix). The raw data (.CEL files) were normalised with the robust multichip average algorithm by using ‘R’. The changes were judged as significant if the false-discovery rate (FDR) was lower than 0·05. Data sets with FDR <0·05 were uploaded to the Ingenuity Pathway Analysis (IPA) program (Ingenuity Systems) for pathway and global functional analyses. All microarray data have been deposited in the Gene Expression Omnibus database (accession number: GSE64970).
Liver Igf-I mRNA, plasma IGF-I and plasma and liver TAG levels of the rats used for the microarray analysis were determined as described previously( Reference Ozaki, Takeda and Akanishi 22 ). Plasma and liver cholesterol and phospholipid levels were assayed with a Cholesterol E test (Wako Pure Chemicals) and Phospholipid C test (Wako Pure Chemicals), respectively. The animal experiment was approved by the Meiji University Institutional Animal Care and Use Committee (permission number: IACUC11-0010).
Quantitative real-time RT-PCR
First-strand complementary DNA (cDNA) synthesis and quantitative real-time PCR were performed for livers of 4–5 rats (including those used for microarray analysis) as described previously( Reference Ozaki, Takeda and Akanishi 22 ). The primer sequences were as follows: for the rat β-actin gene, forward primer 5′-GGCCAACCGTGAAAAGATGA-3′ and reverse primer 5′-AGAGGCATACAGGGACAACACA-3′; for the rat Fgf21 gene, forward primer 5′-TCCTGGGTGTCAAAGCCTCTA-3′ and reverse primer 5′-CAGGCCTCAGGATCAAAGTGA-3′; for the mouse β-actin gene, forward primer 5′-CTAAGGCCAACCGTGAAAAGAT-3′ and reverse primer 5′-GGGACAGCACAGCCTGGAT-3′; for the mouse Fgf21 gene, forward primer 5′-TCTTTGCCAACAGCCAGATG-3′ and reverse primer 5′-CCGTCCTCCAGCAGCAGTT-3′; and for the mouse Igfbp-1 gene, forward primer 5′-GCCGACCTCAAGAAATGGAA-3′ and reverse primer 5′-TTCTGTTGGGCTGCAGCTAA-3′. Amplification of a single PCR product for each primer set was confirmed with melting curve analysis. The mRNA level of the β-actin gene was used as the internal control because its expression level was shown by the microarray analysis to be unaffected by the low-protein diet.
RL-34 cells
RL-34 cells were purchased from the Japanese Collection of Research Bioresources Cell Bank (JCRB0247). The cells were maintained in Dulbecco’s modified Eagle’s medium containing 10 % fetal bovine serum (FBS) and antibiotics at 37°C in a humid atmosphere containing 5 % CO2. Before experimental treatment, the cells were cultured in minimum essential medium (MEM) containing 10 % FBS. Subconfluent cells were serum-starved overnight in MEM containing 0·1 % bovine serum albumin, further cultured in MEM with or without amino acids for 24 h and collected for RNA extraction. Total RNA was extracted with the TriPure Isolation Reagent (Roche Applied Science) according to the manufacturer’s instructions. First-strand cDNA synthesis followed by quantitative real-time PCR was performed as described above.
Fibroblast growth factor 21 knockout mice
Homozygous Fgf21-KO (Fgf21 –/–) mice( Reference Hotta, Nakamura and Konishi 27 ) were bred with C57BL/6J WT (Fgf21 +/+) mice to obtain heterozygous Fgf21-KO (Fgf21 +/–) mice. The Fgf21 +/– mice were then crossed to obtain Fgf21 –/– and WT mice for the subsequent experiment. Genotyping of the animals was conducted as described previously( Reference Hotta, Nakamura and Konishi 27 ). Animals were kept at 22–24°C under a 12 h (06.00–18.00 hours) light–dark cycle and fed a commercial pellet feed ad libitum (certified diet MF; Oriental Yeast) unless otherwise noted. All animals were allowed free access to tap water throughout the experiment.
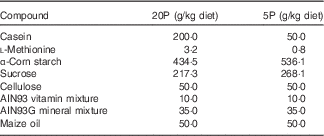
Four- to five-week-old male Fgf21-KO (Fgf21 –/–) and WT mice were housed individually in cages and trained to eat a control diet containing 20 % casein as a source of protein (20P) between 17.00 and 09.00 hours for 3 d, after which they were divided into two dietary groups. The 20P groups received the control diet, whereas the low-protein diet groups were fed an isoenergetic low-protein diet containing 5 % casein (5P) on the same schedule for 5 d. The compositions of the diets are shown in Table 1. On day 5 of the experimental feeding, heparinised blood was collected from the tail before feeding to measure FGF21 levels under fasting conditions. Subsequently, the mice were fed the respective diet ad libitum for another 5 d. On day 11 beginning at 09.00 hours, the mice were anaesthetised with sodium pentobarbital (Somnopentyl; Kyoritsu Seiyaku), heparinised blood was collected via cardiac puncture, and plasma samples were obtained. The livers were excised, weighed, frozen in liquid N2 and stored at –80°C until analysis. Epididymal white adipose tissue (epi-WAT) and gastrocnemius tissue were also excised and weighed. The animal experiment was approved by the Meiji University Institutional Animal Care and Use Committee (permission number: IACUC14–0005).
Diet composition
Measurements of plasma fibroblast growth factor 21, insulin-like growth factor-I, NEFA, total ketone bodies, TAG, cholesterol and phospholipid levels
Plasma FGF21 and IGF-I concentrations were assayed with a Mouse/Rat FGF21 Quantikine ELISA Kit (R&D Systems) and a Mouse/Rat IGF-I Quantikine ELISA Kit (R&D Systems), respectively, following the manufacturers’ instructions. Plasma NEFA, total ketone body (TKB), TAG, cholesterol and phospholipid levels were assayed with NEFA-SS (Eiken Chemical), Autokit Total Ketone Bodies (Wako Pure Chemicals), Triglyceride E test (Wako Pure Chemicals), Cholesterol E test (Wako Pure Chemicals) and Phospholipid C test (Wako Pure Chemicals), respectively.
Measurements of liver TAG, cholesterol and phospholipid levels
Total lipid was extracted from the liver with the method of Bligh and Dyer( Reference Bligh and Dyer 32 ) and reconstituted in isopropanol. Liver TAG, cholesterol and phospholipid concentrations were determined as described above.
Statistical analysis
Student’s t test and Welch’s t test accounting for equal or unequal variances, respectively, were applied to compare the values between the two experimental groups shown in Fig. 1(a)–(d), online Supplementary Table S1 and Fig. 2(a). Two-way ANOVA was carried out to evaluate the significant effects of FGF21, the low-protein diet and FGF21×diet interaction on the values shown in Fig. 2(b)–(g), Fig. 3(a)–(h) and Table 2. Post hoc comparisons were performed with Scheffe’s F test when significant interaction of FGF21×diet was observed with two-way ANOVA. A P value of <0·05 was considered significant. Statistical analyses were performed with Statcel Ver. 2 software (OMS Publishing).
Effects of amino acid deprivation on fibroblast growth factor 21 (FGF21) expression and concentration. Output of Fgf21 gene expression from the microarray analysis (n 3; * P<0·05) (a), Fgf21 mRNA levels measured with quantitative real-time PCR analysis (n 4–5, † P=0·055) (b), and plasma FGF21 concentrations (n 5, * P<0·05) (c) of rats fed a low-protein (5P) or control (15P) diet for 8 h followed by 16 h of starvation. Fgf21 mRNA levels of RL-34 rat liver cells cultured in medium with or without amino acids (AA+ or AA–, respectively) (n 4; ** P<0·01) (d). Values are means with their standard errors.

Effects of amino acid deprivation on fibroblast growth factor 21 (FGF21) expression, the insulin-like growth factor (IGF) system and tissue weight in wild-type (WT) and FGF21-knockout (Fgf21-KO) mice. Values are means with their standard errors (n 5–6/group) of plasma FGF21 concentrations (A), body weight (B), plasma IGF-I concentrations (C), liver Igfbp-1 mRNA levels (D), liver weight (E), epididymal white adipose tissue (epi-WAT) weight (F) and gastrocnemius weight (G) in WT and Fgf21-KO mice fed control (20P) or low-protein (5P) diets. Results of Welch’s t test (a) or two-way ANOVA (C–F) are given above or below the graphs, respectively (* P<0·05; ** P<0·01; *** P<0·001). Scheffe’s F test was conducted when two-way ANOVA revealed significant diet×FGF21 interaction. a,b Different characters above the graph indicate significant differences. ![]() , WT 20P;
, WT 20P; ![]() , WT 5P;
, WT 5P; ![]() , KO 20P;
, KO 20P; ![]() , KO 5P.
, KO 5P.

Effects of amino acid deprivation on lipid metabolism in wild-type (WT) and FGF21-knockout (KO) mice. Means with their standard errors (n 5–6/group) of concentrations of plasma NEFA (A), plasma total ketone bodies (TKB) (B), plasma TAG (C), liver TAG (D), plasma cholesterol (E), liver cholesterol (F), plasma phospholipids (G), and liver phospholipids (H), measured in WT and Fgf21-KO mice fed control (20P) or low-protein (5P) diets. Results of two-way ANOVA are given below each graph (* P<0·05; ** P<0·01; *** P<0·001). Scheffe’s F test was conducted when significant diet×FGF21 interaction was observed with two-way ANOVA. a,b,c Unlike letters above the graph indicate significant differences.

Characteristics of wild-type (WT) and FGF21 knockout (FGF21-KO) mice fed the control (20P) or low-protein (5P) diet (n 5–6)Footnote * (Mean values with their standard errors)
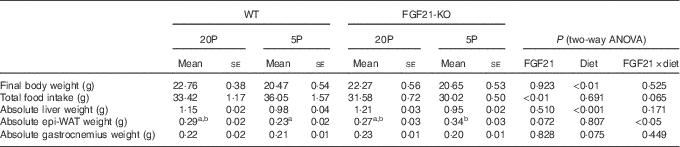
epi-WAT, epididymal white adipose tissue.
a,b Mean values with unlike superscript letters were significantly different (P<0·05).
* Scheffe’s F test was conducted when significant diet×FGF21 interaction was observed with two-way ANOVA.
Results
Features of the rats used in the microarray analysis
Compared with rats fed the 15P diet, rats fed the 5P diet for 8 h followed by 16 h of starvation showed significantly lower body weight (P<0·05), body weight gain (P<0·01), liver weight (P<0·05) and % liver weight (relative to body weight; P<0·05; online Supplementary Table S1). Total food intake did not differ between the two groups (P=0·241). Plasma IGF-I concentration was not statistically different (P=0·381); however, the relative liver Igf-I mRNA level was significantly lower in the 5P animals (P<0·05).
The liver TAG and cholesterol concentrations in the 5P group were significantly higher than those in the 15P group (both P<0·05; online Supplementary Table S1). The liver phospholipid concentration did not differ between the two groups (P=0·525). The plasma cholesterol and phospholipid concentrations were significantly lower in the 5P group (both P<0·05). The plasma TAG concentration also trended lower in the 5P group, although the difference did not reach statistical significance (P=0·059).
Increase in Fgf21 expression with acute protein malnutrition
Microarray analysis identified Fgf21 as one of the ten most highly up-regulated genes in the liver of rats fed the low-protein diet for 8 h followed by 16 h of starvation (P<0·05, FDR<0·001; see Fig. 1(a) and online Supplementary Table S2). Similar expression profiles were observed with quantitative real-time PCR analysis, although the differences did not reach statistical significance (P=0·055; see Fig. 1(b)). The plasma FGF21 level in 5P animals was significantly higher than that in 15P animals (P<0·05; see Fig. 1(c)). Furthermore, Fgf21 mRNA levels increased in RL-34 rat liver cells cultured in amino acid-deprived medium for 24 h (P<0·01; see Fig. 1(d)). Upstream analyses of the microarray data with the IPA program( Reference Krämer, Green and Pollard 33 ) predicted activation of ATF4 (activation Z score=2·189, P value of overlap=2·46E–09; online Supplementary Fig. S1). PPAR-α was also predicted to be significantly altered (activation Z score=2·000, P value of overlap=2·02E–28); however, it was not judged as activated because the expression patterns of one third of the target genes were oriented in the opposite direction in terms of PPAR-α activation.
No suppression of plasma insulin-like growth factor-I and growth by fibroblast growth factor 21 in protein malnutrition
Feeding the low-protein diet significantly increased plasma FGF21 levels in WT mice. This increase was >30-fold at day 5 in fasted animals and >10-fold at day 11 in animals fed ad libitum (both P<0·01; see Fig. 2(a)). No FGF21 was detected in the plasma of the Fgf21-KO mice. The 5P diet suppressed growth to a similar extent in both WT and Fgf21-KO animals from day 2. Two-way ANOVA revealed significant effects of the 5P diet on this suppression (P<0·05 for days 3, 4, 6 and 7; P<0·01 for days 5, 8, 9, 10 and 11; see Fig. 2(b)), and final body weight was significantly lower in the 5P groups (Table 2). Plasma IGF-I levels were also lower in the 5P groups, and no effect of FGF21 or diet×FGF21 interaction was observed on the differences (P<0·001; see Fig. 2(c)). Total food intake during the experimental diet feeding was lower in the Fgf21-KO mice than in the WT mice; however, we observed no effect of diet on this decrease (see Table 2). The 5P diet increased liver Igfbp-1 mRNA levels in both the presence and absence of FGF21 (P<0·01; see Fig. 2(d)).
Protective effect of fibroblast growth factor 21 against obesity and liver steatosis during protein malnutrition
Both absolute liver weight and liver weight expressed by % body weight were significantly lower in the 5P animals (P<0·001; see Fig. 2(e) and Table 2). The 5P diet did not affect the epi-WAT weight of the WT mice, but the epi-WAT weight was significantly increased in Fgf21-KO mice (see Fig. 2(f) and Table 2). Gastrocnemius weight did not differ among the four groups (see Fig. 2(g) and Table 2).
The absence of FGF21 significantly increased plasma NEFA and TAG levels (both P<0·01; see Fig. 3(a) and (c)). Moreover, the 5P diet significantly suppressed plasma NEFA and TAG levels (both P<0·001; see Fig. 3(a) and (c)). The 5P diet appeared to decrease plasma TKB levels; however, the differences were not statistically significant (see Fig. 3(b)). The effect of the 5P diet in increasing liver TAG was much greater in Fgf21-KO mice (see Fig. 3(d)). No effect of FGF21 or diet was observed on plasma cholesterol levels (see Fig. 3(e)). In addition, the 5P diet increased liver cholesterol levels in the Fgf21-KO mice but not in the WT mice (P<0·01; see Fig. 3(f)). The 5P diet suppressed plasma phospholipid levels in both Fgf21-KO and WT mice (see Fig. 3(g)). Liver phospholipid levels were unaffected by either the 5P diet or the absence of Fgf21 (see Fig. 3(h)).
Discussion
The DNA microarray analysis in the present study identified Fgf21 as one of the most highly up-regulated genes in the liver of rats fed a low-protein diet for 8 h. In agreement with the results of the microarray analysis and compared with control mice, WT mice fed an isoenergetic low-protein diet for 5 and 11 d showed significantly greater plasma FGF21 levels, which were consistent with the recently published work by Laeger et al. ( Reference Laeger, Henagan and Albarado 34 ). The plasma FGF21 concentration of the animals fed the low-protein diet was higher in mice than in rats, likely due to differences in species, age or the period during which the animals were fed the low-protein diet. We observed greater than 30- and 10-fold inductions in the mean values of plasma FGF21 concentration under starved and feeding ad libitum conditions, respectively.
Furthermore, the results of our in vitro experiment showed that Fgf21 mRNA levels increased in RL-34 hepatic cells cultured in amino acid-deprived medium. Thus, amino acid deprivation seems to increase Fgf21 directly. Moreover, our microarray analysis predicted significant activation of ATF4 in the liver of rats fed the low-protein diet for 8 h (online Supplementary Fig. S1). In addition, PPAR-α was predicted to be significantly altered, although the status was not judged as activated (online Supplementary Fig. S1). Therefore, the rapid induction of Fgf21 that we observed may also be mediated by the activation of ATF4, PPAR-α or both.
To our knowledge, there are no other microarray data on the liver of animals subjected to only 8 h of protein restriction and no data suggesting the activation of ATF4 and possibly PPAR-α under this condition. In addition to FGF21, some ATF4 target genes, such as asparagine synthetase (Asns), phosphoserine aminotransferase 1 (Psat1) and phosphoglycerate dehydrogenase (Phgdh) are reportedly up-regulated by mitochondrial uncoupling in the muscle( Reference Ost, Keipert and van Schothorst 35 ) and were up-regulated in our microarray data as well, whereas other stress-response genes( Reference Keipert, Ost and Johann 12 ) mostly showed no up-regulation in our experiment. Thus, ATF4 may induce FGF21 in different tissues under various physiological conditions that may alter protein metabolism. However, although recent data have also demonstrated that both general control nonderepressible 2 (GCN2), an upstream regulator of ATF4, and PPAR-α contribute to FGF21 regulation during protein malnutrition, they do not seem to be the only factors involved in FGF21 induction( Reference Laeger, Henagan and Albarado 34 ).
Protein deficiency induces a state of GH resistance( Reference Maes, Maiter and Thissen 36 ). Previously, high FGF21 levels in Fgf21-Tg mice were shown to block GH action, which resulted in growth retardation( Reference Inagaki, Lin and Goetz 24 ). In these Fgf21-Tg mice, plasma IGF-I level is significantly decreased and liver mRNA level of Igfbp-1, which sequesters IGF-I action, is significantly increased. Notably, this phenotype is also observed in protein-malnourished animals( Reference Thissen, Ketelslegers and Underwood 17 , Reference Takenaka, Hirosawa and Mori 37 ), which led us to hypothesise that increased FGF21 induces GH resistance and reduction in IGF-I activity followed by growth retardation in protein-malnourished animals. Although we identified FGF21 up-regulation in the livers of rats fed a low-protein diet for 1 d, we applied a longer feeding period for Fgf21-KO mice because we wanted to know whether increases in FGF21 are responsible for growth retardation in protein malnutrition. However, unlike Fgf21-Tg mice, Fgf21-KO mice did not show rescue of growth retardation, reduced plasma IGF-I concentration or increased Igfbp-1 mRNA level in the liver, which demonstrated that increased FGF21 does not promote a GH-resistance state under conditions of protein malnutrition.
In addition, the basal level of FGF21 apparently does not regulate IGF-I levels and growth because these parameters were unaffected in Fgf21-KO animals fed the control diet. Because DIO mice fed obesogenic high-fat/high-sucrose diets are reportedly FGF21 resistant( Reference Fisher, Chui and Antonellis 38 ), it is likely that the feeding status and physiological states of animals affect FGF21 sensitivity. Thus, the seemingly different FGF21 actions previously observed in Fgf21-Tg mice and presently observed in Fgf21-KO mice may be related to differences in local FGF21 sensitivity. In addition, although FGF21 has been postulated to be an endocrine factor, whether it is present in the circulation in its active form remains to be determined( Reference Kharitonenkov and Larsen 23 ), and the mechanism that suppresses IGF-I and growth under protein malnutrition conditions remains unknown.
It is likely that both low-protein diet and basal FGF21 level suppress lipolysis under sufficient protein conditions because the low-protein diet suppressed plasma NEFA, whereas the absence of FGF21 increased it. Consistent with our observations, FGF21 treatment decreases circulating NEFA in both lean and obese mice( Reference Li, Ge and Weiszmann 29 , Reference Xu, Lloyd and Hale 31 , Reference Fisher, Chui and Antonellis 38 ), and FGF21 has been shown to suppress lipolysis in Fgf21-KO mice under fasting conditions( Reference Hotta, Nakamura and Konishi 27 ). However, increased FGF21 due to protein restriction appears not to suppress lipolysis because feeding the low-protein diet reduced plasma NEFA not only in WT mice but also in Fgf21-KO mice.
In addition, the increase in epi-WAT mass in Fgf21-KO mice fed the low-protein diet but not in WT mice suggests that increased FGF21 under protein malnutrition conditions promotes lipolysis. This protective effect of FGF21 against obesity is consistent with the results of a previous report using DIO mice( Reference Coskun, Bina and Schneider 30 , Reference Xu, Lloyd and Hale 31 ). Moreover, although FGF21 has been shown to suppress lipolysis in Fgf21-KO mice under fasting conditions, it has also been shown to promote it during normal feeding( Reference Hotta, Nakamura and Konishi 27 ). Thus, FGF21 might suppress excessive lipolysis but is more likely to stimulate lipolysis under normal feeding or protein-restricted conditions in which excessive lipolysis does not occur. In addition, the impairment of lipid uptake or lipogenesis by FGF21 under conditions of protein malnutrition may explain the increase in the epi-WAT mass in Fgf21-KO mice fed the 5P diet. Feeding a low-protein diet also seemed to suppress fatty acid oxidation slightly because plasma TKB levels decreased in both WT and Fgf21-KO mice fed the low-protein diet, although the difference was not statistically significant (two-way ANOVA, effect of diet: P=0·067). Because NEFA levels regulate ketone body production( Reference Miles, Haymond and Nissen 39 ), the decrease in NEFA level could be partly responsible for the decrease in plasma TKB levels. Taken together with the findings that FGF21 treatment increases energy expenditure( Reference Coskun, Bina and Schneider 30 , Reference Xu, Lloyd and Hale 31 ), stimulates thermogenic activation in adipose tissues( Reference Fisher, Kleiner and Douris 40 ) and stimulates the browning of WAT( Reference Fisher, Kleiner and Douris 40 ), the FGF21 increase observed in protein malnutrition may have promoted NEFA mobilisation and usage in BAT or beige cells.
The molecular mechanism of liver lipid accumulation in protein malnutrition is still under discussion; however, the 5P diet promoted hepatic steatosis in both WT and Fgf21-KO mice, as indicated by increases in liver TAG and cholesterol levels. In addition, the increases in the lipid levels in the Fgf21-KO mice were much greater than those in the WT mice. Therefore, although it was insufficient for complete suppression, increased FGF21 had a significant protective effect against hepatic steatosis under conditions of protein malnutrition. FGF21 treatment reportedly up-regulates some genes involved in cholesterol excretion in the liver of mice fed a chow diet, and these increases require insulin action( Reference Emanuelli, Vienberg and Smyth 41 ). Therefore, increased FGF21 due to protein malnutrition may stimulate cholesterol excretion from the liver into the bile. Because protein deprivation increases hepatic insulin sensitivity( Reference Toyoshima, Tokita and Ohne 42 ), increased insulin signalling may synergistically increase this action during the consumption of a low-protein diet. In addition, a recent study reported that treating DIO mice with recombinant FGF21 reversed hepatic steatosis, likely in part due to the inhibition of lipogenesis( Reference Xu, Lloyd and Hale 31 ). Therefore, in addition to exploring the molecular pathway involved in lipid catabolism, further studies should focus on lipid transport and lipogenesis.
In conclusion, the results of the present study showed that a sufficient supply of protein suppresses FGF21, which is immediately up-regulated in protein deprivation. Moreover, by using an in vitro model, we newly demonstrated that this induction is likely to be a direct effect of amino acid deprivation. Although FGF21 reportedly suppresses IGF-I, we showed that growth retardation and decreased IGF-I are not mediated by increased FGF21 under conditions of protein malnutrition. Furthermore, Fgf21-KO mice fed a low-protein diet showed greater epi-WAT weight as well as hepatic TAG and cholesterol levels, which demonstrated that FGF21 up-regulation has a protective effect against obesity and hepatic steatosis under protein malnutrition conditions.
Acknowledgements
The authors thank the members of Laboratory of Food Biochemistry at Meiji University for assistance with the animal experiments. We also acknowledge Dr Susan Hall (The University of North Carolina at Chapel Hill) for helping with the writing of the manuscript.
This work was supported by the Programme for Promotion of Basic and Applied Researches for Innovations in Bio-oriented Industry and Science and Technology Research Promotion Program for Agriculture, Forestry, Fisheries and Food Industry (grant no. 25006A). The funder had no role in the design, analysis, or writing of this article.
The author contributions are as follows: Y. O., F. H., S.-I. T., H. K. and A. T. formulated the research questions. Y. O. and A. T. designed the study. M. K. and N. I. developed the Fgf21-KO mice. Y. O. and K. N. performed the experiments. Y. O., K. S. and A. T. analysed the data. Y. O., K. S., S.-I. T., H. K. and A. T. wrote the paper.
There are no conflicts of interest.
Supplementary material
For supplementary material/s referred to in this article, please visit http://dx.doi.org/doi:10.1017/S0007114515002846


