


INTRODUCTION
Cryoconite holes are cylindrical water-filled holes, formed on the ablation ice surface of glaciers worldwide, and are significant features to play a role in supraglacial ecosystems as well as in ablation process of glacial ice (McIntyre, Reference McIntyre1984; Wharton and others, Reference Wharton, McKay, Simmons and Parker1985; Takeuchi and others, Reference Takeuchi, Kohshima, Yoshimura, Seko and Fujita2000; Fountain and others, Reference Fountain, Tranter, Nylen, Lewis and Mueller2004; Mueller and Pollard, Reference Mueller and Pollard2004; Cook and others, Reference Cook, Edwards, Takeuchi and Irvine-Fynn2016a). A dark-colored, mineral and organic aggregate sediment called cryoconite, is deposited at the bottom of holes and a liquid water column lies above the cryoconite during the ablation season. Due to the dark coloration of the cryoconite, it absorbs more solar radiation than the surrounding bare ice surface. As a result, the ice below the cryoconite melts faster than the surrounding ice, and cylindrical holes are formed.
Since cryoconite holes are the places where liquid water is available on the glacier surface during the ablation season, they are inhabited by diverse microbes, including autotrophs such as algae and cyanobacteria, and heterotrophs such as bacteria, rotifers, tardigrada and insects (Gerdel and Drouet, Reference Gerdel and Drouet1960; Wharton and others, Reference Wharton, McKay, Simmons and Parker1985; Takeuchi and others, Reference Takeuchi, Kohshima, Yoshimura, Seko and Fujita2000; Zawierucha and others, Reference Zawierucha, Kolicka, Takeuchi and Kaczmarek2015). The algae and cyanobacteria usually grow in cryoconite at the hole bottom, and photosynthetically produce organic matter, which sustain the heterotrophs living in the holes (Langford and others, Reference Langford, Irvine-Fynn, Edwards, Banwart and Hodson2014). They are finally decomposed again to inorganics by heterotrophic bacteria. Thus, these microbes in different trophic levels form a food web and circulate carbon and nutrients biogeochemically within the holes (Stibal and others, Reference Stibal, Tranter, Telling and Benning2008; Anesio and others, Reference Anesio, Hodson, Fritz, Psenner and Sattler2009; Hodson and others, Reference Hodson2010; Mieczan and others, Reference Mieczan, Górniak, Świątecki, Zdanowski and Adamczuk2013; Vonnahme and others, Reference Vonnahme, Devetter, Žárský, Šabacká and Elster2016). The cyanobacteria are mostly filamentous and are often entangled with minerals and other organic particles to form small spherical granules (cryoconite granules), which are the major constituents of cryoconite (Takeuchi and others, Reference Takeuchi, Kohshima and Seko2001). As cryoconite holes provide stable habitats for these organisms, the dynamics of cryoconite holes are important to understand microbial ecology on glaciers (Wharton and others, Reference Wharton, McKay, Simmons and Parker1985). Furthermore, the hydrology of cryoconite holes is linked with the porous ice surrounding the holes, called weathering crust, and enables the transport of microbes and nutrients to the other holes, and meltwater streams (Müller and Keeler, Reference Müller and Keeler1969; Irvine-Fynn and Edwards, Reference Irvine-Fynn and Edwards2014; Cook and others, Reference Cook, Hodson and Irvine-Fynn2016b). As suggested by Edwards and others (Reference Edwards2010), meltwater hydrology on the glacier surface substantially affects the microbial communities. Therefore, understanding the so-called ‘biocryomorphology’ – the linkages and feedbacks between surface ice structures, cryoconite holes and weathering crust characteristics and microbial communities and cryoconite – is essential for studying supraglacial ecosystems (Cook and others, Reference Cook, Edwards and Hubbard2015).
Cryoconite holes are also important in modulating the surface albedo of an ablating glacier ice surface. Because of dark-coloration of cryoconite impurities, they melt and sink into the ice, then aggregate and create cryoconite holes, resulting in increased area-averaged albedo (McIntyre, Reference McIntyre1984; Bøggild and others, Reference Bøggild, Brandt, Brown and Warren2010). Since the cryoconite in holes becomes shielded from sunlight, their development causes relatively higher area-averaged ice albedo than an ice surface uniformly covered with cryoconite (Bøggild and others Reference Bøggild, Brandt, Brown and Warren2010; Takeuchi and others Reference Takeuchi, Nagatsuka, Uetake and Shimada2014; Chandler and others, Reference Chandler, Alcock, Wadham, Mackie and Telling2015). Hodson and others (Reference Hodson2007) and Irvine-Fynn and others (Reference Irvine-Fynn, Bridge and Hodson2011) showed the clear association between planimetric cryoconite hole areal extent and albedo. On the Greenland ice sheet, decline in the surface albedo over the ice sheet has been observed in the 21st century with satellite-remote sensing (Alexander and others, Reference Alexander2014). In particular, the dark-colored ice surface, appearing on the southwestern side of the ice sheet during the melting season, has recently expanded and become prominent (Wientjes and Oerlemans, Reference Wientjes and Oerlemans2010; Shimada and others, Reference Shimada, Takeuchi and Aoki2016). Since the darker ice leads to enhanced melt rates by a factor of 1.4–9.0 (Bøggild, Reference Bøggild1997), which progressively may result in accelerating mass loss (Box and others, Reference Box2012). Possible explanations for the recent darkening are changes in the ice surface features, such as cryoconite holes, existence of water on ice and accumulation of impurities (Greuell, Reference Greuell2000; Wientjes and others, Reference Wientjes, Van de Wal, Reichart, Sluijs and Oerlemans2011; Goelles and others, Reference Goelles, Bøggild and Greve2015; Moustafa and others, Reference Moustafa2015). Alternative hypotheses have suggested that, if melt processes facilitate frequent collapse of holes, cryoconite would be continually redistributed over the ice surface and cause apparent darkening (Chandler and others, Reference Chandler, Alcock, Wadham, Mackie and Telling2015). A significant negative correlation between the extent of the dark ice and solar radiation (July monthly mean) on the Greenland ice sheet over the recent 15 years (Shimada and others, Reference Shimada, Takeuchi and Aoki2016) may be explained by the dynamics of cryoconite holes, since the cryoconite holes develop in the condition of high solar radiation (McIntyre, Reference McIntyre1984). Therefore, the dynamics of cryoconite holes on the ice surface is important in understanding recent darkening and projecting future changes in the ice sheet during the warming climate.
Cryoconite holes have been reported to change their dimensions spatially and temporally. Sizes of holes typically range from 1 to 30 cm in depth and from 1 to 50 cm in diameter, but are occasionally over 50 cm in diameter and of the order of 60 cm deep (Cook and others, Reference Cook, Edwards, Takeuchi and Irvine-Fynn2016a). On the Greenland ice sheet, the depth of holes has been reported to increase with elevation of the glacier surface (Gribbon, Reference Gribbon1979). This variation can be explained by a lower melt rate and less hydrological disturbance due to a drop in the air temperature at higher elevations, in contrast to the melt rate at the bottom of the hole, which is determined mostly by solar radiation (Hodson and others, Reference Hodson2007). The depth of holes also changes temporally due to meteorological conditions. The holes deepen when radiative flux is dominant in the surface energy balance, while they become shallower when turbulent heat flux is dominant (McIntyre, Reference McIntyre1984). In contrast to the depth, the hole diameter is rather independent of meteorological conditions but is determined by the total mass of cryoconite deposited at the bottom (Cook and others, Reference Cook2010). The number and coverage of holes on the surface also change temporally, and they appear to be associated with weather conditions (Chandler and others, Reference Chandler, Alcock, Wadham, Mackie and Telling2015). To demonstrate such hole dimensions with glacial and meteorological factors, several models for the dynamics of cryoconite holes have been proposed (Cook and others, Reference Cook, Edwards, Takeuchi and Irvine-Fynn2016a). However, there have still been only a few studies that demonstrate their temporal change as a function of meteorological conditions, resulting in a lack of understanding of the conditions of hole collapse; in particular, the relationship between hole development and surface albedo. This is particularly important in modeling the abundance of the impurities on the ice surface and to understanding the process of recent darkening on the Greenland ice sheet (Goelles and others, Reference Goelles, Bøggild and Greve2015). As performed by Irvine-Fynn and others (Reference Irvine-Fynn, Bridge and Hodson2011), which was one of the first studies to try to associate cryoconite coverage and albedo, time-lapse imaging on the in situ ice surface is an effective method to study the dynamics of ice surface features.
In this paper, we report the temporal change of cryoconite holes on the ice surface of Qaanaaq Glacier, located in northwest Greenland, monitored with a time-lapse interval camera during the ablation season from late July to early August of 2012. The temporal change is discussed with meteorological conditions recorded on the glacier to understand the controlling factors responsible for the development and collapse of the holes and its effect on the ice surface albedo.
STUDY SITE AND METHODS
Field works on Qaanaaq Glacier
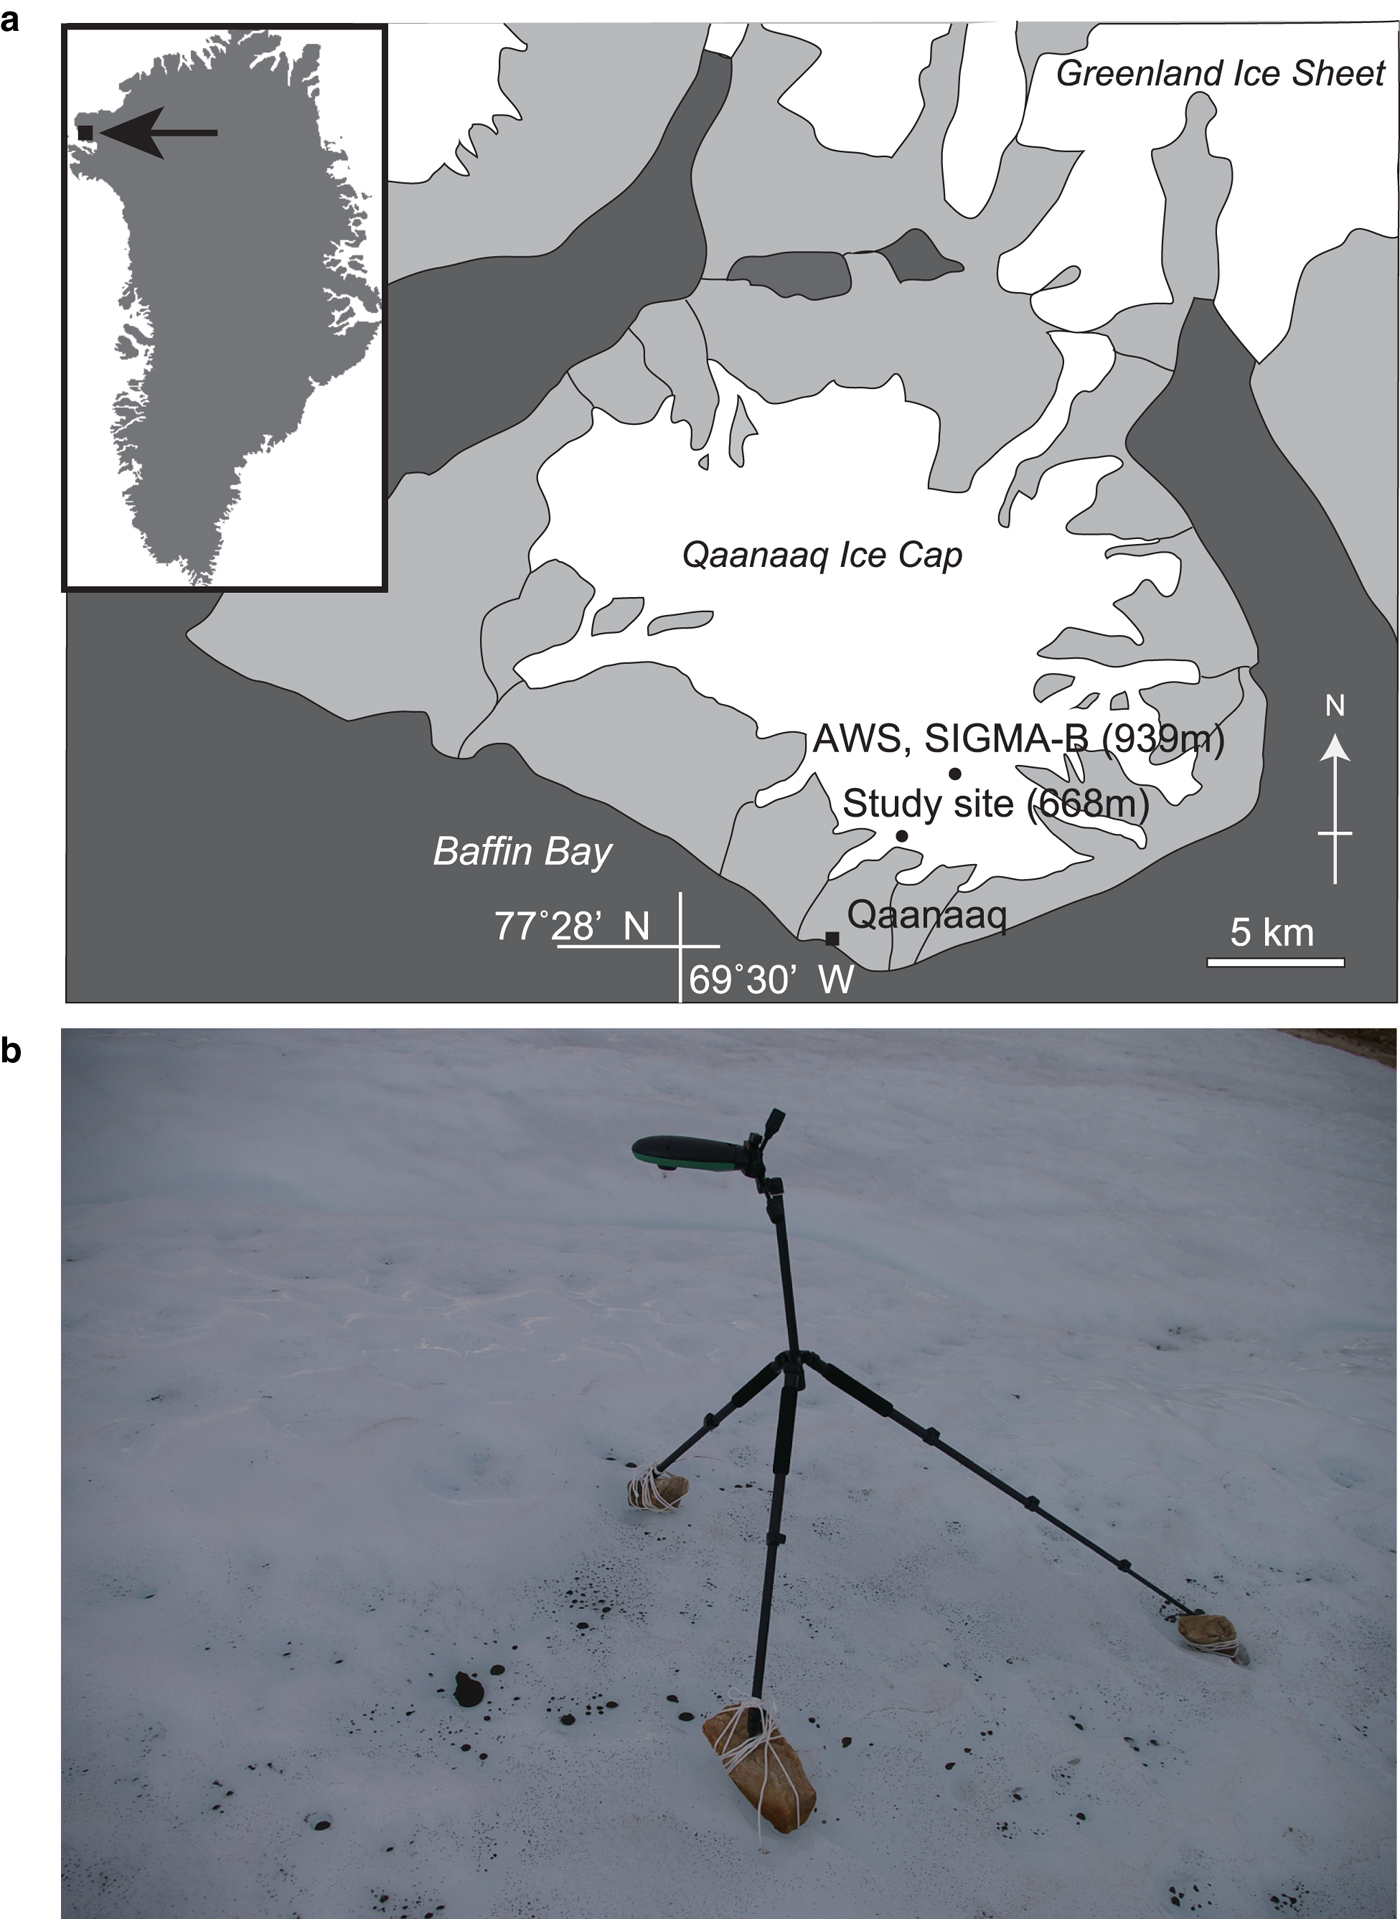
The investigation was conducted on the ablation ice surface of the Qaanaaq Glacier in northwest Greenland (Fig. 1a). The glacier is one of the outlet glaciers flowing from Qaanaaq Ice Cap. The ice cap lies on a small peninsula in northwest Greenland and extends over an area of ~286 km2. The elevation at the top of the ice cap is ~1110 m above sea level (a.s.l.) (Sugimaya and others, Reference Sugiyama2014). The Qaanaaq Glacier is easily accessible on foot from the village of Qaanaaq and has been studied glaciologically and meteorologically by Japanese research groups since 2011 (Aoki and others, Reference Aoki, Matoba, Uetake, Takeuchi and Momotoyama2014). According to their studies, current melting rates (surface mass balance) ranged from −1.08 to −2.15 m w.e. a−1 at the site of 427 m a.s.l. on the glacier (2012–2016, Tsutaki and others, Reference Tsutaki, Sugiyama, Sakakibara, Aoki and Niwano2017). Although the glacier is apart from the prominent dark ice surface in southwest Greenland, the study here could contribute to understanding processes on the climatically similar glaciers in northwestern part of the ice sheet, where 15% of dark ice on the entire ice sheet is present in this part (Shimada and others, Reference Shimada, Takeuchi and Aoki2016). Furthermore, a number of ice caps existing around the ice sheet is also concerned with recent mass loss of ice (Bolch and others, Reference Bolch2013), and thus need to be studied in their darkening process.
(a) Map of Qaanaaq ice cap in northwest Greenland showing study sites and (b) a time-lapse interval camera set on the glacier surface.
Cryoconite holes ranging from 1 to 5 cm in diameter were ubiquitously observed on this glacier during the study period (16 July–8 August), particularly in the area from the terminus up to the elevation of 750 m a.s.l. Cryoconite was observed in holes, ice surface and meltwater stream, and has been revealed to consisting of green algal cells, mineral particles and cryoconite granules (Takeuchi and others, Reference Takeuchi, Nagatsuka, Uetake and Shimada2014). Minerals were mainly derived from local sediments and englacial dust (Nagatsuka and others, Reference Nagatsuka2016). Cryoconite granules were 30–1500 µm in diameter and were formed by filamentous cyanobacteria and heterotrophic bacteria (Uetake and others, Reference Uetake2016).
Cryoconite holes on the ice surface were monitored with a 1.3 M pixel commercially available interval camera (GardenWatchCam, Brinno Co., Taiwan) at an elevation of 668 m a.s.l. on the Qaanaaq Glacier. The camera was installed with a tripod 50 cm above the ice surface, allowing the camera position to descend at the same rate as the ice surface ablation (Fig. 1b). The legs of the tripod were fixed with small boulders on the ice surface. The direction of the camera was vertical to the ice surface. The field of view (FOV) of the camera covering 65 cm × 53 cm was captured as a JPEG image file of 1280 × 1022 pixels every hour for 15 d from day of year (DOY) 201 (20 July) to 215 (3 August). The horizontal resolution of the image was 0.51 mm per pixel. The boulders of tripod may preferentially melt the underlying ice and change the height of camera from the ice surface, however, the change was <2 cm during the observation period, which causes only negligible effect of magnification in the FOV (0.01%). The surface was selected to have a broadly identical suite of characteristics in terms of cryoconite loading, ice structure and slope. The ice surface was inclined ~5°. The time used in this paper is Greenland local time (LT) (−3 h from Greenwich Mean Time).
To record the temporal change in surface albedo of the study site, upward and downward shortwave radiations were measured with broadband pyranometers (MS402, EKO Instruments Co., Japan) and recorded instantaneously with a data logger every 1 h. The pyranometers were installed at the surface ~10 m away from the camera to mitigate issues of shadowing in the imagery. Since any calibration of the measured albedo with the surface inclination was not conducted in this study, it may be over-estimated particularly when weather condition is sunny and clear sky (Jonsell and others, Reference Jonsell, Hock and Holmgren2003). Our estimate of the greatest error in the observed albedo is 0.058 when the highest albedo was observed on DOY 212 (solar zenith angle was 59.6° at the local solar noon), but most of the first half of the study period was cloudy condition without direct incident solar radiation, thus the error was negligible.
Cryoconite coverage on the ice surface was obtained from the captured images using pixel thresholding as described by Irvine-Fynn and others (Reference Irvine-Fynn, Bridge and Hodson2010, Reference Irvine-Fynn, Bridge and Hodson2011). Image processing was conducted within the freeware application ImageJ (version 1.48, National Institutes of Health, USA, Schneider and others, Reference Schneider, Rasband and Eliceiri2012). The captured color images were converted to 8-bit grayscale images and then further converted to black and white images with a threshold, which was selected to be the gray value that divides the dark cryoconite pixels from the light ice surface pixels. The threshold was determined based on the histogram of gray values of each image, which showed bimodal distribution. The two peaks of the distribution correspond to those of the dark cryoconite and light ice surface pixels. The threshold was selected as the gray value has the minimal pixel number between the two peaks. However, the pixels of intermediate gray values might be misclassified with this threshold. The possible errors of the misclassification were estimated by the increase and decrease of the pixel numbers of dark cryoconite in FOV when the threshold was shifted to the five upper and lower gray values. The threshold ranged from 10 to 100 in gray value, depending on the exposure of the camera for each image when the image was captured. The cryoconite coverage used in this paper is defined as the pixels darker than the threshold in the FOV. No geometric correction, including ortho-correction on the images, was carried out in this study. Therefore, the obtained cryoconite coverage may have been underestimated when the holes were deep. For example, an array of holes sized 2 cm in diameter would not be captured in the FOV due to self-shadowing when the holes are deeper than ~3 cm at a location distal to the camera. This shadowing effect was manually estimated with the images when the holes developed, and the maximum underestimation was obtained as ~50% of the cryoconite coverage in FOV. This uncertainty was shown with the result of the coverage in the FOV.
Calculation of ice surface energy balance
Meteorological data used in this study were recorded with an automatic weather station (AWS) at the site of SIGMA B, located at an elevation of 939 m a.s.l. in the Qaanaaq Glacier (Fig. 1a). The instruments were installed in June 2012, and have been maintained by the SIGMA Project. Detailed information of the AWS instruments were described in Aoki and others (Reference Aoki, Matoba, Uetake, Takeuchi and Momotoyama2014). The data used in this study were air temperature, relative humidity, wind speed and both downward/incident and upward/outgoing shortwave and longwave radiation fluxes.
The ice surface energy balance at the study site was calculated using the meteorological data as described by Takeuchi and others (Reference Takeuchi, Kohshima, Yoshimura, Seko and Fujita2000). The basic equation of energy balance on the glacier surface is described as:
 $$M = NR + SH + LH$$
where M is the heat used for melt (M = 0 when the surface temperature is below 0°C), NR is net radiation, SH is turbulent sensible heat and LH is turbulent latent heat. All components on the right-hand side are positive when fluxes are directed toward the surface. Heat supplied with rain and heat conducted into/from the glacier are neglected in the equation although rain events occurred during study periods may supply some amount of sensible heat to the glacier surface. The net radiation consists of:
 $$NR = SR_{{\rm down}} - SR_{{\rm up}} + LR_{{\rm down}} - LR_{{\rm up}}$$
where SR down is the incident shortwave radiation, SR up is outgoing shortwave radiation, LR down is incoming longwave radiation and LR up is outgoing longwave radiation. Both incident and outgoing shortwave and longwave radiations were recorded at the AWS.
Turbulent sensible (SH) and latent (LH) heat fluxes are described by the bulk method as:
 $$SH = c_{\rm p}\rho _\alpha CU(T_{\rm a} - T_{\rm s})$$
 $$LH = l_{\rm e}\rho _\alpha CU\lpar {h_{\rm r}q_{\rm a} - {\rm} q_{\rm s}} \rpar $$
where c p is the specific heat for air (1006 J kg−1 K−1), ρ α is the density of air (kg m−3), C is the bulk coefficient (0.002; Yamazaki and others., Reference Yamazaki, Kondo, Sakuraoka and Nakamura1993), U is the wind speed (m s−1), T a and T s are the air and surface temperature (°C), l e is the latent heat for evaporation (2.50 × 10⁶ J kg−1), h r is the relative humidity and q a and q s are the saturated specific humidity of air and surface (nondimensional).
The air temperature used was corrected from the records at the AWS with the elevation difference (271 m) between the study site (668 m) and the AWS (939 m) and a lapse rate of −0.007 K m−1. Wind speed and relative humidity at the study site were assumed to be equal to those observed at the AWS since the location of AWS is broadly representative of that slope of the ice cap. Saturated specific humidities of air and surface were calculated from the air temperature using the Teten's formulation. The daily mean value of the air temperature, relative humidity, incoming shortwave radiation and outgoing shortwave radiation were used as the input variables. The melt rate was obtained assuming an ice density of 900 kg m−3, and a latent heat of fusion of 3.335 × 10⁵ J kg−1. Thus, 1 cm of ice melt of the glacier surface is equivalent to 34.6 W m−2 of daily mean net energy flux with this assumption.
RESULTS
Temporal change of cryoconite holes observed with the time-lapse camera
Temporal change of cryoconite holes on the ice surface were successfully captured for the 15 d in the time-lapse imaging (a movie file ‘12GL_Cryoconite_hole.mp4’ of the time-lapse imaging is available as a Supplementary file, S1). When the observation was started on DOY 201, there were ~40 holes in the FOV of the camera (Fig. 2). The size of the holes estimated from the photograph ranged from 0.5 to 5.7 cm in diameter, and ~3 cm in depth. The holes appeared to be stable for the first 3 d. No significant change in the diameter of the holes was observed. On DOY 204, the number of holes in the FOV, mainly the holes smaller than 1 cm in diameter, increased. The decrease in the hole depth can also be recognized in larger holes from the images.
Images of cryoconite holes on the ice surface of Qaanaaq Glacier captured by a time-lapse interval camera from DOY 201 (20 July) to DOY 215 (3 August) in 2012. The images captured at 16:00 LT (the time when the hole collapse event observed clearly) of each day are shown here. Note the collapse of holes occurred on DOY 206 and 208. Scale bar is shown in the DOY 201 image.
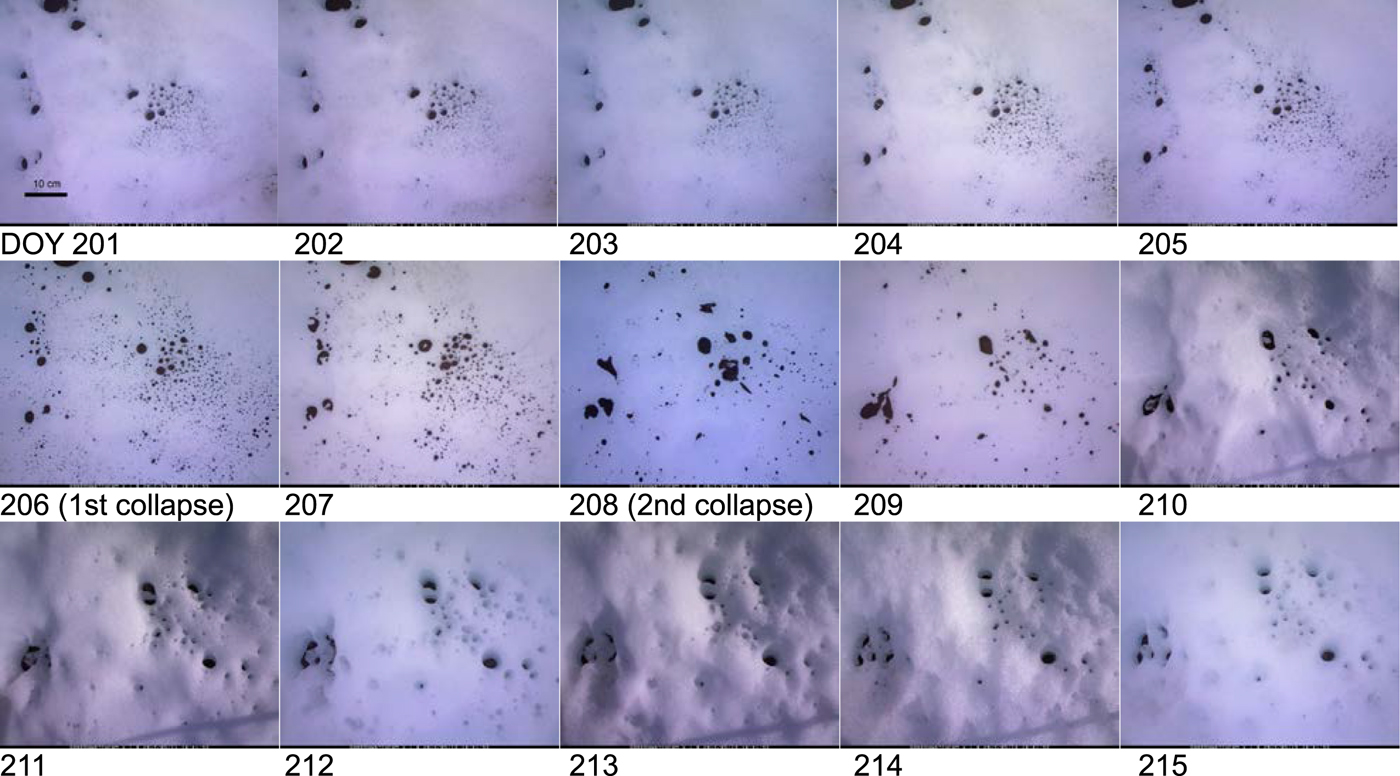
On DOY 206, the number of visible holes in the FOV further increased and some of them were collapsed between 15:00 and 21:00 LT on that day. This was the first collapse event of two observed during the study period. The holes collapsing on this day were mostly the holes smaller than 1 cm in diameter. The cryoconite was washed over the ice surface in the FOV by running meltwater on the ice surface. The other holes appeared to be very shallow, probably <1 cm, but with cryoconite persisting on the floor. The ice surface appeared to be blue on this day rather than the white that was observed before.
The remaining holes retained the cryoconite at their bottom in the next day, but had mostly collapsed between 9:00 and 20:00 LT on DOY 208. This was the second collapse observed in this study and was more drastic than the first collapse. The cryoconite of the most of the holes in the FOV was washed out by the meltwater. The bare ice surface appeared to be blue again when the collapse occurred.
After the second collapse, cryoconite was redistributed on the ice surface by the running meltwater. Holes were then reformed on DOY 210. The number of holes reformed in the image was ~40. Their size ranged from 0.5 to 3.9 cm in diameter. From the day to the end of observation (DOY 215), the holes developed and became deeper. The shape of the holes appeared irregular on site observation when they reformed but it became circular after 5 d. The surrounding ice surface appeared to be white for the last 7 d. The bottom of the smaller holes was hidden in the ice. The final depth of holes was estimated to be 5 cm.
Cryoconite coverage and surface albedo at the study site
Cryoconite coverage on the ice surface in the FOV changed with the development and decay of the cryoconite holes (Fig. 3a). The percentage of cryoconite coverage in the FOV varied from 0.20 to 3.48% (mean: 1.18%). At the start of the observation period, cryoconite coverage was ~1%, and this did not change significantly until DOY 203. This coverage in the FOV then gradually increased to 2.5% on DOY 206 when the first collapse event occurred, and increased again to a maximum of 3.7% with the second collapse event. Following this, coverage decreased to 0.8% as cryoconite holes reformed on DOY 210, and continued to fall to 0.3% at the end of observation on DOY 215.
(a) Hourly cryoconite coverage in the FOV and (b) hourly and 12 h running mean of surface albedo measured near the camera. Uncertainties of threshold (thick gray area) and of shadowing effect (thin-gray area) for the cryoconite coverage are shown. The timings of the two hole collapse events are indicated as dashed gray lines.

Surface albedo (12 h running mean) measured on the ice surface near the camera varied from 0.33 to 0.49 and averaged 0.38 during the study period (Fig. 3b). Because hourly albedo measured was highly fluctuated probably due to instrumental errors and weather conditions such as rain and cloud cover (Arendt, Reference Arendt1999), 12 h running mean was applied to assess their diurnal and daily variations. Diurnal variation dominated the temporal change in albedo over the observation period, with reduced albedo during the daytime. Such oscillation in albedo is likely due to solar elevation and ice surface geometry (Arendt, Reference Arendt1999). On DOY 201, albedo was 0.37 and it fluctuated slightly with a decreasing trend to 0.35 by the second collapse event on DOY 208, being the lowest albedo observed in the study period. Following the second collapse event, albedo rose to the maximum observed value of 0.46 on DOY 212, then decreasing to 0.43 by the end of observation period. There was a significant negative correlation between daily mean of albedo and cryoconite coverage (Fig. 4, r = −0.711, P = 0.001 < 0.05).
Relationship between daily mean cryoconite coverage in the FOV and daily mean albedo measured on the ice surface. Error bars represent std dev. of hourly data on each day.

Meteorological conditions during the study period
Air temperature recorded at the AWS varied throughout the study period: hourly temperatures corrected at the elevation of the study site ranged from 1.9 to 8.8°C (mean: 5.4°C, Fig. 5a). There was no clear diurnal cycle in the air temperature record, although synoptic (3–4 d) cycles appeared evident. It was ~6.5°C on DOY 201, and then gradually decreased to 1.9°C on DOY 206, when the first collapse of holes occurred. Then, it increased suddenly up to 7°C on DOY 208, when the second collapse of holes occurred. It dropped again to 3.5°C on DOY 210. After that, the temperature fluctuated between 5 and 8°C until the end of the observation when the holes developed.
Meteorological conditions observed at the AWS site during the observation period. (a) Air temperature corrected at the study site of cryoconite holes, (b) incident solar radiation, (c) wind speed and (d) relative humidity. The timings of the two hole collapse events are indicated as gray lines.
Solar radiation showed clear diurnal variation reflected from the solar elevation, but its daily mean drastically changed during the study period due to the degree of cloudiness (Fig. 5b). The daily mean of the solar radiation was generally lower in the former half, but higher in the latter half of the study period. It was 209.5 W m−2 on the first day, DOY 201, and then gradually decreased to 70.7 W m−2 on DOY 205, which was 1 d before the first collapse of holes. It increased once and decreased again to 68.2 W m−2 on DOY 209, which was the next day of the second collapse. Then, the mean radiation increased and stayed in the range between 200 and 280 W m−2 until the end of observation.
Wind speed also fluctuated throughout the study period ranging from 0.2 to 9.8 m s−1 (mean: 3.8 m s−1, Fig. 5c). It was moderate ranging from 1.2 to 4.1 m s−1 for the daily mean in the first 5 d (DOY 201–205). Then, it became stronger ranging from 4.2 to 7.5 m s−1 for the daily mean in the middle 5 d (DOY 206–210), including the dates of the two collapses of holes. After the period, it became moderate again, ranging from 2.1 to 4.8 m s−1 in the last 6 d (DOY 211–215).
Relative humidity varied from 51 to 100% throughout the study period (Fig. 5d). The hourly humidity was 50% on DOY 201, and generally increased in the next 3 d. It stayed at nearly 100% from DOY 204 to 206, including the first collapse of holes. Then, it suddenly decreased to 50% on DOY 208 when the second collapse of holes occurred. It became higher again to ~90% in the next 2 d (DOY 209 and 210), then dropped and remained between 50 and 80% in the last 6 d (DOY 211–215). Precipitation was observed on DOY 206. It was snow at the AWS site and accumulated ~1 cm in depth while it was rain at the monitoring site of the cryoconite holes.
Ice surface energy balance
Net radiation was the most dominant energy flux in the glacier surface energy balance during the study period (Fig. 6a). The daily mean of the net radiation varied from 48.6 to 99.1 W m−2 (mean: 78.3 W m−2), which was 33.7–81.7% in the total incoming flux (mean: 63.6%). It was higher in the first 3 d (91.2–98.4 W m−2), lower in the middle 6 d (48.6–72.2 W m−2), and then became higher again in the last 6 d (74.2–99.1 W m−2). The balance of longwave radiation varied from −69.1 to +4.9 W m−2 (mean: −24.6 W m−2). The negative mean value indicates that the longwave radiation was not a heat source for the ice melting but was generally outgoing from the ice surface.
Daily mean of (a) energy balance at the glacier surface, (b) incident solar radiation and (c) ratio of net radiation heat to turbulent heat at the study site obtained from the meteorological data. Equivalent ice melt (ice density: 900 kg m−3) to the flux was shown in the right-vertical axis of (a). The stable, decaying and developing periods of cryoconite holes are divided with dash lines. The dates of the two hole collapse events are indicated with arrows.

Sensible heat was the second dominant energy flux in the glacier surface energy balance during the study period. The daily mean of the sensible heat varied from 10.5 to 97.7 W m−2 (mean: 46.9 W m−2), which was 14.2–62.0% in the net energy flux (mean: 35.1%). It was particularly lower in the 3 d before the first collapse of holes (10.5–28.4 W m−2 in DOY 204–206). In contrast, it was higher in the 2 d before the second collapse of holes (83.5–97.7 W m−2 in DOY 207 and 208).
Latent heat was generally small throughout the study period. The daily mean of the latent heat varied from −12.4 to +26.6 W m−2 (mean: +1.3 W m−2). It was negative on DOY 201, but was positive in the following 6 d, including the first collapse of holes (DOY 202–207). It was lowest on the day of the second collapse of holes, and reached its highest value on the next day. After DOY 210, it was generally slightly negative until the end of observation.
The daily melt rate of the ice surface obtained from the net energy flux ranged from 2.1 to 5.1 cm of ice d−1 (mean: 3.7 cm d−1). Total melt during the study period was 58.5 cm.
DISCUSSION
Development and decay of cryoconite holes
Time-lapse imaging of the glacier surface showed that cryoconite holes drastically changed their dimension and synchronously collapsed twice in the 15-d observation during the ablation season. Although the depth of holes could not be quantitatively measured in this study, development and decay of cryoconite holes on the surface can be visibly recognized. Based on the status of holes in the photographs, the observation period can be roughly divided into three distinct periods: (1) stable period from DOY 201 to 203, when no significant change of holes was observed in the images. (2) Decaying period from DOY 204 to 209, when the depth of holes decreased and two collapses occurred. (3) Developing period from DOY 210 to 215, when holes were reformed and deepened.
According to the previous study by McIntyre (Reference McIntyre1984), the change in hole depth depends on the components of the glacier surface energy balance. Cryoconite holes would develop when the radiative flux is dominant, while they would decay when the turbulent heat is dominant. However, as compared with the glacier surface energy balance, the three distinct periods in the change of holes of the study glacier corresponded to the quantity of the incident solar radiation rather than the ratio of net radiation to turbulent heat (Figs 6b and c). The glacier surface energy balance showed that the net radiation heat was greater than the turbulent heat in most of the study period (ratio >1 in Fig. 6c), but was smaller only in the 3 d from DOY 207 to 209 (ratio <1). The decaying periods of the holes (DOY 204–209) did not correspond to the period when turbulent heat was dominant. On the other hand, the daily mean of incident solar radiation was distinctive between the three periods: it was high in the developing period (186–278 W m−2), medium in the stable period (151–210 W m−2) and low in the decaying period (68–126 W m−2) as shown in Figure 6b. While turbulent heat increases the melt rate of the surface ice, incident solar radiation reaches the bottom of the holes and determines the melt rate of the bottom ice. As hole depth changes due to the balance between the melt rates of the surface and the hole bottom, the fluctuation of turbulent heat is probably less significant compared with that of incident solar radiation on this glacier. Therefore, the incident solar radiation is the major factor changing the hole depth on the glacier. Since cloudiness in the sky determines the quantity of incident solar radiation in a day, the cryoconite holes would generally develop in sunny conditions and decay in cloudy conditions (Fig. 7).
Schematic images of cross section of a cryoconite hole and weathering crust in the conditions of developing and decaying periods.

Conditions inducing collapse of cryoconite holes
Although the collapse of holes occurred twice in the decaying period, the meteorological conditions were distinctive between the two collapses. The first collapse (DOY 206) occurred 3 d after the solar radiation became low, suggesting that the reduction in the melt rate at the hole bottom is one of the causes of this collapse. There was no significant change in the turbulent heat flux in the period. Although the relative humidity was close to 100% in the 3 d, low air temperature and weak wind speed probably counteracted the high humidity. Rainfall occurred on DOY 206 is also a possible factor to induce the collapse. The heat of rain can be calculated from the specific heat capacity of water (4217 J kg−1 K−1), density of water (1000 kg m−3), rainfall rate and rain temperature (Niwano and others, Reference Niwano, Aoki, Kuchiki, Hosaka and Kodama2012). Based on the assumptions that the amount of rain was 10 mm (possible maximum amount) and the rain temperature equaled the daily mean air temperature (2.6°C), the heat of rain on the day of collapse was estimated to be 0.00127 W m−2, which is four orders of magnitude smaller than the total melt heat on the day. Therefore, the first collapse of holes is unlikely induced by the rain event, but likely by progressive shallowing of the hole due to the three successive days of low solar radiation and then by remobilization by water flow.
The second collapse (DOY 208) also occurred under the conditions of low solar radiation and was more drastic compared with the first collapse. The turbulent heat flux was significantly larger than that of the first collapse. In particular, the sensible heat was greater in the 2 d before the collapse and was comparable with the net radiation flux. The abrupt increase in air temperature (from 1 to 5°C) and stronger wind speed (>8 m s−1) observed in the 2 d are likely to cause the high turbulent flux, resulting in high melt rate at the surface. Therefore, the second collapse was likely induced by the increase in melt rate at the surface due to the turbulent flux, in addition to the lower melt rate due to low solar radiation. Neff and others (Reference Neff, Compo, Ralph and Shupe2014) reported that the summer of 2012 in Greenland ice sheet was unusually warm due to transport of warm and humid air from the south and that there were three major warming periods observed at the summit station: DOY 165–173, 191–196 and 208–211. The third warming event was corresponded to the conditions inducing the second collapse. Therefore, this collapse event perhaps occurred under a synoptic-scale warming event.
Cryoconite holes and darkening of glacial surface
The increase in cryoconite coverage on the ice surface coincided with the decaying period of the holes, suggesting that the coverage was associated with the status of the holes. The collapse of the holes would spread cryoconite deposited at the bottom of holes to the surrounding ice surface and result in the increase of cryoconite coverage on the ice surface. However, captured images showed that the increase in coverage was due to the appearance of cryoconite in the ice by surface melting rather than the dispersal of cryoconite from the holes. This is consistent with the observations by Chandler and others (Reference Chandler, Alcock, Wadham, Mackie and Telling2015). About 40 holes were visibly recognized during the first stable period; however, the images indicate that invisible holes or cryoconite granules were hidden below the surface layer of white and porous ice, which is weathering crust (Müller and Keeler, Reference Müller and Keeler1969; Irvine-Fynn and Edwards, Reference Irvine-Fynn and Edwards2014). Weathering crust develops under higher shortwave radiation, which degrades the ice crystals and increases void space and water presence, and hence ice starts looking white due to the lacking integrity of the ice crystal structure (Fig. 7). Multiple scattering by the ice crystals in weathering crust (irregular-shaped ice grains of 1000–5000 µm in radius) can further increase the surface albedo in the range of near infrared (Wiscombe and Warren, Reference Wiscombe and Warren1980; Aoki and others, Reference Aoki2013). During this phase of development, cryoconite will likely be flushed into the developing crust and/or melt in by themselves, and so can reach depth. There are also cryoconite that might be antecedent and essentially emerge over time as ablation takes place. Once turbulent fluxes take over, the albedo feedback that promotes hole and weathering crust development becomes less critical, and so the ice surface itself ablates and cryoconite in holes or within the weathering crust then returns to the surface by melting (Müller and Keeler, Reference Müller and Keeler1969). The emergence of cryoconite from the base of or below the weathering crust is likely to be caused by melting of the crust by the turbulent heat under the weak incident solar radiation during the decay period (Fig. 6). Therefore, the increase in cryoconite coverage on the ice surface is induced by decay of the weathering crust due to change in the incoming heat source on this glacier.
The negative correlation in the temporal changes between the cryoconite coverage and the surface albedo (Fig. 4) suggests that the coverage is a significant contributing factor in the surface albedo and also in the energy balance on the glacier ice. Similar time-lapse imaging on a glacier in Svalbard also consistently showed a negative correlation between the two variables, but showed a larger range in fluctuation of albedo and coverage (0.3–0.6 for albedo by 5–20% of the coverage, Irvine-Fynn and others, Reference Irvine-Fynn, Bridge and Hodson2011). The larger fluctuation is may be due to greater areal abundance of cryoconite on the glacier ice in Svalbard compared with that in Greenland. As shown in this study, the increase of cryoconite coverage was due to the change of the surface ice structure such as cryoconite holes and weathering crust rather than decrease of cryoconite abundance on the ice surface. Therefore, the negative correlation suggests that the albedo of ablation ice surface is affected not only by the abundance of impurities but also by the surface ice structure, which supports the idea of biocryomorphology (Cook and others, Reference Cook, Edwards and Hubbard2015).
Based on the processes revealed in this study, increase in cloudy and windy weather conditions during the ablation season could result in frequent collapse of holes and decay of weathering crust. Such conditions were likely to be frequent particularly in 2012, when this study was conducted because an unusually warm summer took place and the extreme melt event occurred over the Greenland ice sheet (Nghiem and others, Reference Nghiem2012; Niwano and others, Reference Niwano2015). This abnormally high air temperature in 2012 was due to persistent anticyclonic conditions over Greenland associated with anomalies in the North Atlantic Oscillation (NAO, Tedesco and others, Reference Tedesco2013). Although causal relationship between such condition and global warming remains unclear, changes in the atmospheric circulation pattern might cause an increase in cryoconite coverage and a darkening of the ice surface of the ice sheet.
To evaluate quantitatively the effect of cryoconite holes and weathering crust on the surface energy balance, glacier melting, mobility of cryoconite and biogeochemistry on glaciers, the development of physical models of cryoconite holes may have great potential. Studies have proposed simple physical models to demonstrate the depth of cryoconite holes, which can be determined by the difference in melt rates between the surface and bottom of holes (Cook and others, Reference Cook, Edwards and Hubbard2015). However, the models have never been used with a regional climate model to calculate the surface energy balance and total melting for the scale of a glacier, which are usually calculated with a constant albedo value (Musilova and others, Reference Musilova, Tranter, Bamber, Takeuchi and Anesio2016). Using meteorological data, a physical model could reproduce the formation and collapse of cryoconite holes and the development of weathering crust during a melting season. To understand the darkening of the glacier ice and the impact of climate change on the biogeochemical process of glaciers, further development of the hole model and combination with models of regional climate, biological production and impurity abundance are necessary.
CONCLUSION
Time-lapse imaging of cryoconite holes on Qaanaaq Glacier located in northwest Greenland over the 15 d during the melting season revealed that the dimensions of holes temporally changed and that the observation period can be divided into three distinct periods regarding the status of holes: stable, decaying and developing periods. As compared with the meteorological conditions and the glacier surface energy balance, the three distinct periods corresponded to the quantity of the incident solar radiation rather than the dominance of radiation or turbulent heat as suggested by the previous studies. The daily mean of incident solar radiation was large in the developing period, medium in the stable period and small in the decaying period, suggesting that the incident solar radiation mainly controls the hole depth on this glacier. The two hole collapse events observed synchronously in the decaying period are likely to be caused by an abrupt increase in air temperature and wind speed under the cloudy condition. When the holes collapsed, cryoconite granules appeared on the surrounding ice surface as the weathering crust of the ice surface was decayed, resulting in an increase in cryoconite coverage on the ice. This indicates that ice surface darkening occurred with the collapse of holes as induced by cloudy, warm and windy conditions.
Our results indicate that the development and decay of cryoconite holes and cryoconite coverage on the ablation ice surface were controlled by specific weather conditions. This suggests that changes in the atmospheric circulation pattern possibly increase the frequency of hole collapse and darkens the ice surface of glaciers. Such changes in surface ice features could further affect the retention time of cryoconite and biogeochemical cycles on glaciers. Although this study was conducted on a small ice cap in Greenland, the process possibly occur in the ice sheet scale. To evaluate quantitatively the effect of cryoconite holes and weathering crust on the surface energy balance and microbial ecosystems on glaciers and the ice sheet, development of physical models of cryoconite holes and their application to the energy balance and hydrology in the glacier scale are necessary.
SUPPLEMENTARY MATERIAL
The supplementary material for this article can be found at https://doi.org/10.1017/aog.2018.19
ACKNOWLEDGEMENTS
We thank all members of the SIGMA and GRENE projects for their support in the field campaign of 2012 and Sakiko Daorana, Finn Hansen, Hans Jensen and Jesper Olsen for their logistic support. We also thank two anonymous reviewers for valuable suggestions, which improved the manuscript. This study was financially supported by Grant-in-Aids (23221004, 26247078, 26241020 and 16H01772).


 Open access