

The fatty acid (FA) composition of adipose tissue (AT) is considered to reflect habitual intake of FA, particularly of n-3 and n-6 PUFA( Reference Hodson, Skeaff and Fielding 1 ), trans-FA( Reference Brevik, Veierod and Drevon 2 ) and SFA from dairy sources( Reference Baylin, Kabagambe and Siles 3 ). However, the AT content of some SFA, such as palmitic acid, does not reflect dietary intake well, probably because those FA are synthesised de novo, as well as coming from the diet( Reference Hodson, Skeaff and Fielding 1 , Reference Summers, Barnes and Fielding 4 , Reference Hellmuth, Demmelmair and Schmitt 5 ). AT FA composition is also regulated by other factors; for example, increased physical activity is associated with a higher proportion of SFA with a correspondingly lower proportion of MUFA( Reference Sutherland, Woodhouse and Heyworth 6 ), and insulin resistance is associated with an increased proportion of palmitic acid and a decreased proportion of PUFA within AT( Reference Iggman, Ärnlöv and Vessby 7 ). Inflammation within AT is implicated in the development of insulin resistance and other aspects of metabolic syndrome( Reference Kratz, Kuzma and Hagman 8 , Reference Bulló, Casas-Agustench and Amigó-Correig 9 ), and AT inflammation is influenced by FA availability( Reference Siriwardhana, Kalupahana and Cekanova 10 ). Therefore, there is much interest in knowing the FA composition of AT for understanding both dietary intake and AT biology. However, AT biopsy is an invasive procedure and is not practical to conduct in large trials, in the field or in vulnerable populations. In the fasting state, circulating NEFA are primarily derived from AT lipolysis( Reference Hodson, Skeaff and Fielding 1 , Reference Frayn and Humphreys 11 ), and if the composition reflects that of AT, NEFA may provide a minimally invasive surrogate marker of AT FA composition. Previous studies have reported good correlations between FA species in NEFA and AT, although these studies have been limited to a comparatively small number of participants, to cohorts that are not representative of the population or to studying a limited number of FA( Reference Hodson, Skeaff and Fielding 1 , Reference Hellmuth, Demmelmair and Schmitt 5 , Reference Yli-Jama, Haugen and Rebnord 12 ). In the current study, we investigate whether FA profiles of NEFA may act as a surrogate for AT in 204 male and female participants of varying age and BMI. Furthermore, the profiles are investigated before and after a 12-month period of supplementation with marine n-3 PUFA designed to reflect 0–4 portions of oily fish/week and which was demonstrated to modify the FA composition of both plasma NEFA and AT( Reference Browning, Walker and Mander 13 ).
Methods
Data for this analysis were obtained from a two-centre study examining change in FA profiles of nine blood and tissue fractions in response to 12 months of fish oil capsule supplementation equivalent to the amounts of marine n-3 PUFA provided by 0, 1, 2 and 4 portions of oily fish/week (1 portion=1·5 g EPA and 1·77 g DHA), with placebo capsules (high oleic acid sunflower oil) taken on the remaining days( Reference Browning, Walker and Mander 13 ). The study was registered at www.controlled-trials.com as ISRCTN48398526 and is described in detail elsewhere( Reference Browning, Walker and Mander 13 ). All procedures were approved by the Suffolk Local Research Ethics Committee (approval 05/Q0102/181), and written informed consent was obtained from all participants. The study participants were stratified by age and sex( Reference Walker, Browning and Mander 14 ), had a BMI range of 18·5–34·9 (median=25·2) kg/m2 and were all described as healthy. The FA pools studied included AT and plasma NEFA, both of which responded in a dose-dependent manner to the EPA and DHA supplementation, such that at 12 months in NEFA the mean observed values for combined EPA+DHA were 0·53 (sd 0·07) % (P<0·0001) higher per portion (dose), with the 0 portions mean=1·46 (sd 0·65). In AT, the values for combined EPA+DHA were 0·05 (sd 0·01) % (P<0·0001) higher per portion, with the 0 portions mean=0·40 (sd 0·21), as previously reported( Reference Browning, Walker and Mander 13 ).
To monitor background diet, participants completed three unweighed 4-d diet diaries recording food and drink as estimated portions over 3 weekdays and 1 weekend day at 0, 6 and 12 months of the intervention period. Data were analysed using an in-house database( Reference Fitt, Cole and Ziauddeen 15 ). In addition, during the nine study visits over the 12-month period, participants were asked to report any changes in diet, and were asked specific questions related to cooking oils and spreads and to any white fish consumption, and as previously reported there was no difference in reported dietary FA intake during the 12-month period( Reference Browning, Walker and Mander 13 ). Fasting blood samples and an abdominal subcutaneous AT biopsy were taken at 0, 6 and 12 months during a clinic visit. Plasma NEFA and AT were analysed for FA composition. The preparation and analysis of blood and AT samples has been described previously( Reference Browning, Walker and Mander 13 ). Briefly, FA were analysed by GC, performed on a Hewlett Packard 6890 gas chromatograph (Hewlett Packard) fitted with a BPX-70 column (30 m×0·22 mm×0·25 μm; Agilent Technologies). The instrument was controlled by, and data were collected using, HPChemStation (Hewlett Packard). FA methyl esters were identified by comparison of retention times with those of authentic standards run previously.
To determine whether NEFA may be used as a biomarker for AT, the agreement between NEFA and AT for individual FA and FA classes (SFA, MUFA, PUFA, n-3 PUFA and n-6 PUFA) was assessed using Lin’s concordance correlation coefficients( Reference Lin 16 ) at the three time points over the 12-month study (0, 6 and 12 months). The relationship between AT and NEFA was also assessed by Spearman’s rank correlation coefficients at 0, 6 and 12 months. To assess whether NEFA values are a useful surrogate for AT, linear regression models were fitted to the baseline data from a randomly selected sample (70 % of the total cohort, the training set). The outcome variables were FA class in AT with NEFA as a predictor variable. In addition, age, sex and BMI were included as predictor variables where this improved the fit of the models (assessed using R 2 as a measure of explained variance). These models were then used to predict the FA in AT, using baseline data from the remaining 30 % of the data set (the validation set). The differences between the predicted and observed AT FA values were assessed visually using scatter plots and by the mean absolute percentage error (MAPE). The performance of the predicted values was assessed by splitting the observed and predicted values into tertiles to determine whether the predicted values could be correctly assigned into the low-, medium- or high-FA categories.
All analyses were performed with Stata version 13 (StataCorp LP).
Results
Study population
There were 204 participants enrolled into the 12-month study, and 163 participants completed the 12-month visit. The number of participants for whom AT samples were available for comparison with NEFA at each time point and the characteristics of those participants are shown in Table 1.
Characteristics of participants at the three study time points for which there were data available for adipose tissue (AT) and NEFA comparison (Mean values and standard deviations)
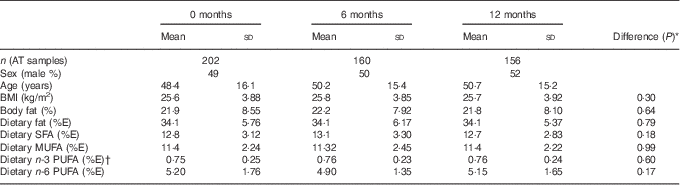
% E, percentage of total energy intake.
* The P value of the difference in means between the three time points assessed by repeated-measures ANOVA.
† Excluding n-3 PUFA provided as the intervention supplements.
There were no differences in any of the characteristics or the dietary fat intake of the participants included at each time point.
The baseline participant characteristics for the training and validation sets used to build and test the prediction models are shown in Table 2. There were no differences in baseline characteristics between the two sets.
Characteristics of participants at baseline in the training set and validation set (Mean values and standard deviations)

% E, percentage of total energy intake; AT, adipose tissue.
* Differences (P) between the training and validation set were assessed by t test.
† Excluding n-3 PUFA provided as the intervention supplements.
Fatty acid profiles in NEFA and adipose tissue in the study population at baseline
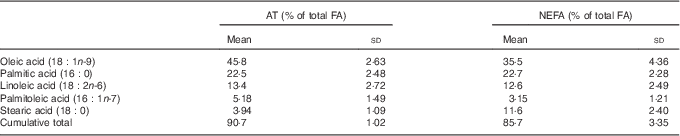
The contributions of SFA and n-3 PUFA to the total FA were higher in NEFA than in AT, whereas the contribution of MUFA was lower in NEFA than in AT (Fig. 1). The proportions of n-6 PUFA were comparable between NEFA and AT. The five most prevalent FA (oleic, palmitic, linoleic, palmitoleic and stearic acid) were consistent in both pools and accounted for 90·8 % of the FA in AT and 85·6 % of the FA in NEFA (Table 3). DHA, EPA and arachidonic acid accounted for 4 % of NEFA, but only 0·7 % of FA in AT.
Comparison of fatty acids by class in adipose tissue (AT) and NEFA at baseline: (a) SFA, (b) MUFA, (c) n-6 PUFA, (d) n-3 PUFA. Data are median, 25 and 75th percentile and range for proportion of total fatty acids contributed by each class.

Proportion of total of the five most abundant fatty acids (FA) in both adipose tissue (AT) and NEFA fractions and the cumulative proportion of total of these FA at baseline (Mean values and standard deviations)
Agreement and relationship between fatty acids in adipose tissue and NEFA
The concordance between AT and NEFA for twenty-eight FA at three time points over the 12-month period is shown in Table 4. Concordance at all three time points was poor (<0·6), but it was highest for linoleic acid (18 : 2n-6; 0·34–0·53 depending upon the time point).
Concordance correlation coefficients between percentage of total fatty acids in adipose tissue and NEFA for each participant at baseline, 6 and 12 months*

* Concordance assessed by Lin’s correlation coefficient. Agreement assessed by Spearman’s correlation coefficient.
Concordance for total SFA, MUFA and n-3 PUFA was poor (<0·1) (Table 4). For total n-6 PUFA, concordance was 0·28–0·43 over the course of the 12-month period.
The relationship between AT and NEFA assessed by correlation coefficient was also poor (<0·59) (Table 4). The relationship was strongest between n-6 PUFA, but in contrast to the agreement SFA and MUFA were moderately correlated (approximately 0·2) at 0 and 6 months (Table 4).
Can NEFA values predict adipose tissue fatty acid values at baseline?
To test whether NEFA may be used as a surrogate for AT FA profiles, prediction models were fitted to baseline data from the training set (70 % of the study population) and then used to predict FA levels in AT in the validation set (the remaining 30 % of the study population). These predicted values were compared with observed values in the validation set (Fig. 2(a) and (b)). We examined n-6 PUFA, which showed moderate concordance between AT and NEFA, and SFA, which showed poor concordance (Table 3).
Predicted adipose tissue (AT) n-6 PUFA and SFA compared with observed AT values at baseline. Predicted AT n-6 PUFA values (a) and SFA values (b) were generated from equations of comparison of NEFA n-6 PUFA and SFA with AT and including age, sex and BMI in the training set. These predicted values for AT n-6 PUFA and SFA were compared with the observed values in the validation set. FA, fatty acids.

There was an association for n-6 PUFA between NEFA and AT in the training set (P<0·0001), although with sex included in the model only 32 % of the variance in the data was explained. Although this model predicted AT n-6 PUFA values with a moderate level of error (MAPE of 11 %, the predicted values performed poorly at discriminating high and low observed levels of AT n-6 PUFA (Fig. 2(a)). Predicted values correctly classified 25 % of values of n-6 PUFA into low, medium or high categories, but misclassified 75 %.
There was a weak association for SFA between NEFA and AT in the training set (P=0·04), which explained only 7 % of the variance in the data (including age, sex and BMI in the model). Consequently, although the values for AT SFA predicted from the model in the validation set had moderately low error compared with the observed AT SFA (MAPE of 8 %), they were poor at discriminating high and low observed levels of SFA (Fig. 2(b)). The predicted values correctly classified 33 % of values into low, medium or high categories of AT SFA according to the observed values, but misclassified 67 %.
Can NEFA predict adipose tissue EPA and DHA after an intervention to increase intake?
There was a strong association between AT and NEFA EPA in the training set at baseline (P=0·001), accounting for age, sex and BMI. However, there was no association following the intervention (P=0·8). Similarly, there was an association between AT and NEFA DHA at baseline in the training set (P=0·014), but not following the intervention (P=0·3). Consequently, these models could not be used to predict proportions of EPA and DHA in AT in the validation set following the intervention.
Discussion
This study shows that despite the majority of plasma NEFA being derived from AT lipolysis, there was poor agreement between FA in AT and NEFA, particularly for SFA. Furthermore, NEFA cannot be used as a minimally invasive surrogate marker to reflect changes in AT in response to a 12-month intervention to increase EPA and DHA consumption.
Although we, and others( Reference Hodson, Skeaff and Fielding 1 , Reference Hellmuth, Demmelmair and Schmitt 5 ,12), have shown moderate to good correlations between FA in AT and NEFA, the agreement described by the concordance in this study was generally very poor. Previous studies tested the relationship between NEFA and AT by correlation coefficient, which indicated a strong linear relationship between the two values, whereas in our study, as we were interested in whether NEFA values may act as a surrogate marker, we have tested agreement by concordance. In line with the findings in this study, a previous study indicated strong correlations between AT FA and NEFA, but with deviation from the line of agreement (the identity line), particularly for n-3 PUFA and SFA (16 : 0 and 18 : 0)(12). In our study, the poor concordance was reflected by a poor ability to predict high and low AT FA values, particularly for SFA (Fig. 2(b)).
The agreement between AT and NEFA was markedly better for n-6 PUFA than any other FA class, as has been found previously in a cohort of patients with myocardial infarction and age-matched controls(12) and in a cohort of women who were predominantly obese( Reference Hellmuth, Demmelmair and Schmitt 5 ). FA are selectively mobilised according to structure( Reference Raclot, Holm and Langin 17 ); generally, mobilisation is greater for essential FA( Reference Raclot, Langin and Lafontan 18 ), greater with the degree of saturation, but lower with chain length for any degree of saturation( Reference Halliwell, Fielding and Samra 19 ). This may explain the greater prevalence of EPA, DHA and arachidonic acid seen in NEFA compared with AT. It has also been suggested that other factors such as physical activity( Reference Sutherland, Woodhouse and Heyworth 6 , Reference Mougios, Kotzamanidis and Koutsari 20 ), BMI( Reference Hellmuth, Demmelmair and Schmitt 5 ) and insulin sensitivity( Reference Yue, Phillips and Davis 21 ) contribute to selective mobilisation of FA. In addition, differences between AT FA profile and NEFA are also contributed to by de novo lipogenesis in particular contributions of SFA, preferential postprandial uptake of FA( Reference Summers, Barnes and Fielding 4 ) and utilisation of n-6 and n-3 PUFA such as arachidonic acid, EPA and DHA for synthesis of eicosanoids and other bioactive compounds( Reference Calder 22 ).
We explored further whether NEFA may be used as minimally invasive markers of changes in AT FA composition in response to changes in n-3 PUFA intake. In this study, we demonstrated that there was poor concordance between EPA (20 : 5n-3) and DHA (22 : 6n-3) before and in response to an intervention to increase EPA and DHA intake. There was an association between AT and NEFA for both EPA and DHA before, but not after, the intervention. This indicates that the supplementation resulted in EPA and DHA changes in one pool that were not mirrored in the other pool. Because of the lack of association, we were unable to create prediction equations to test the accuracy of NEFA as a biomarker of AT n-3 PUFA, as we had done for n-6 PUFA and SFA. However, it is clear from the very poor concordance and the lack of association that NEFA EPA and DHA would not be able to predict AT EPA and DHA with any accuracy. Although EPA and DHA in both AT and NEFA are increased in accordance with an increase in intake( Reference Browning, Walker and Mander 13 , Reference Leaf, Connor and Barstad 23 , Reference Wall, Ross and Fitzgerald 24 ), there is only a moderate correlation between change in AT and NEFA EPA+DHA (Spearman’s correlation=0·27), and we have demonstrated here that changes in AT cannot be predicted from changes in NEFA. We have suggested previously that blood markers, particularly mononuclear cells, may be better at discriminating long-term changes in EPA and DHA intake than AT( Reference Browning, Walker and Mander 13 ).
AT FA profile has important implications for biological function; in particular, proportions of arachidonic acid, EPA and DHA affect the inflammatory profile( Reference Calder 22 , Reference Fan, Zirpoli and Qi 25 ). Although there are strong correlations between AT FA in subcutaneous and visceral depots, differences in proportions of specific FA between the depots have been found; for example, FA of longer chain length (>22 C) are more predominant in subcutaneous AT and highly unsaturated FA in visceral depots( Reference Hellmuth, Demmelmair and Schmitt 5 ). In addition, there are differences in FA profile and metabolism between subcutaneous AT depots of different origins( Reference Malcom, Bhattacharyya and Velez-Duran 26 , Reference Pinnick, Neville and Fielding 27 ). This may contribute to the lack of concordance found between AT and NEFA in this study, and it would limit the utility of NEFA as a surrogate for AT FA, as profile differences important for AT biological function would not be reflected in the overall NEFA profile.
This study has several strengths, as it assessed the agreement of a number of FA (twenty-eight) between AT and NEFA at repeated time points over a 12-month period. We measured forty FA, but because of low amounts in one or other of the pools data for twelve FA could not be used. This study was conducted in male and female participants of a wide age and BMI range, representative of the population, and in a comparatively large number of individuals. We also assessed the utility of NEFA as a surrogate for changes in AT FA in response to a 12-month intervention to increase EPA and DHA consumption. A limitation of this study is that AT was only sampled from the abdominal subcutaneous depot. There are differences in FA profile and metabolism of FA between subcutaneous and visceral depots, as well as between subcutaneous depots at different locations( Reference Malcom, Bhattacharyya and Velez-Duran 26 , Reference Ibrahim 28 ), which may explain the poor agreement between NEFA and AT FA found in the current study. It is possible the NEFA better reflect the FA profile of visceral AT, and as this depot is even more invasive to sample from it would be useful to know whether NEFA are a good reflection of this more biologically active depot( Reference Ibrahim 28 ).
In conclusion, despite moderate correlation between AT and NEFA FA profiles, NEFA are not a suitable surrogate for AT FA.
Acknowledgements
The authors acknowledge the contributions of Joanna Gambell, Louise Timbers, Clionadh O’Reilly, Mariana Eberhard, Katey Bergstralh, Sarah Gibbings (Research Assistants), Darren Cole (Database Manager), Laura Wang, Stephen Young, Sadiq Lula, Christine Clewes, Christiaan Gelauf, Jade Pretorius (fatty acid analysis), Alison Lennox, Birgit Teucher, Anna Gent, Celia Greenberg (coding and analysis of dietary data), Mario Siervo, Rosemary Hall and Sue Fisher (Clinical Support). We appreciate the contribution to the original trial of Adrian Mander, as well as statistical advice for this study. We thank Leanne Hodson for useful discussions.
The UK Medical Research Council supported L. M. B., C. G. W., S. A. J. (grant code U1059.60.389) and L. S. (grant code U1052.00.014) for this work. The original trial was funded by the UK Foods Standards Agency (N05065/66). The views expressed are those of the authors and do not necessarily reflect UK Government policy or advice. Equazen (Wallingford, Oxford, UK) supplied the capsules for the intervention.
C. G. W. and P. C. C. conceived this study; C. G. W. and L. S. conducted the analysis; C. G. W. drafted the manuscript; L. M. B., S. A. J. and P. C. C. designed the original trial; L. M. B., C. G. W., A. L. W. and J. M. conducted the research on the original trial. All authors critically appraised the manuscript.
The authors declare no conflicts of interest relevant to this paper.


 Open access