


Introduction
The first unpiloted aerial sprayer came about in 1983 when Yamaha launched the model R50, a dual-rotor remote-controlled aerial spraying system. However, the R50 was withdrawn from the market due to issues with payload weight and altitude sensors (Sato Reference Sato2003). The use of unmanned (or unpiloted) aerial vehicles (UAVs) in U.S. agriculture grew rapidly after 2016, when the U.S. Federal Aviation Administration (FAA) published regulations governing small, unmanned aircraft systems (14 CFR §107) (Rodriguez Reference Rodriguez2021). The drones being used today for spraying applications are referred to as large, unmanned aircraft systems (lUAS) by the FAA. Flying an lUAS requires an organization or individual to have obtained an exemption to the FAA regulations under various parts of 14 CFR, including §137 (Dispensing Chemical and Agricultural Products), §44807 (Special Authority for Certain Unmanned Aircraft Systems), or §107 (Remote Pilot). According to the data gathered by the FAA, most of the §44807 exemptions granted so far in the United States have been for agricultural spraying operations. In 2022 the FAA granted 366 exemptions to §44807, which was a 450% increase from 2021, and only 8% of those exemptions were amendments or extensions of existing §44807 exemptions. Eighty-five percent of those exemptions were granted for agricultural spraying applications, an increase of approximately 600% from 2021. Agricultural spraying also made up 92% of the §44807 exemptions in 2021 (FAA 2022, 2023).
When considering all of the available options for growers to apply pesticides, UAVs offer the potential advantages of lower operational and maintenance costs, ability to land without a designated airstrip, and increased maneuverability through their ability to fly forward, backward, sideways, and hover, as compared to traditional piloted aircraft (Cavalaris et al. Reference Cavalaris, Karamoutis and Markinos2022; del Cerro et al. Reference del Cerro, Cruz Ulloa, Barrientos and de León Rivas2021; Sugeno et al. Reference Sugeno, Hirano, Nakamura and Kotsu1995). Additionally, UAVs do not produce mechanical crop damage or soil compaction, which commonly occur with ground-based sprayers. Using a UAV to apply herbicides can also occur when field conditions are unsuitable for ground-based sprayers, or when the surrounding terrain is too hazardous for piloted aircraft spraying (Pathak et al. Reference Pathak, Kumar, Mohapatra, Gaikwad and Rane2020). UAVs are also highly versatile and allow the pilot/applicator to set various parameters such as application height above the target canopy, application speed, spray volume, spray classification, swath spacing, and flight path before spraying (DJI Agriculture Reference Agriculture2024; Martin et al. Reference Martin, Woldt and Latheef2019; Qin et al. Reference Qin, Qiu, Xue, Chen, Xu and Zhou2016). Although UAVs provide a range of potential advantages, their small payload capacity requires them to carry an ultra-low or very low volume, and droplets from a UAV tend to suspend in the air longer, allowing more time for wind to push droplets away from the target area (Huang et al. Reference Huang, Wang, Li, Zhang, Zeng and He2023).
Teske et al. (Reference Teske, Wachspress and Thistle2018) reported that pesticides applied with a UAV above a critical threshold speed reduces the downward force from the UAV propellers and allows droplets to suspend in the air for a longer period of time. However, Teske et al. (Reference Teske, Wachspress and Thistle2018) also found that operating below a critical threshold speed improves downward force, which contributes to less off-target spray movement. Other studies have been conducted to evaluate additional application parameters such as spray height, spray classification, and nozzle types on off-target spray movement (Grant et al. Reference Grant, Perine, Abi-Akar, Lane, Kent, Mohler, Scott and Ritter2022; Martin et al. Reference Martin, Woldt and Latheef2019; Shan et al. Reference Shan, Wang, Wang, Xie, Wang, Wang, Chen and Lan2021; Teske et al. Reference Teske, Wachspress and Thistle2018). A variety of other studies have also been conducted that compare applications of insecticides and harvest aids from UAV and ground-based sprayers (Cavalaris et al. Reference Cavalaris, Karamoutis and Markinos2022; Li et al Reference Li, Giles, Niederholzer, Andaloro, Lang and Watson2021; Qin et al. Reference Qin, Qiu, Xue, Chen, Xu and Zhou2016). However, to date, very little research has been conducted to evaluate the spray uniformity, swath width, off-target movement, and weed control efficacy with herbicides applied from a UAV compared to a commercial ground-based sprayer. Because UAVs would most commonly apply pesticides at much lower spray volumes than ground-based sprayers due to small payload capacities, spray coverage is a concern with herbicide applications made with UAVs considering coverage has a direct impact on the efficacy of many herbicides (Prokop Reference Prokop2009). There are also questions pertaining to how various UAV spray parameters and settings will affect swath width, spray quality, and crop canopy penetration.
Therefore, the objectives of this research were to 1) evaluate weed control, spray coverage and uniformity, and off-target movement following herbicide applications from a DJI Agras T40 UAV compared to a ground-based sprayer; 2) determine the effects of application speed, height above the soybean canopy, and application rate on spray coverage with the Agras T40 UAV; and 3) evaluate late-season spray penetration in soybean with the Agras T40 UAV compared to a ground-based sprayer.
Materials and Methods
DJI Agras T40 UAV versus Ground-based Sprayer Experiment
A field experiment was conducted in a randomized complete block design in three separate soybean fields in central Missouri in 2023 and 2024. In 2023, experiments were carried out in Callaway (39.04oN, 92.17oW) and Cooper (38.9°N, 92.72°W) counties, and also in Boone County (38.99°N, 92.09°W) in 2024. Each field was selected based on the presence of natural infestations of waterhemp that required a postemergence herbicide treatment. Table 1 provides a summary of the soybean varieties, height, and stages at the time of application, as well the size, density, and type of weed species present. At each location, individual plots were 30 m wide by 73 m long with three replications of each treatment. Two treatments were evaluated at each location; a postemergence herbicide applied with a commercial ground-based sprayer with standard sprayer settings for the herbicide chosen (Table 2), and the same herbicide applied with an Agras T40 UAV (DJI, Nanshan, Shenzhen, China). Wind speed and direction relative to the machines spray direction at the time of application for the Boone County site was a crosswind that averaged 3.3 m s−1, while the Cooper County site had a head or tailwind that averaged 2.24 m s−1, and the Callaway County site had a partial crosswind averaging 1.34 m s−1.
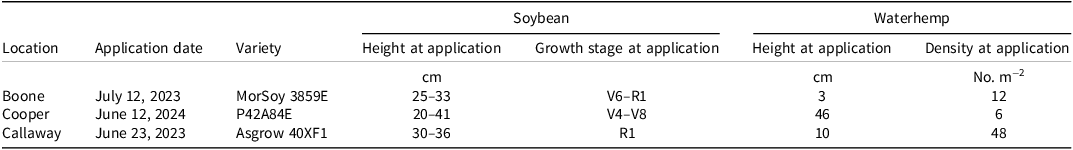
Soybean height and growth stage and waterhemp height and density at the time of herbicide application at each location.

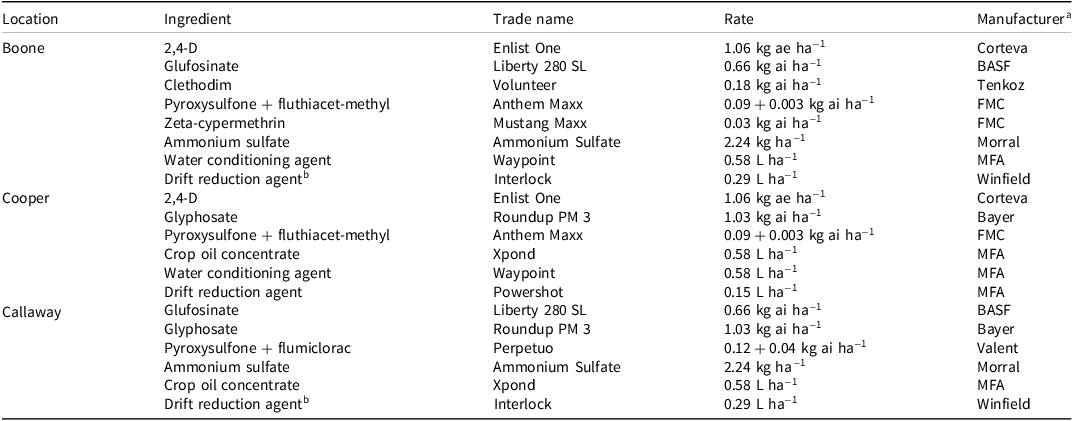
Treatments applied at each location.

a Manufacturer locations: BASF, Raleigh, NC; Bayer, St. Louis, MO; Corteva, Indianapolis, IN; FMC, Philadelphia, PA; MFA, Columbia, MO; Morral Companies, Morral, OH; Tenkoz, Alpharetta, GA; Valent, Winfield, St. Paul, MN.
b Included only when applied with the unmanned aerial vehicle.
Commercial ground-based sprayers varied by location (Table 3). Ground-based sprayers were chosen on the basis of what the commercial applicator assisting us with the research had available. At the Boone and Callaway County locations we used the same John Deere 4830 without Pulse Width Modulation (PWM) (John Deere, Moline, IL) at 187 L ha−1 spray volume while at the Cooper County location we used a Case IH 3340 equipped with PWM (Case IH, Racine, WI) at a 140 L ha−1 spray volume. The ground-based sprayers each had a boom length of 30 m and sprayed 0.5 to 0.9 m above the target canopy (Table 3). All ground-based sprayers maintained a speed of 4 m s−1 to 5.4 m s−1 and made a single pass over each plot. Different nozzle types were used at all locations. The same Agras T40 UAV was used at all locations. The Agras T40 was set to deliver a 28 L ha−1 spray volume, a swath width of 10 m, a 3-m spray height, and 7 m s−1 application speed at all locations. Agras T40 applications required three passes in each plot to equate to one sprayer pass.
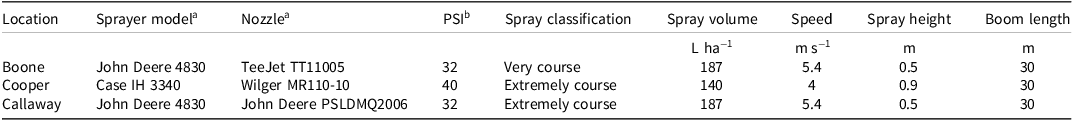
Parameters and settings used by the ground-based sprayers at each location.

a Sprayer and nozzle manufacturer locations: Case IH, Racine, WI; John Deere, Moline, IL; TeeJet Technologies, Glendale Heights, IL; Wilger, Lexington, TN.
b PSI, pounds per square inch.
The Agras T40 has two atomization nozzles at the rear of the aircraft. Spray classification is controlled by adjusting settings on the hand-held remote. In both years, the Agras T40 was set to the maximum spray classification capability of the software. However, as a result of a software update that occurred in 2023, the spray classification changed from an extremely coarse spray setting to a very coarse spray in 2024. Spray classification measurements were selected according to the scale given by the DJI software in the remote control unit.
The herbicides and adjuvants applied at each location differed and were selected based on the recommendations of the cooperating agricultural retailer. Table 2 contains a list of the treatments applied at each location. All UAV treatments included a drift reduction agent even if one was not included in the ground sprayer application by the cooperator based on commercial popularity and retailer recommendations.
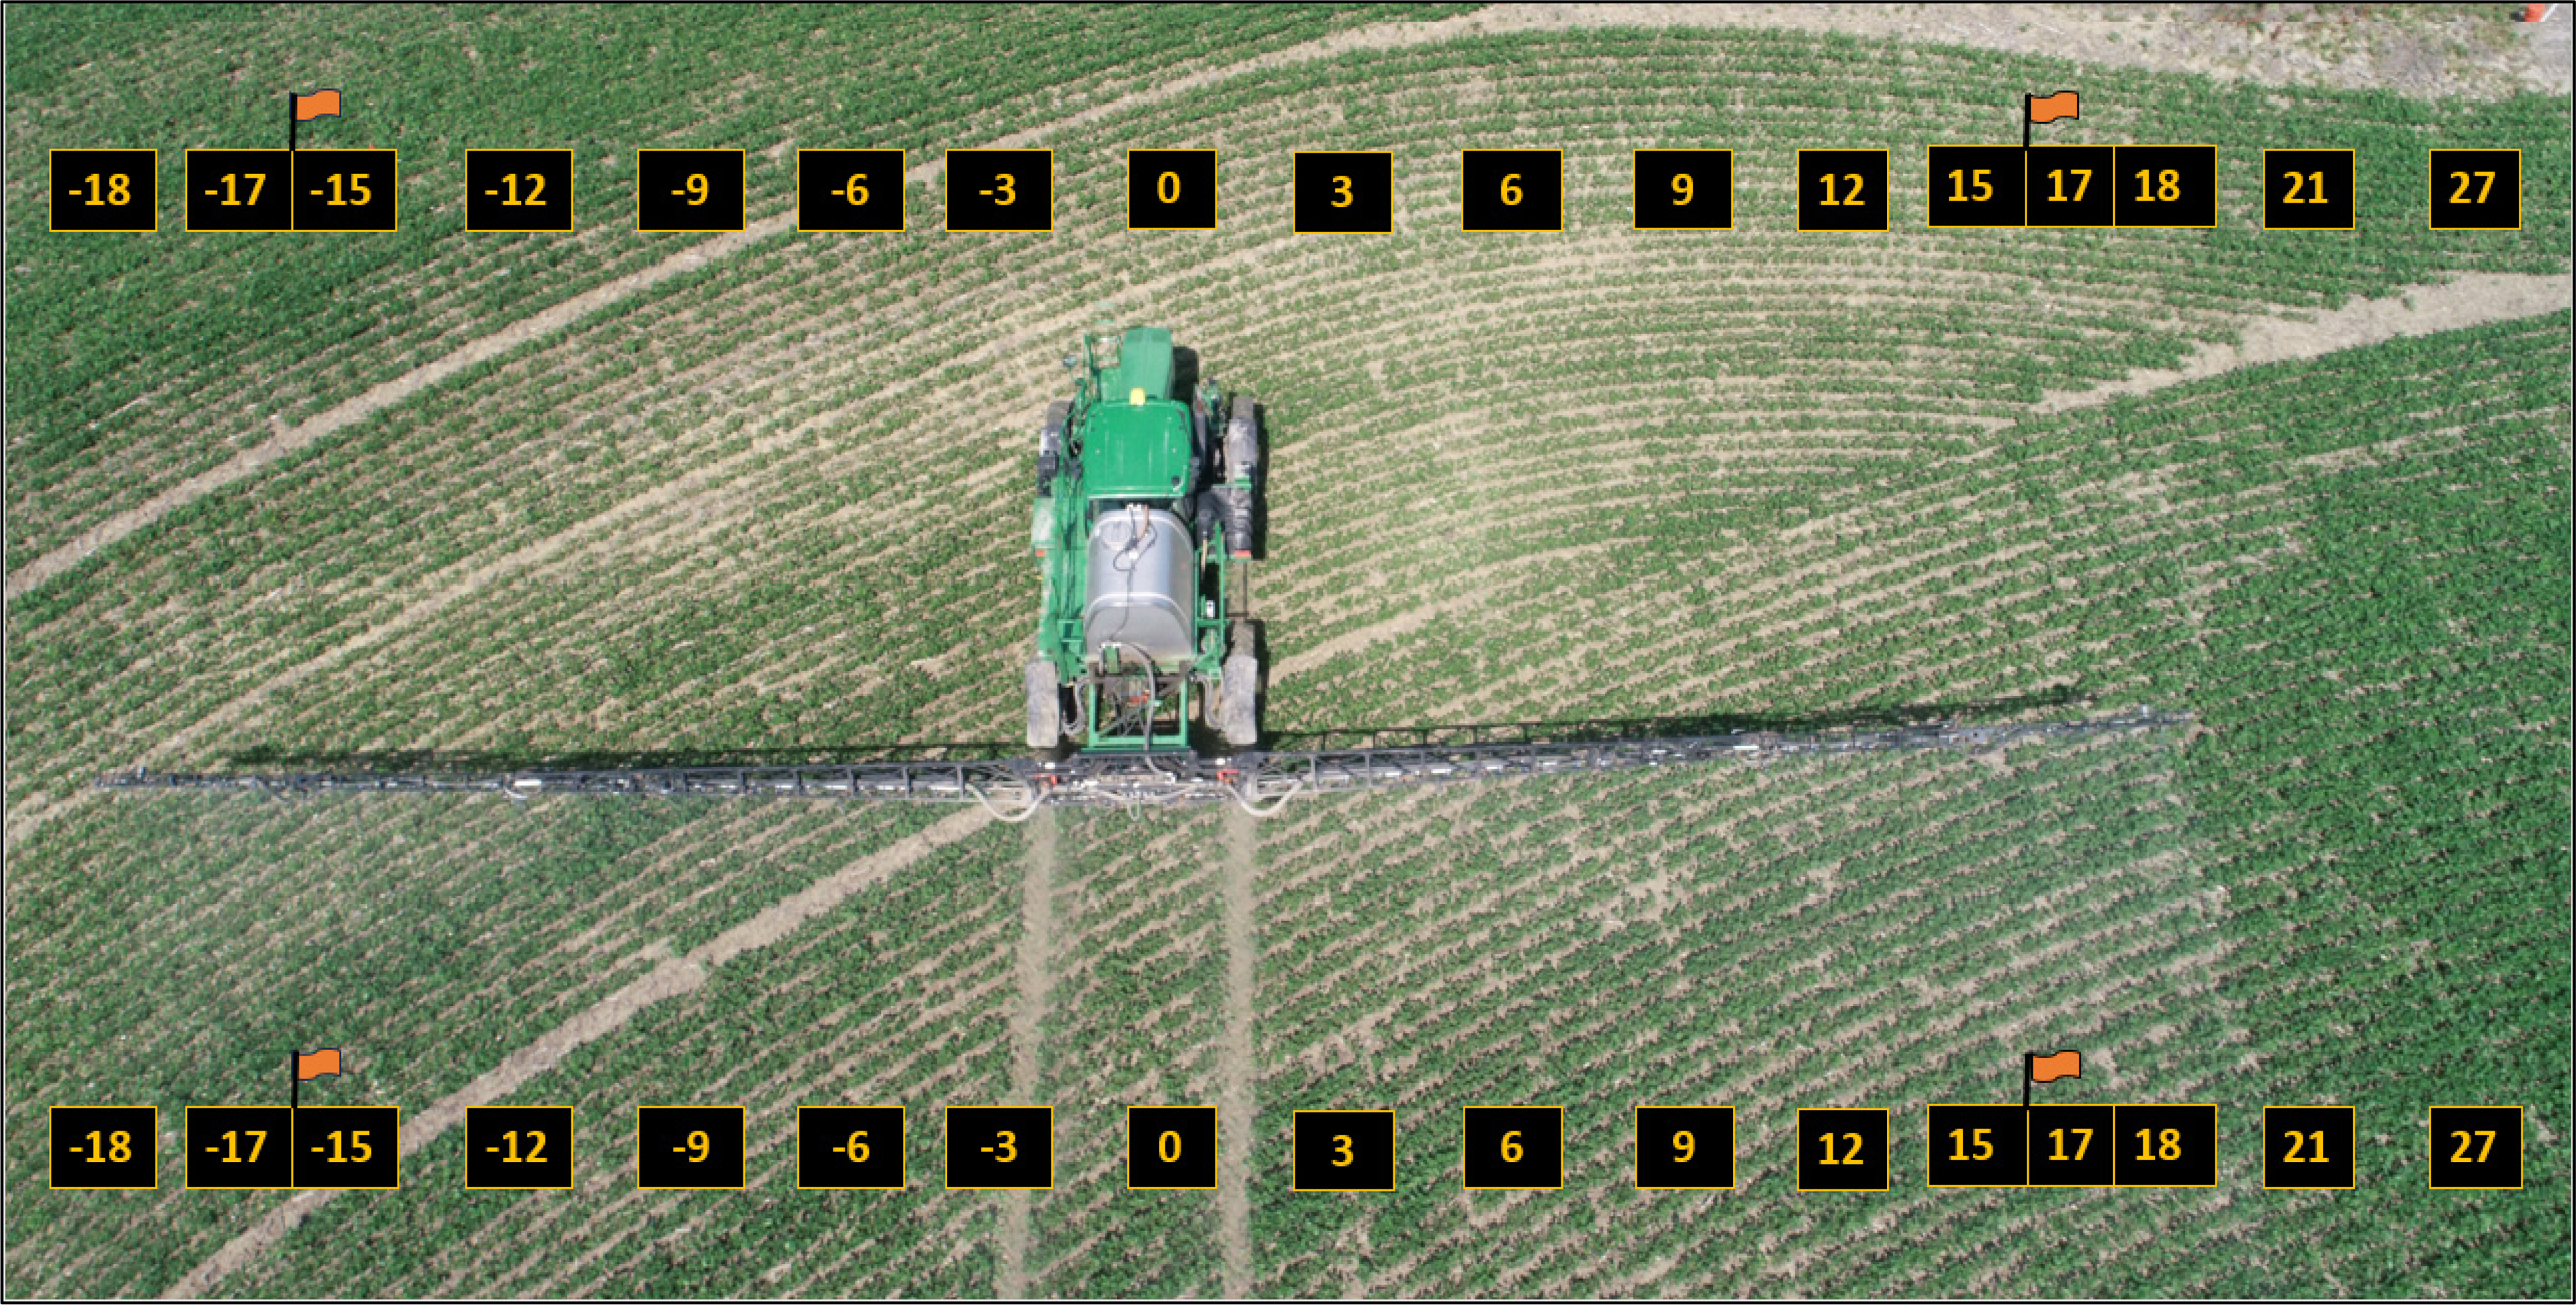
Spray coverage was determined by placing 5- × 8-cm water sensitive paper (WSP) cards (SpotOn Paper; Innoquest Inc. Woodstock, IL) along two lines that occurred perpendicular to the direction of the soybean rows and across the width of each 30 m by 73 m plot. WSP cards were placed parallel to the soil surface on metal sign holders at a height that was even with the top of the soybean canopy. The spacing and placement of WSP cards within each plot is illustrated in Figure 1. Additional WSP cards were placed 1.5 m, 3 m, 6 m, and 12 m on either side of the plot to capture off-target movement of spray droplets. Off-target movement was determined by comparing the coverage of WSP cards at the off-target movement sampling points by the corresponding coverage of the WSP card at the boundary inside the target area. This was accomplished for both the ground sprayer and UAV as a way to offset the effect of the ground sprayer’s 140 L ha−1 and 187 L ha−1 coverage compared to the UAV’s much lower spray volume of 28 L ha−1. Soon after each spray application occurred, all WSP cards were collected and placed in individual paper bags that denoted the location of each card along the swath width and then stored in a cool, non-humid location until subsequent scanning and image analysis occurred. WSP cards were scanned with a digital flatbed scanner (Perfection V370 Photo Scanner; Epson, Suwa, Nagano, Japan) at a resolution of 600 dpi at 24-bit color. Total coverage was determined using ImageJ software (Bethesda, MD) by creating a macro using the color threshold technique and batch processing for particle analyzation. Different threshold values were used for each location each year in order to obtain the clearest picture in ImageJ on the basis of WSP condition at the time of scanning.
Water-sensitive spray card placement in the Agras T40 UAV versus ground-based sprayer experiment. The Agras T40 UAV passes occurred at approximately the −9 m, 0 m, and 9 m card locations.

Visible evaluations of weed control were taken 7, 14, and 21 d after treatment where each WSP card within each plot had been located. These ratings occurred on a scale of 0% to 100%, where 0% which represented either no injury or weed control from the time of application to 100%, which represented either complete weed control or death of all soybean plants. No weed or soybean injury evaluations were carried out at the Boone County site due to additional herbicide contamination of the plot area that occurred following the initial UAV and ground sprayer applications.
Visible weed control, visual soybean injury, spray card coverage, and adjusted off-target movement were analyzed using the GLIMMIX procedure with SAS software (v.9.4; SAS Institute Inc., Cary, NC). Means were separated using a Fisher protected LSD test at P = 0.05. In the ANOVA model, equipment, card location, and site-year combinations were treated as fixed effects, while replication nested within site-year was included as a random effect. Site-year was treated as fixed due to differences in application equipment, herbicide programs, and environmental conditions among locations. Spray coverage uniformity among card locations within each application method was evaluated using paired t-tests.
Application Parameter Study
A field experiment was conducted in 2023 and repeated in 2024 to determine the effects of spray height, application speed, and spray volume with the Agras T40 UAV on spray coverage and waterhemp control in soybean. The treatments evaluated included a factorial arrangement of two spray heights (3 m and 4.5 m) above the soybean canopy, two spray volumes (28 L ha−1 and 56 L ha−1), and two application speeds (4 m s−1 and 8 m s−1). A nontreated control was also included for comparison. Experiments were conducted at the Bradford Research Center near Columbia, Missouri (38.89°N, 92.21°W). Individual plots were 7.6 m by 61 m arranged in a randomized complete block design with four replications. Intended swaths were 7.6 m to 10 m on the basis of retailer recommendations.
In both years, a combination of glufosinate (0.86 kg ai ha−1, Liberty 280 SL; BASF, Florham, NJ) + ammonium sulfate (3.4 kg ha−1, ZippSol; Martin Operating Partnership, Kilgore, TX) + a drift reduction agent (0.29 L ha−1, InterLock; Winfield United, Arden Hills, MN) was applied with the Agras T40 UAV to waterhemp that ranged in height from 17 cm to 30 cm tall and occurred as escapes in soybean fields. We planted the soybean variety Ag38FX1 (Asgrow, Creve Coeur, MO), which is resistant to dicamba, glyphosate, and glufosinate. Seeds were planted in 76-cm rows and averaged 30 cm tall when sprayed. The spray classification was set to its maximum capability (extremely coarse in 2023 and very coarse in 2024). Pink sprayer foam dye (Tracer Hot Pink Marking Foam Colorant; Precision Laboratories, Kenosha, WI) was added to the herbicide mix at 15 mL L−1 to obtain droplets to stain the Kromekote cards (Kromekote C/1S White; CTI Paper USA, Sun Prairie, WI) according to the methods described by Legleiter et al. (Reference Legleiter, Young and Johnson2018). We used this method instead of the WSP cards described previously to mitigate card damage from handling and humidity.
Cards were arranged across the width of each plot in two lines spaced equidistantly 20 m from either end of the plot. Three 22 cm by 28 cm Kromekote cards were placed in each line with one directly underneath the UAV and then one 3 m away on either side for a total of three cards per line and six cards per plot. Kromekote cards were placed in each line even with the height of the top of the soybean canopy on metal sign holders. Cards were then assigned numbers correlating to their distance from the center width of the plot. Single-pass spray applications were then flown with the Agras T40 UAV across each plot. Cards were collected and scanned at a resolution of 600 dpi as 24-bit color. Coverage data were processed using ImageJ software by creating a macro using the color threshold technique and batch processed for particle analyzation. The same color threshold settings were applied for the 2023 and 2024 studies.
Visual evaluations of weed control and soybean injury were taken 14 d after treatment at the location of each Kromekote card within each plot. The area rated was a 1.5-m segment between the soybean row with the center of the area being where the card was located during application. The soybean plants on each side of the 1.5-m segment were evaluated for crop injury. These ratings were made on a scale of 0% to 100%, where 0% represented either the weed control present in nontreated plots or no soybean plant injury to 100%, which represented either complete weed control or death of all soybean plants. Visible weed control, visible soybean injury, and Kromekote card coverage was analyzed using the GLIMMIX procedure with SAS software. Means were separated using a Fisher protected LSD test at α = 0.05. Fixed effects included spray height, spray volume, application speed, sampling distance, and year, while block nested within years were treated as random effects.
Results and Discussion
UAV Versus Ground-Based Sprayer
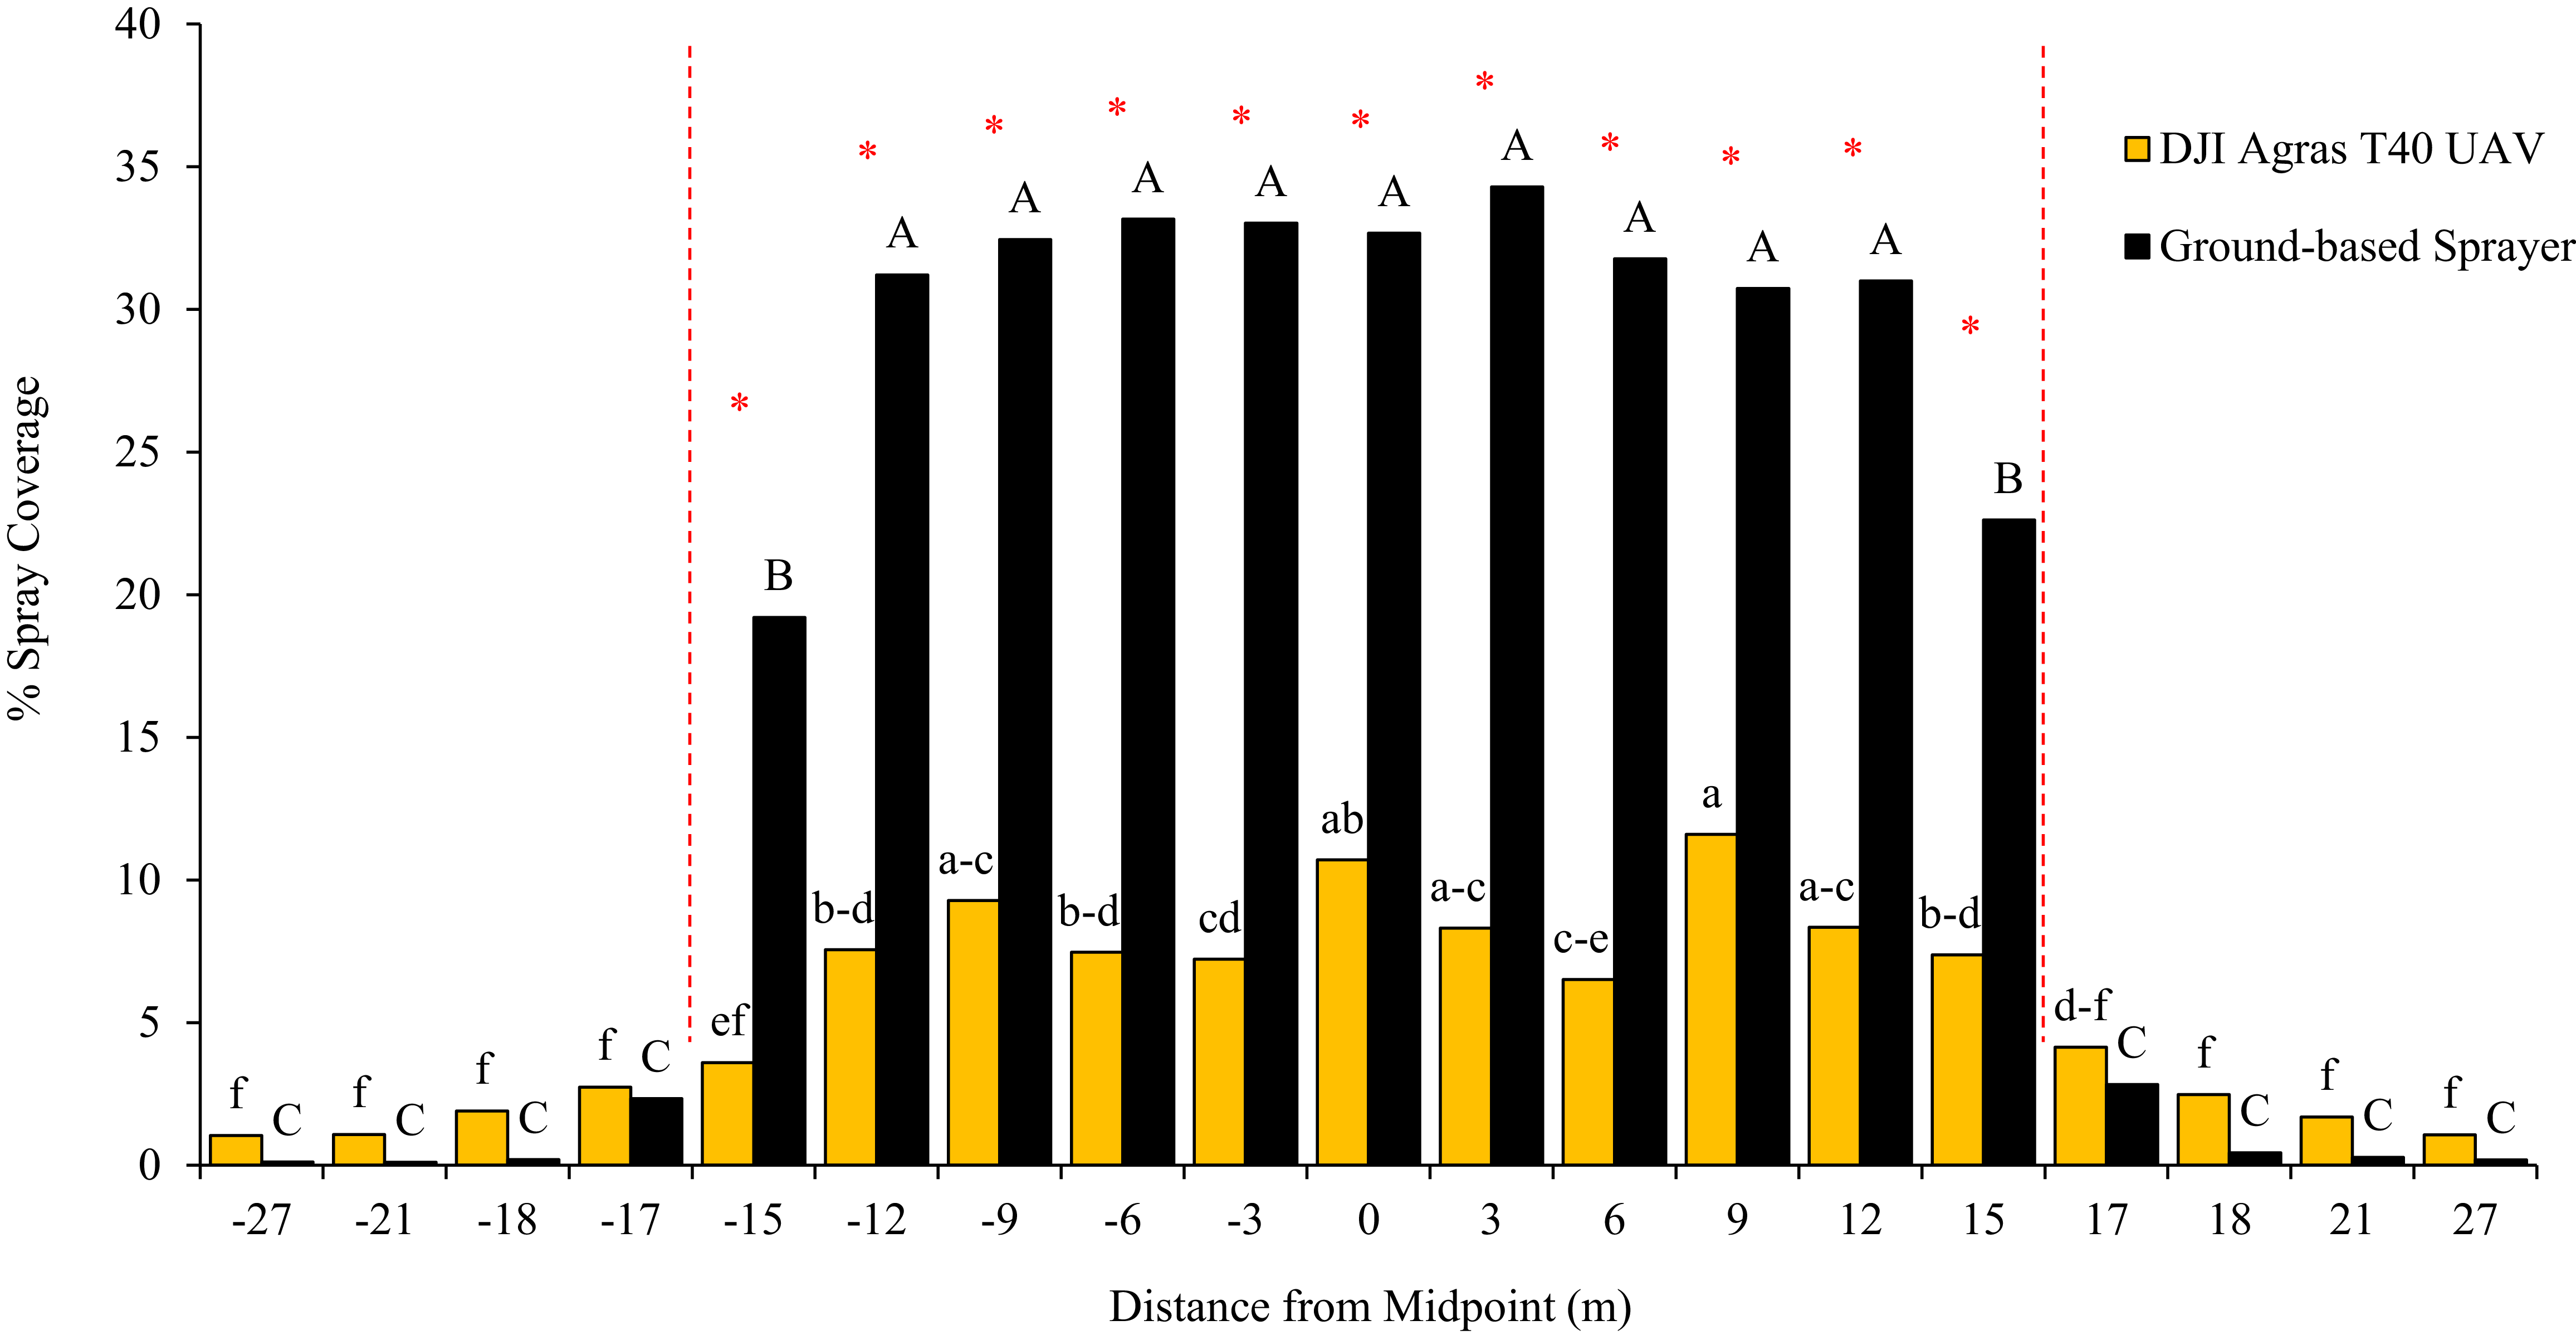
Site-year effects and interactions involving site-year were not significant for spray coverage (P = 0.06); therefore, data were pooled across environments. Ground-based sprayers provided greater spray coverage than the UAV at all card locations across the swath width (P < 0.0001; Figure 2). Coverage declined toward the edges of the swath with both application methods, reflecting reduced overlap at boom or flight margins.
Spray coverage distribution of water-sensitive spray cards with the DJI Agras T40 UAV and ground-based sprayers. Dashed red lines indicate the boundaries of the plot and the beginning of off-target movement cards. Passes with the Agras T40 UAV occurred at approximately the −9 m, 0 m, and 9 m card locations. Bars within a color followed by the same letter uppercase or lowercase letters are not different according to the Fisher protected LSD test at α = 0.05. Asterisks (*) indicate significant difference between paired bars based on t-test analysis. Results are combined across the Callaway, Cooper, and Boone County locations.

Spray coverage of the canopy cards ranged from 19% to 33% with the ground-based sprayer and from 3% to 11% with the Agras T40 UAV (Figure 2). The ground-based sprayers provided greater spray coverage at each location within the plot width than the UAV. However, coverage of WSP cards placed at the ends of the ground sprayer swath (±15 m from midpoint) was 12% to 15% less than the coverage of all other WSP cards within the ground sprayer’s plot width. This is likely due to the lack of sufficient overlap that would be supplemented on the next pass, according to standard ground-sprayer design and application techniques (Wolf Reference Wolf2009; Table 3). Although spray coverage along the length of the plot was slightly more variable with the Agras T40 UAV than with the ground-based sprayers, only the −15 m spray card location had lower spray coverage than most other locations within the plot. Three passes of the UAV were required to equate to one pass of the ground-based sprayer’s plot width, and greatest WSP card coverage occurred at the −9 m, 0 m, and 9 m card locations from the midpoint, which were the approximate center lines of flight for the UAV. Observing spray coverage decrease as the distance grows farther from the center of the UAV is consistent with observations reported by Byers et al. (Reference Byers, Virk, Rains and Li2024), who found that spray coverage ranged from 8.8% to 9.7% directly below the UAV. However, the total average coverage was 2.5% to 2.6% when taking the entire target swath into account. Target swath widths ranged from 2 m to 9 m in the experiments reported by Byers et al. (Reference Byers, Virk, Rains and Li2024). Xue et al. (Reference Xue, Lan, Sun, Chang and Hoffmann2016) also conducted a similar study in which multiple UAV parameters were evaluated in a three-pass experiment to establish ideal target swath widths. Although sedimentation rate was measured instead of percent coverage, Xue et al. (Reference Xue, Lan, Sun, Chang and Hoffmann2016) demonstrated similar results pertaining to the distribution of coverage along the target swath. Xue et al. reported having an ideal swath of 7 m compared with 9-m and 5-m swath widths indicating that target swaths can be set too wide and too narrow for UAVs. These findings reinforce the importance of achieving the ideal swath width to obtain proper overlap and prevent gaps in coverage that lead to weed escapes, and/or overapplication and potential crop damage (Qasem Reference Qasem and Kortekamp2011).
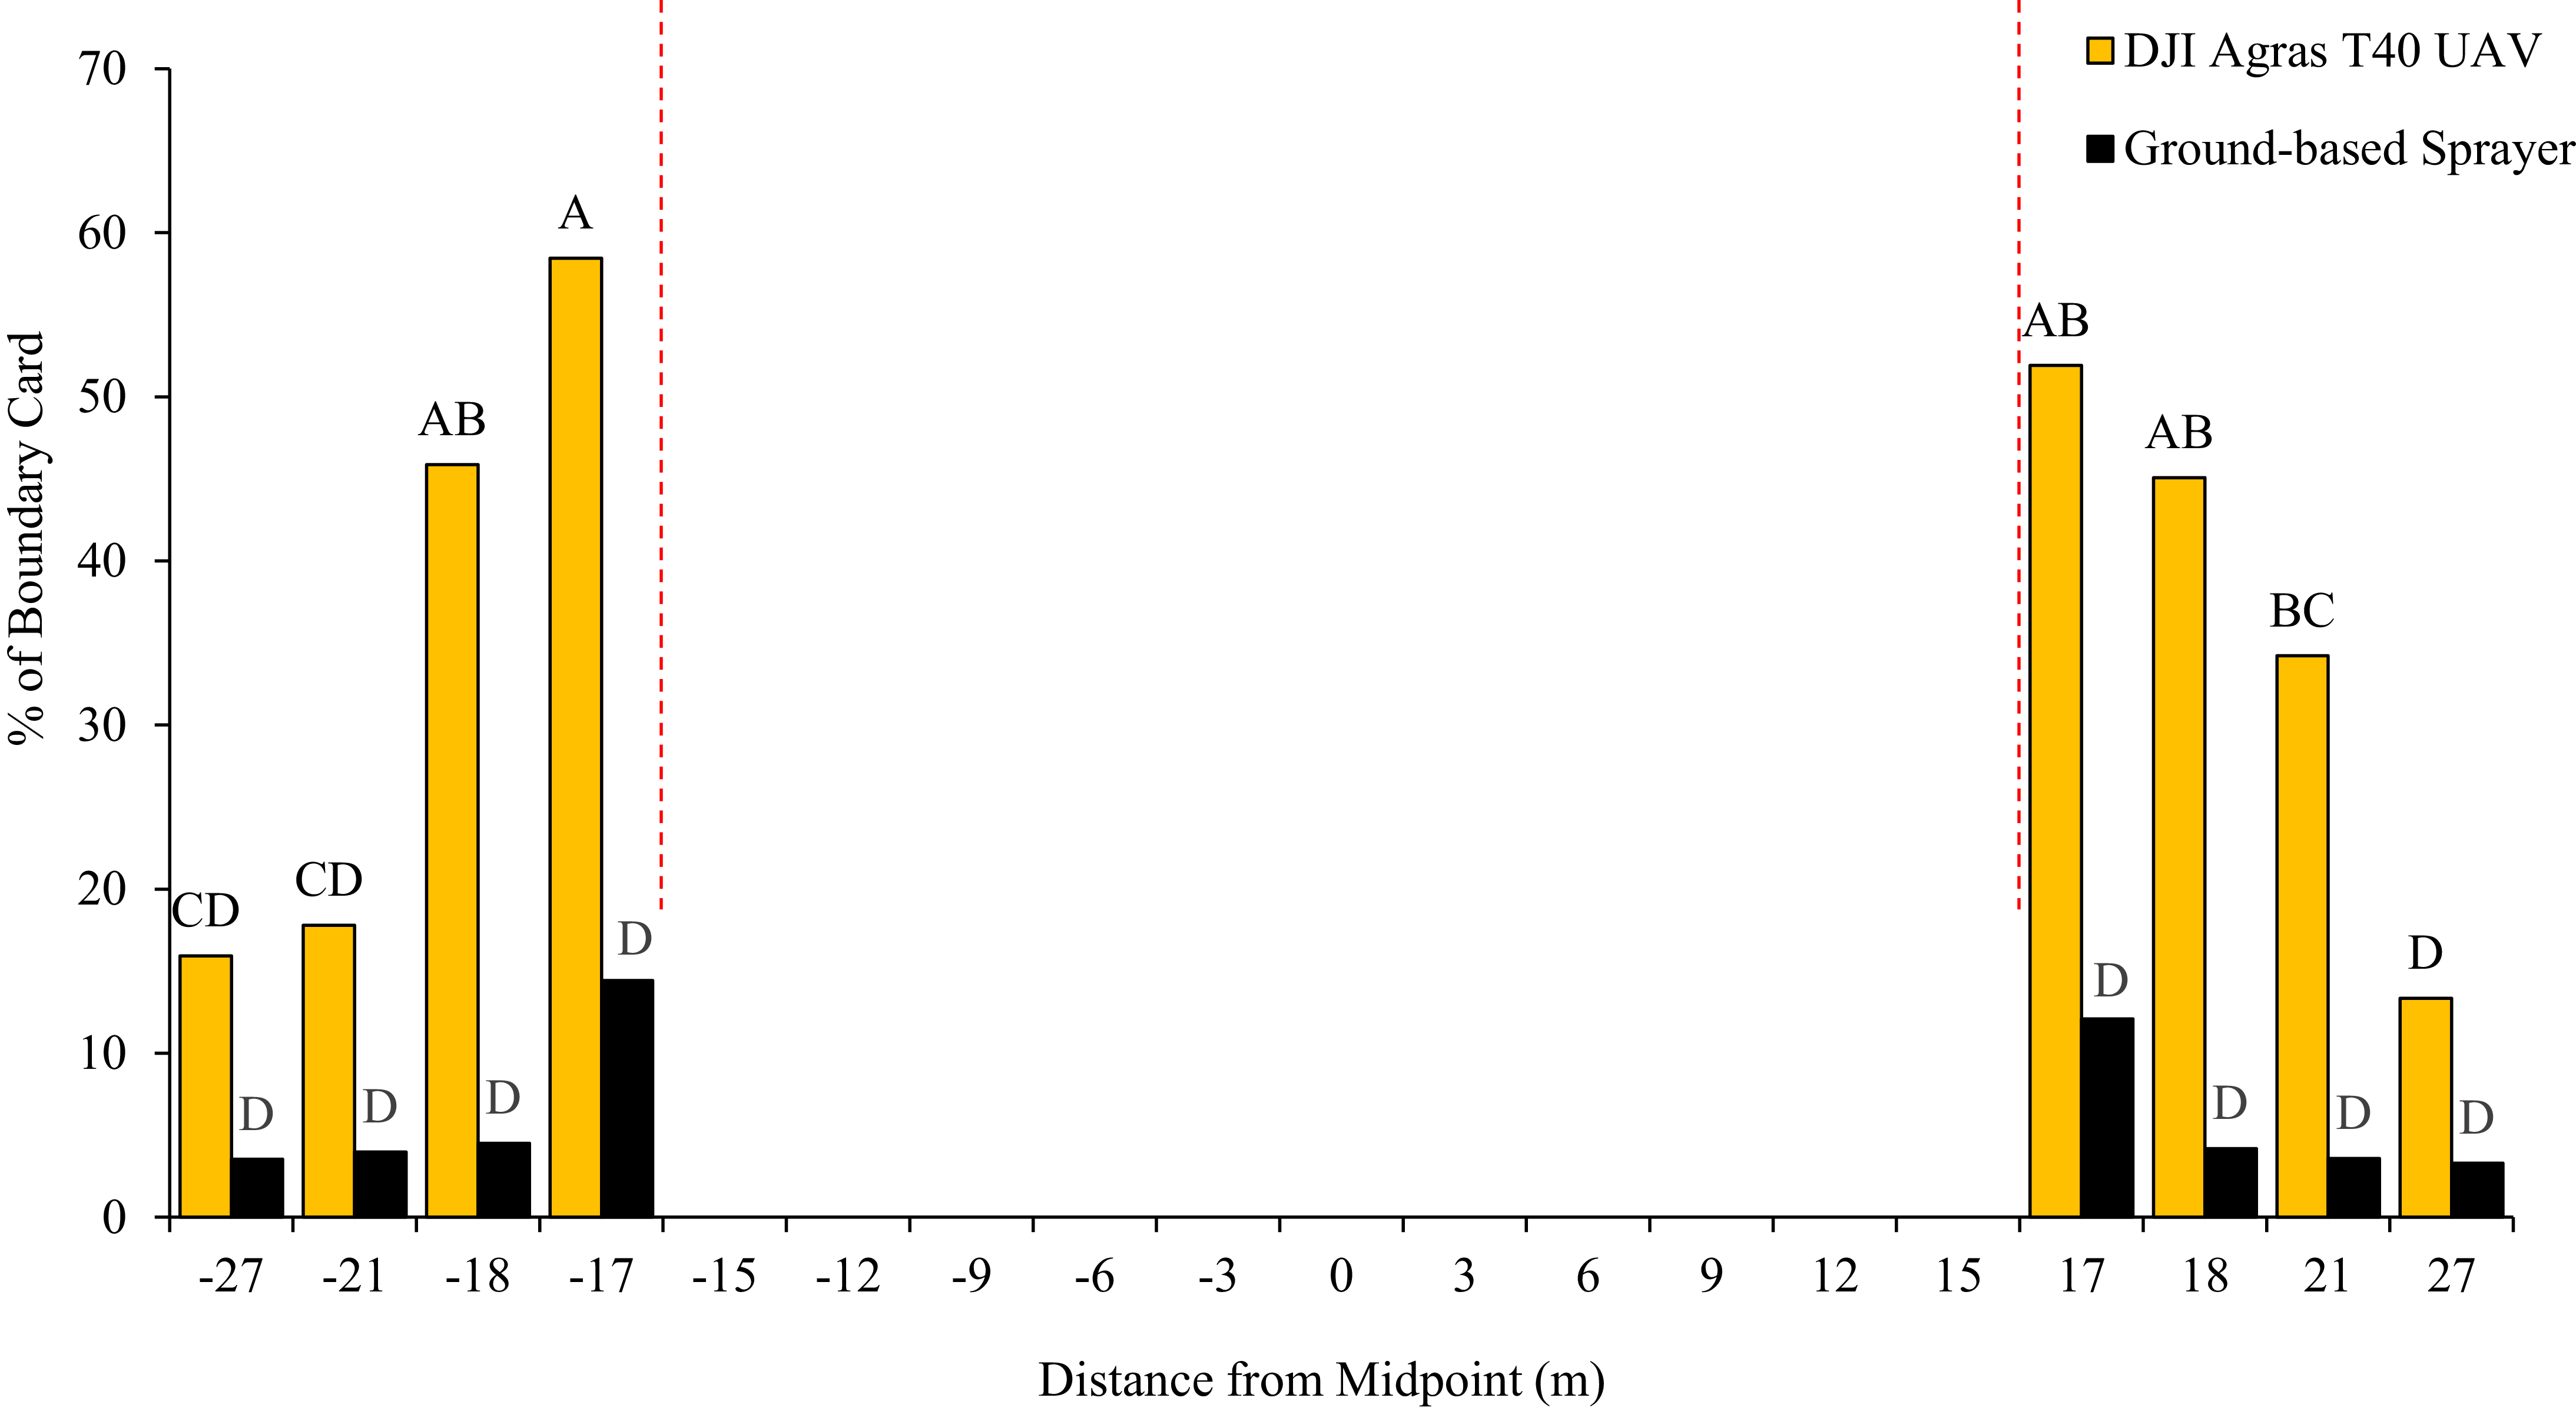
Although absolute spray coverage outside the plot did not demonstrate a statistical difference between application methods, normalized data indicated 30% to 44% greater proportional off-target movement from the UAV at the cards located at−17 m, −18 m, 17 m, 18 m, and 21 m (Figure 3). This result is consistent with those reported in previous studies demonstrating that higher spray heights and smaller droplet spectra associated with UAV applications increase drift potential (Grant et al. Reference Grant, Perine, Abi-Akar, Lane, Kent, Mohler, Scott and Ritter2022; Zhang et al. Reference Zhang, Hewitt, Chen, Li and Tang2023). For example, Zhang et al. (Reference Zhang, Hewitt, Chen, Li and Tang2023) indicated that low spray volumes typically lend themselves to small droplet formation, and small droplets are more prone to drift and that typical spray heights for ground-based sprayers are between 0.5 m and 1.25 m, whereas UAV spray heights are between 1.5 m and 3.5 m, giving the droplets more time to be influenced by wind before reaching the target area. Grant et al. (Reference Grant, Perine, Abi-Akar, Lane, Kent, Mohler, Scott and Ritter2022) also reported that increasing UAV spray height is more likely to result in spray drift, and Wang et al. (Reference Wang, Han, Li, Andaloro, Chen, Hoffman, Han, Chen and Lan2020) reported that a UAV equipped with atomizer nozzles under zero wind conditions still had drift beyond 4 m due to the effect of the rotor wash. This evidence supports the idea that, proportionally, the UAV had greater off-target movement at the low spray volume than the ground-based sprayers at a commercial standard spray volume even under moderate wind conditions. However, because off-target movement was evaluated using coverage rather than droplet size distribution, deposition, or biological injury, these results should be interpreted as relative indicators of spray displacement rather than definitive measures of drift.
Spray coverage distribution of off-target movement cards expressed as a percentage of each respective boundary card (−15 m or 15 m) with the DJI Agras T40 UAV and ground-based sprayers. Dashed red lines indicate the boundaries of the plot and the beginning of off-target movement cards. Bars followed by the same letter are not different according to the Fisher protected LSD test at P < 0.05. Results are combined across the Callaway, Cooper, and Boone County locations.

Overall, visual observations of soybean injury as a result of the herbicide application ranged from 8% to 16% at 7 d after application (DAA) but decreased to 4% to 6% by 21 DAA, and there were no differences across the swath width between the Agras T40 UAV and ground-based sprayers (P = 0.8). However, visual the rating of soybean injury was greater from the ground-based sprayer treatments at every evaluation timing compared with injury from the UAV.
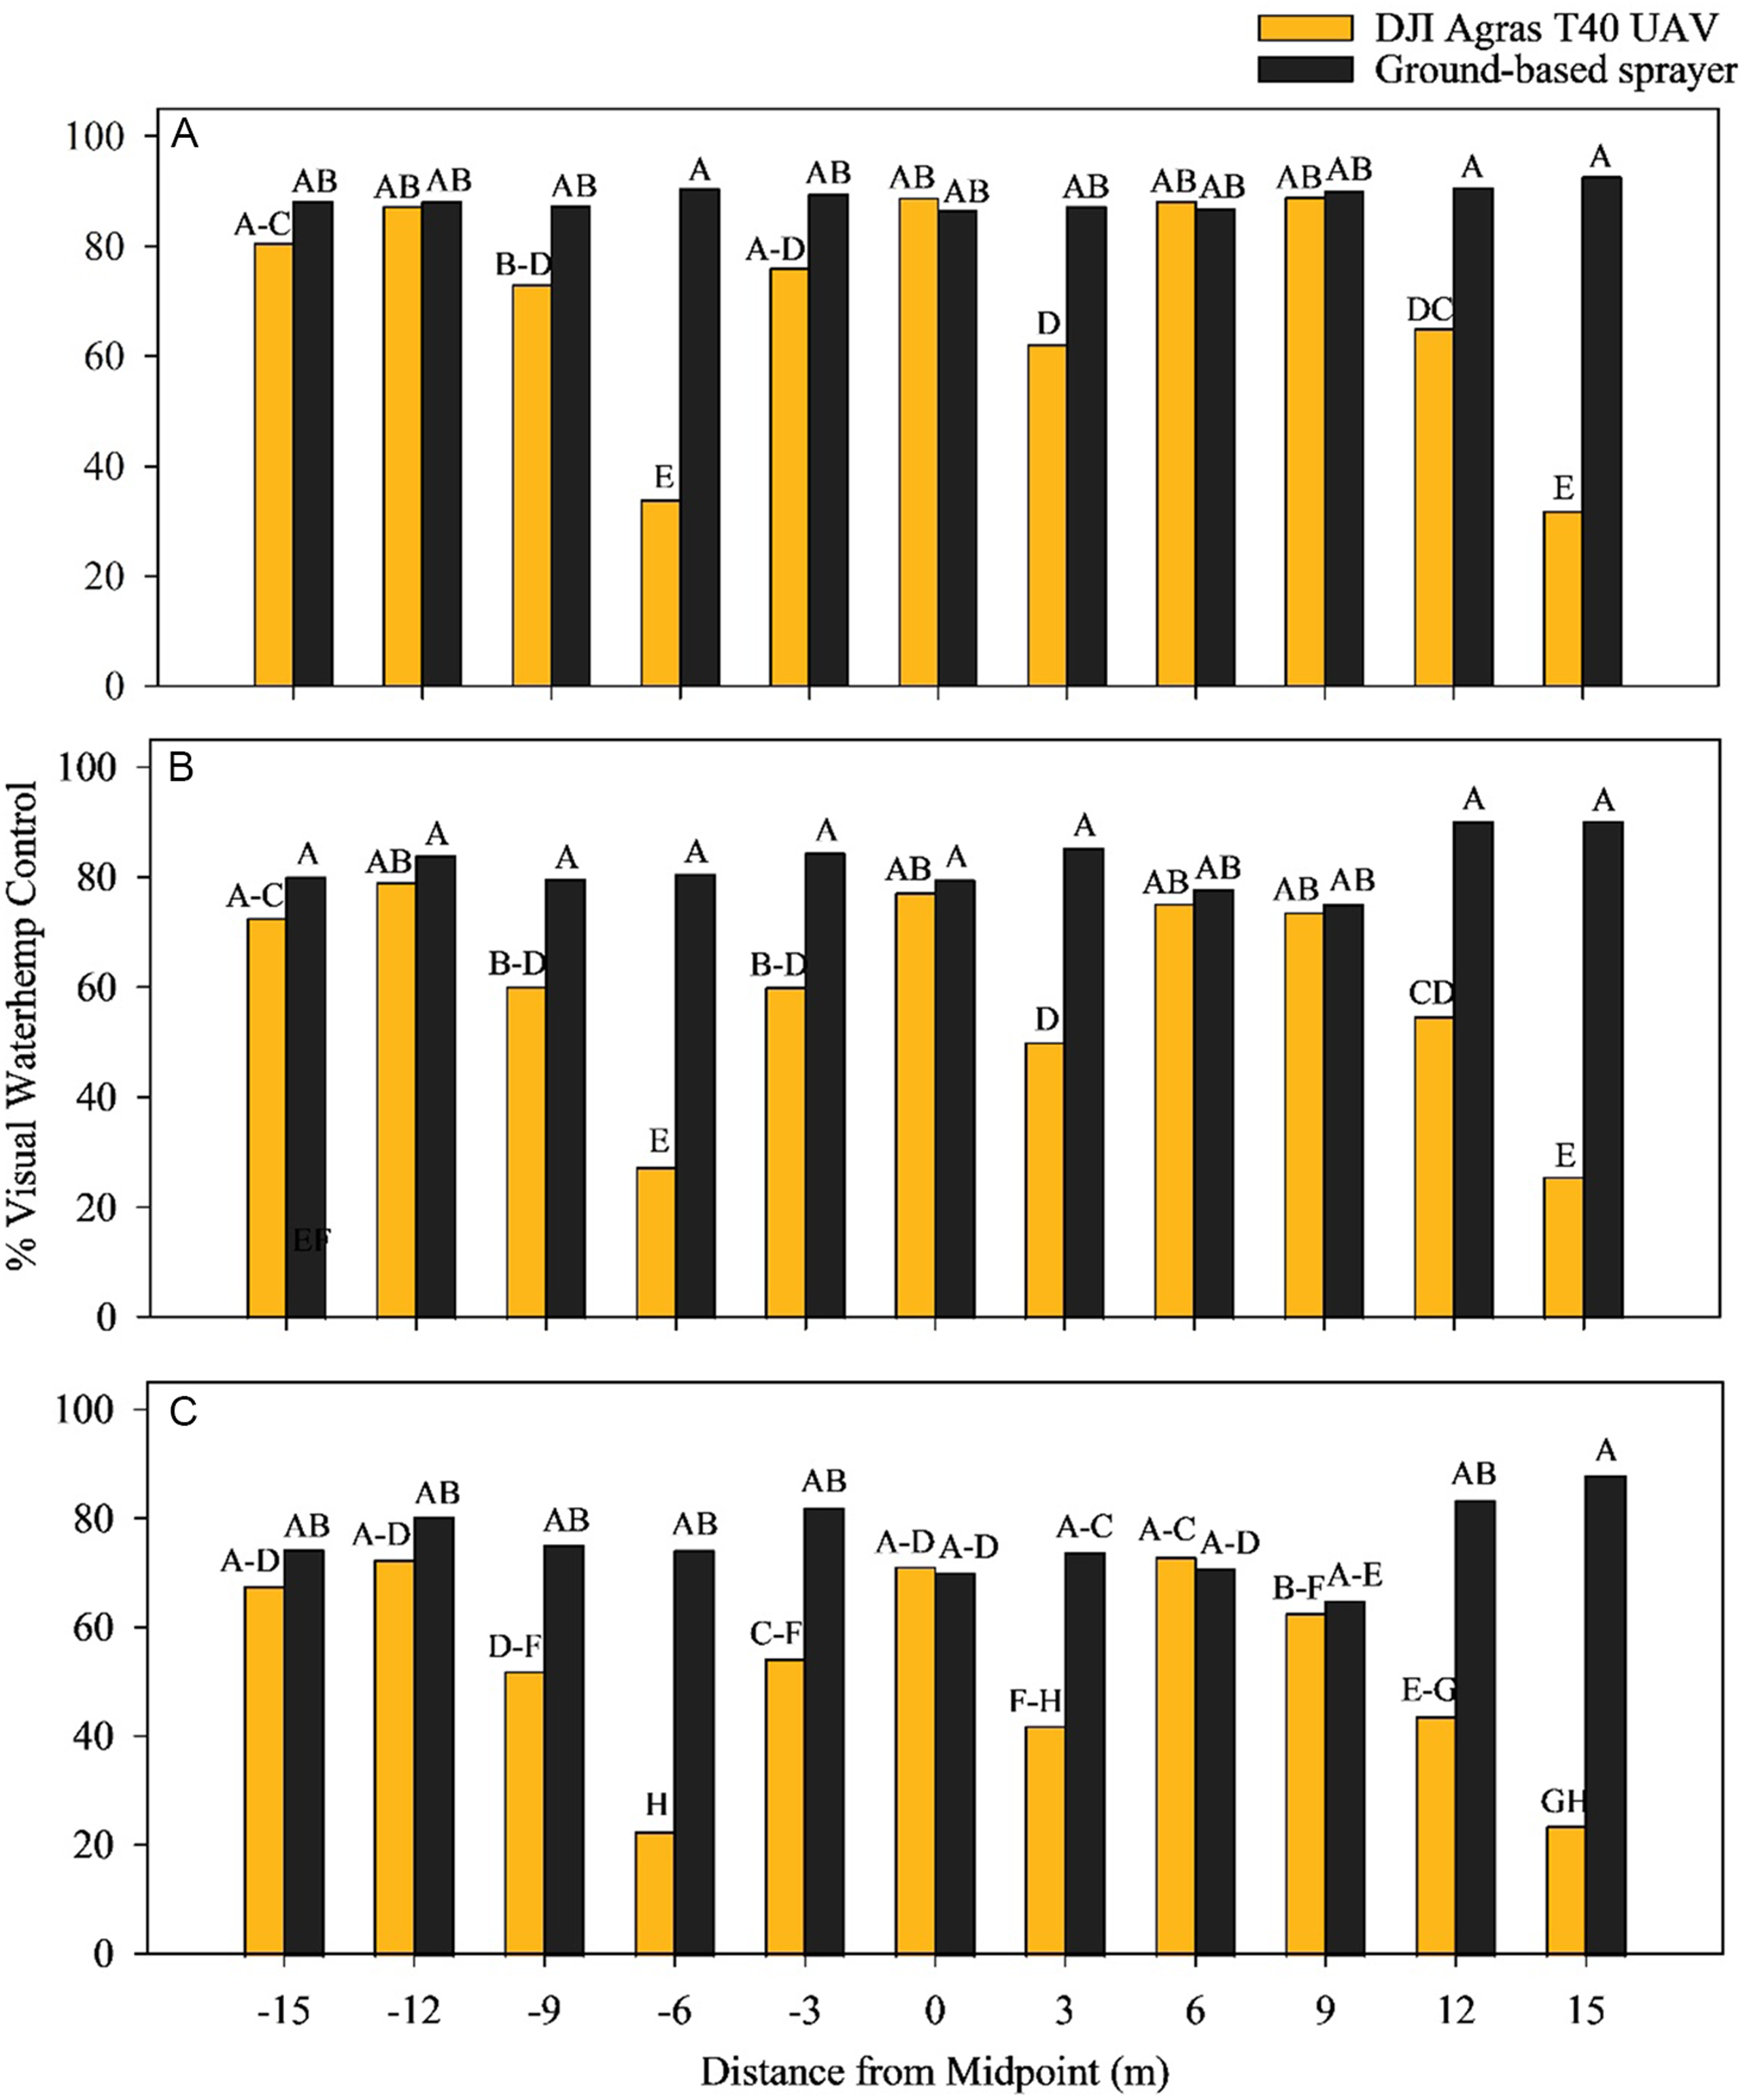
The waterhemp plants at the Cooper County site were extremely variable in height and much taller than desired at the time the retailer decided to apply the herbicide (Table 1), which resulted in decreased control with both application techniques. Visual observations of waterhemp control following application mirrored the results of WSP spray card coverage in that there was greater variability in waterhemp control along the plot width with the UAV than the ground-based sprayers (Figure 4). However, at five card locations (−15, −12, 0, 6, and 9) the UAV provided similar levels of waterhemp control as the ground-based sprayer at every evaluation. The reductions in waterhemp control 7 DAA, 14 DAA, and 21 DAA typically corresponded with the outer edges of the UAV plot width. This suggests that decreasing UAV swath to obtain proper overlap may result in similar levels of waterhemp control throughout the plot, and that UAVs may be able to achieve similar levels of weed control as ground-based sprayers even when using a lower spray volume. Cavalaris et al. (Reference Cavalaris, Karamoutis and Markinos2022) also reported that spray volume had no effect on the efficacy of cotton harvest aids.
Distribution of waterhemp control within the plot with the DJI Agras T40 UAV compared to the ground-based sprayer 7 d (A), 14 d (B), and 21 d (C) after application. Bars followed by the same letter are not different according to the Fisher protected LSD test at P < 0.05. Results are combined across the Cooper and Boone County locations.

Application Parameter Study
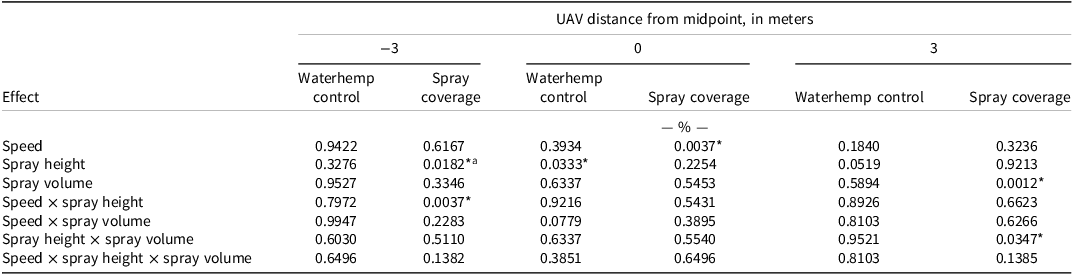
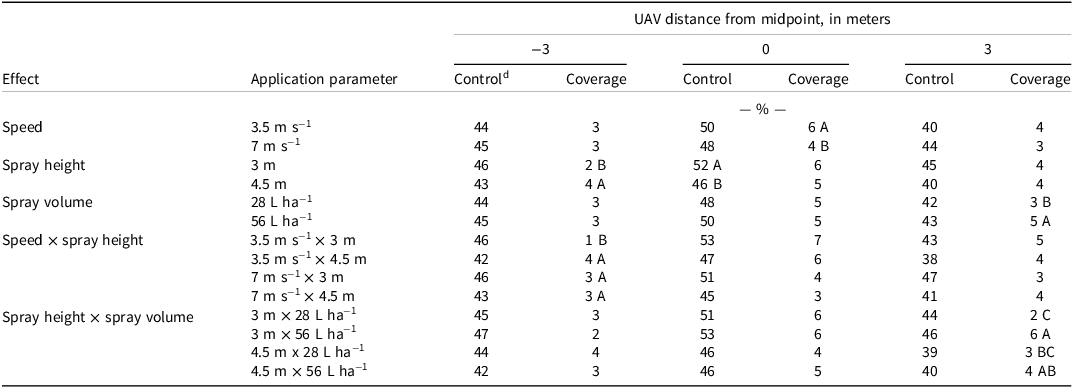
There was not a significant effect of site-year on spray coverage (P = 0.2); therefore, results were combined across site-years. Changes in application speed, spray height, or spray volume only rarely caused differences in glufosinate spray coverage, and only at certain locations along the plot width of the UAV (Table 4). Overall, glufosinate coverage as indicated on Kromekote spray cards ranged from 1% to 7% (Table 5). Woldt et al. (Reference Woldt, Martin, Latheef, Kruger, Wright, McMechan, Proctor and Jackson-Ziems2018) reported that 9.4% coverage was achieved at a spray volume of 34.4 L ha−1, while Byers et al. (Reference Byers, Virk, Rains and Li2024) found spray coverage ranged from 8.8% to 9.7% within the center section of the UAV, and 2.5% to 2.6% across the full swath at spray volumes of 19 to 37 L ha−1. A speed and spray height combination of 3.5 m s−1 and 3 m resulted in 2 to 3 fewer percentage points than all other speed and spray height combinations at the −3 m location. Additionally, an application speed of 3.5 m s−1 provided greater spray coverage than 7 m s−1 at the 0 m spray card location by 2 percentage points (Table 5). Teske et al. (Reference Teske, Wachspress and Thistle2018) reported that operating UAVs below a certain threshold application speed increased the downward force of the rotor wash, thereby improving droplet deposition below the UAV. Conversely, operating above the threshold speed decreased the downward force of the rotor wash and dispersed droplets outward in the air favoring off-target movement. In this study we discovered that a lower flight speed increased spray coverage below the UAV, whereas a higher flight speed had the opposite effect. These findings are consistent with those reported by Teske et al. (Reference Teske, Wachspress and Thistle2018) and Byers et al. (Reference Byers, Virk, Rains and Li2024), who found that an inverse relationship exists between speed and the spray coverage directly below the UAV. Lastly, Teske et al. (Reference Teske, Wachspress and Thistle2018) indicated that these threshold speeds differ by UAV models. This leads us to believe the characteristics of the UAV, not excluding flight parameters, may affect the critical threshold speed. At the 3 m card location there was a significant spray height by spray volume interaction; meanwhile, all other effects and interactions had no effect on spray coverage. A spray height by spray volume combination of 3 m and 56 L ha−1 provided superior spray coverage over both 28 L ha−1 combinations by 3 to 4 percentage points. Spray volumes of 56 L ha−1 performed similar regardless of spray height.
Summary of effects of spray coverage and visual estimates of percent of waterhemp control 14 d after application.

a Abbreviation: UAV, unmanned aerial vehicle.
b An asterisk (*) indicates significant differences at P ≤ 0.05.
Influence of UAV application parameters on spray coverage and waterhemp control 14 d after application.a–c

a Abbreviation: UAV, unmanned aerial vehicle.
b Means followed by the same letter within a column are not different, P £ 0.05.
c Means within the same column that are not followed by a letter are not significant.
d Control equals visual waterhemp control 14 d after application.
As with Kromekote spray card coverage, changes in application speed, spray height, or spray volume only rarely caused differences in waterhemp control when assessed at 14 DAA, and only at the 0 m location along the plot width of the UAV (Tables 4 and 5). There was a significant effect of spray height at the 0 m location, but all other effects and interactions did not influence waterhemp control (Table 4). At the 0 m card location, waterhemp control was greater with the 3-m spray height compared with the 4.5-m spray height by 6 percentage points (Table 5). A similar trend almost occurred at the 3 m location (Table 4). This suggests that at higher altitudes, such as 4.5 m, the UAV propellers may not provide sufficient downforce to disperse droplets from a contact herbicide like glufosinate. This could result in a lack of coverage and/or lower deposition of the herbicide into the weed/crop canopy. Zhang et al. (Reference Zhang, Song, Liang, Qin, Zhang, Wei, Li and Wu2020) reported that a spray height of 3 m provided optimum middle and lower canopy deposition in sugarcane (Saccharum officinarum L.), but that 4 m was optimal for droplet deposition uniformity at the upper canopy level.
Practical Implications
The application of herbicides to field crops requires that machines to be consistent, efficient, and have the necessary coverage to control weeds while mitigating off-target movement. In this study, ground-based sprayers provided greater and more uniform spray coverage and more consistent waterhemp control than UAV sprayers. Achieving comparable uniformity with the UAV would likely require narrower swath widths than those used in this study. Although proportional off-target movement was greater with the UAV, absolute coverage beyond the target area did not differ between application methods, indicating that these findings should be interpreted with caution. Maintaining lower spray heights and slower application speeds improved deposition and weed control with the UAV. Overall, these results demonstrate that UAVs can be used to effectively apply herbicides under optimized operating conditions, but they currently remain more sensitive to application parameter selection and even moderate wind speeds (0 to 3.3 m s−1) than ground-based sprayers.
Acknowledgments
We thank Del Knerr and Matheus Noguera for their technical support, and all fellow graduate students for assisting during the growing season.
Funding
This research was funded in part by a grant from the Missouri Soybean Merchandising Council.
Competing interests
The authors declare they have no competing interests.

 Open access