




I. INTRODUCTION
Concerns over the scarcity of fossil fuels and the simultaneous greenhouse effects summon renewable energy technologies from solar, wind as well as the advent of hybrid electric vehicles (HEVs)/electric vehicles (EVs) with low emissions. Reference Zhao, Ran, Liu and Shao1,Reference Jung, Myung, Yoon, Son, Oh, Amine, Scrosati and Sun2 However, due to the intermittent character of renewable, reliable electrical energy storage systems are required for adapting these technologies to the demand in electricity. Among the various realistic solutions, lithium-ion batteries (LIBs), which generally have high energy density and long cycle life, are particularly adapted for applications in HEVs/EVs where a long cruising range is needed after each recharge in a short time. Reference Bruce, Scrosati and Tarascon3,Reference Dunn, Kamath and Tarascon4 Carbon-based materials are commonly used as an anode for LIBs. Reference Kim, Seo, Kim, Kim and Kang5 But low theoretical capacity (372 mA h/g) is the major concern which puts sand on the wheel of its application in HEVs/EVs where a power source with high energy density and high power density is necessary. Reference Armand and Tarascon6,Reference Ji, Lin, Alcoutlabi and Zhang7 Thus state-of-the-art LIBs can be explored only when eximious alternative electrode materials with high capacity, super rate performance, and long cycle life is found.
Transition metal oxides (TMO, M x O y : M = Co, Fe, Ni, Cu, Mn, etc.) Reference Chen, Zhuo, Deng, Xu, Li and Wang8–Reference Liu, Xu, Ma, Feng, Qian and Xiong17 are considered as feasible anode alternatives due to the high-specific capacities induced by conversion reaction mechanism, which was first proposed and elucidated by Poizot et al. Reference Poizot, Laruelle, Grugeon, Dupont and Tarascon18 However, they have relatively poor electrical conductivity and their volume change a lot during the Li+ insertion and extraction. Reference Ma, Wang, He, Liao, Chen, Wang, Yuan and Ma19 Poor conductivity always leads to bad rate performance and low power density. Large volume change will induce pulverization which results in an insufficient lithium storage performance and a rapid capacity decay. Reference Poizot, Laruelle, Grugeon, Dupont and Tarascon18 The large voltage difference between charge and discharge also results in poor energy efficiency. Thus, fabrication of high-performance transition metal oxide electrode material with good cycling stability and rate performance remains a great challenge. In this paper, I will summarize the recent progress which has been made in my lab to strengthen the morphology stability and enhance the rate performance of LIBs with transition metal oxide anodes.
II. STABILIZING THE STRUCTURE WITH THE SOLID ELECTROLYTE INTERPHASE
It is well-accepted that the solid electrolyte interphase (SEI) will form on transition metal oxide or carbonaceous anodes during the first discharge process of LIB. Reference Winter20,Reference Wu, Chan, Choi, Ryu, Yao, Mcdowell, Lee, Jackson, Yang, Hu and Cui21 Although its composition and nature is still the subject of much controversy, it has strength to some extent to support the initial morphology contrary to the pulverization. Reference Verma, Maire and Novák22 Recently, ultrathin mesoporous NiCo2O4 nanosheets were directly grown on Ni foams in my lab to form an efficient and reversible anode for lithium-ion half-cell batteries. Reference Leng, Shao, Wei, Jiang, Lian, Wang and Jiang23 The morphology can be seen in Fig. 1. They are interconnected to build up a honeycomb-like architecture which offers a large electrolyte contact area and good structure integrity. The ultrathin thickness of the sheet is also beneficial for the fast Li ion reaction and diffusion in the electrode. The nanosheets in fact are monolayers of 10 nm NiCo2O4 nanoparticles, as proved by the TEM image shown in Fig. 2. Such structure suggests a weak strength of the sheet. But during the first discharging, the SEI film is formed on it. The SEI film combined with the honeycomb-like architecture endows the electrode a good cyclic stability. As shown in Fig. 3, after 50 cycles the initial honeycomb-like architecture is pretty reserved. Thus, the electrode made by such architecture has pretty well Li ion storage performance. The electrochemical investigation of the electrode is show in Fig. 4. For the CV curves of Fig. 4(a), the dominant cathodic peak locating at around 0.67 V for the first cathodic sweep shifts to 0.93 V with reduced intensity in the subsequent scans, which indicates the irreversible processes to form the SEI film during the first cycle. Reference Gao, Wu and Lou9 The subsequent cycles following the first cycle overlap very well. So the SEI is very stable, which guarantees a good reversibility of the electrochemical reaction. As shown in Fig. 4(b), the initial discharge and charge capacities of the electrode are 1738 and 1244 mA h/g, respectively. The large irreversible capacity loss in the first cycle should be associated with the SEI film formation. The NiCo2O4/Ni foam electrode has a much better cycle performance than the pasted NiCo2O4 powders electrode, as shown in Fig. 4(c). It exhibits remarkable capacity retention (1170.1 mA h/g in the 50th cycle) upon prolonged cycling with a high coulombic efficiency of nearly 99%, which is even higher than the theoretical capacity of NiCo2O4 (980 mA h/g). As shown in Fig. 4(d), the NiCo2O4/Ni foam electrode delivers average discharge capacities of 1343.1, 1241.5, 974.4, 780.2, and 398.2 mA h/g at current densities of 0.2, 0.5, 1.0, 2.0, and 4.0C, respectively. Importantly, a high capacity of 1101.2 mA h/g can be recovered when the current density is reduced back to 0.2C.
(a) Pictures of the Ni foam before and after the annealing of NiCo2O4/Ni, and the inset is the photograph of a flexible NiCo2O4/Ni before punching; (b) SEM image of the Ni foam before the annealing of NiCo2O4/Ni; (c) low-magnification SEM image of NiCo2O4/Ni after annealing; (d) high-magnification SEM image of NiCo2O4/Ni after annealing and the inset is partial enlarged detail.

(a and b) TEM image; (c) HRTEM image; (d) SAED pattern of the NiCo2O4 nanosheet scratched from Ni foam.

SEM images of the NiCo2O4/Ni foam electrode after 50 cycles.

(a) CV curves of the NiCo2O4/Ni electrode at a scan speed of 0.2 mV/s in the voltage window of 0.01–3 V; (b) discharge–charge curves of the NiCo2O4/Ni electrode at a current density of 0.2C; (c) cycle performance of NiCo2O4/Ni foam and pasted NiCo2O4 electrode at 0.2C, and the coulombic efficiency of NiCo2O4/Ni foam; (d) rate capabilities of the NiCo2O4/Ni foam and pasted NiCo2O4 electrode cycled at different current rates from 0.2 to 4C. (1C = 1 A/g).

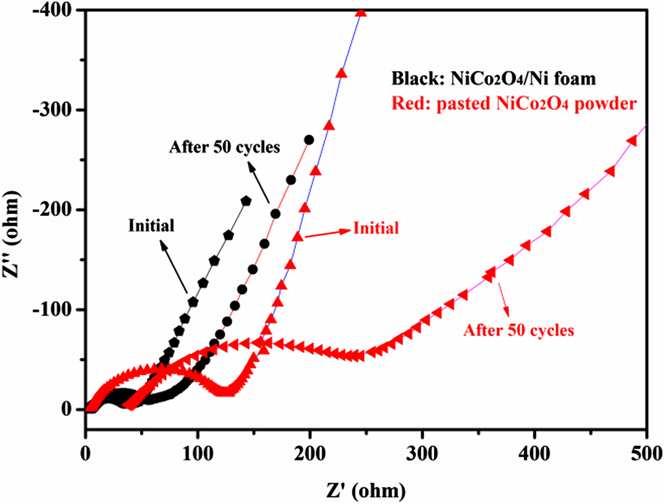
The enhanced charge transfer efficiency and improved electrical conductivity of the NiCo2O4 electrode can be investigated by the comparison of the Nyquist plots as measured by electrochemical impedance spectroscopy (EIS), which shows the usual feature of energy device: an inclined straight line in the low-frequency region and a semicircle in the high-frequency region (Fig. 5). Apparently, the initial diameter of the semicircle for NiCo2O4/Ni foam electrode is much smaller than the pasted electrode. After 50 cycles, both semicircles have enlarged diameters. But the semicircle diameter for the pasted electrode enlarged even more. Thus the unique structure of NiCo2O4/Ni endows the electrode much lower contact and charge-transfer impedances. As long as the unique structure is reserved, the good electrochemical performance can be retained. The morphology of the NiCo2O4/Ni electrode after 50 cycles was observed by SEM, and the image is shown in Fig. 3. The honeycomb-like structure is perfectly reserved, although the sheet thickness changed to around 200 nm. The increase of the sheet thickness should be relative to the covering of thick SEI film forming during the first discharge process and the film is conducive to maintain structural integrity. Reference Wang, Qiao, Sun, Li, Hu, Zhang and He24 The good electrochemical performance of the NiCo2O4/Ni electrode should be related to its unique features. First, the nanosheets were directly grown on the current collector, which guarantees a good mechanical adhesion. Thus, the electrode doesn't suffer a fast capacity fading as abscission of the electrochemical active materials. Meanwhile the close contact provides a fast pathway for charge-transfer, which induces low contact and charge-transfer impedances. Second, the honeycomb-like architecture constructed by ultrathin mesoporous nanosheets provides huge pathway for electrolyte and Li+ diffusion and markedly increases the amount of contact areas between active materials and electrolyte. It can make Li+ diffusion to reaction site much easier and greatly reduce the reaction and Li+ diffusion impedance. Third, the open 3D honeycomb-like architecture provides sufficient space to buffer the volume changes during the charge/discharge process. Reference Wang, Qiao, Sun, Li, Hu, Zhang and He24 In this architecture, the nanosheets will support each other, which should enhance the integrity of the structure. On the contrary, the pasted electrode cannot ensure the direct contact between the active material and current collector or sustain the quality of the adhesion because the conductive additive and binder would be subjected to periodical variations in the volume and strain of the active material. Reference Qu, Hu, Li, Wang, Chen and Wang25 The random and unordered stacking of the nanosheets could block the Li+ diffusion pathways. The presence of binder can also impede electron conduction. Reference Chen, Zhu, Qu, Lu and Xu26
Nyquist plots of NiCo2O4/Ni foam electrode and pasted NiCo2O4 powder electrode for the 1st and 50th cycles.
III. STABILIZING TMO WITH REDUCED GRAPHENE OXIDE
Graphene, as a monolayer of carbon atoms arranged in a honeycombed network of six-membered rings, has triggered a gold rush since its discovery. Its good mechanical properties, high theoretical surface area of 2630 m2/g, good electronic conductivity suggest it would have a bright prospect in LIBs. What is more, it has high theoretical lithium storage of 744 mA h/g. Reference Peng, Chen, Qin, Yang, Li, Zuo, Liu and Yang27,Reference Li, Zang, Li, Li, Li, Sun, Lee, Zhang, Huang, Wang, Wu, Kang and Zhu28 Thus, graphene can support another advanced anode materials meanwhile it also can act as a pathway for the flow of electrons from the active material to current collector. Reference Luo, Wang, Liang, Ning, Li and Zhi29–Reference Nguyen, Kumar, Gaubicher, Duclairoir, Brousse, Crosnier, Dubois, Bidan, Guyomard and Lestriez31 Up to now, many nanoparticles (NPs) M x O y /graphene composites have been investigated as LIB anode materials, such as SnO2/graphene, Reference Paek, Yoo and Honma32–Reference Gu, Mai, Zhou and Tu34 Mn3O4/graphene, Reference Zhang, Zhao and Lian35 CuO/graphene, Reference Zhang, Zhou, Song, Chen, Fedoseeva, Okotrub and Bulusheva36 and Fe2O3/graphene. Reference Zhu, Song, Ma and Ning37 They usually exhibit much better electrochemical performance than their bare counterparts. However, the NPs are still prone to aggregate during cycling because of nonintimate/tight contact between the NPs and graphene sheets (GS) layers. Reference Chen, Zhuo, Deng, Xu, Li and Wang8,Reference Zhou, Wang, Yin, Li, Li and Cheng38 On the other hand, the overlapping of GS during electrode preparation and electrochemical test is also a critical problem, which may result in inadequate adhibition of graphene. Therefore, to adequately utilize the unique properties of individual GS and fully harness the synergistic effect between GS and M x O y , the main challenges in the synthesis of graphene/M x O y composites lie in how to effectively enhance the contact between GS and M x O y and inhibit too much overlapping and agglomeration of GS.
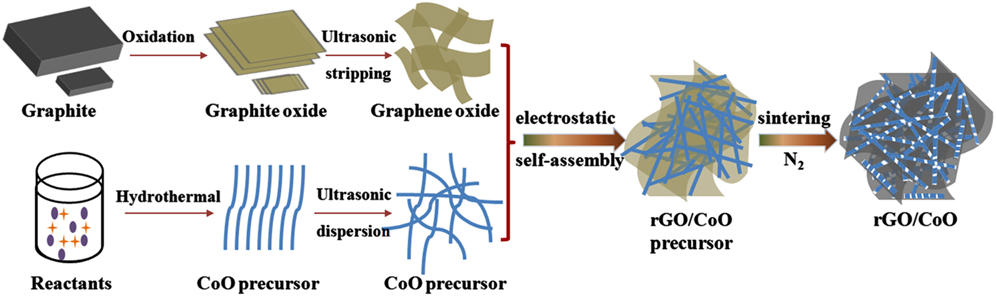
Recently, a rGO/CoO composite anode with high specific capacity, good cycling stability and excellent rate capability was synthesized in my lab. Reference Leng, Ding, Hu, Wei, Jiang, Lian, Wang, Jiang and Liu39 The preparing procedure of rGO/CoO nanowires mutually-supporting porous structure is illustrated in Fig. 6. Uniform and well-crystalline Co(CO3)0.5(OH)·0.11H2O nanowires, served as CoO precursor, were firstly fabricated via a glycol-assisted hydrothermal method. Then the positively charged nanowires were attached to negatively charged GO sheets because of electrostatic interaction. As the composites were sintered in nitrogen atmosphere, the CoO precursor and GO nanosheets were thermally in situ decomposed to CoO nanowire and rGO. Eventually, a unique self-assembled rGO/CoO nanowires mutually-supporting porous structure was successfully prepared. The in situ direct generation of rGO/CoO composites by one-step thermal treatment ensures a strong interaction and better structural stability. The morphology of the CoO precursor and its evolution after annealing were detected by SEM and the images are shown in Fig. 7(a) and 7(b). The pristine precursor is nanowire with a diameter of 15–25 nm and length of several micrometers. The wire surface is smooth and flat. After annealing, the wire changed to a dot-line, a sequence of NPs with a diameter of about 10–20 nm. The effect of rGO on the morphology evolution of the wire was also investigated by SEM. The images are shown in Figs. 6(c) and 6(d) which can be compared to Figs. 7(a) and 7(b). The adding of GO doesn't affect the morphology of the wire, as shown in Fig. 6(c). Co(CO3)0.5(OH)·0.11H2O nanowires are uniformly adsorbed on GO nanosheets, and both of them supported each other. Thus a 3D loose network system with lots of voids is formed by them. As shown in Fig. 7(d), the annealing has very less effect on the morphology of the system. The wire is still long and smooth and the sheet is still large and flat. It doesn't show a similar view like the image in Fig. 7(b). A similar phenomenon was also observed by TEM. After annealing, the wire changed to a sequence of NPs of about 10–20 nm as shown in Fig. 8(a). And the wire retained its morphology by the help of rGO after annealing as proved by the image of Fig. 8(b). In fact, the line still consisted of similar size nanocrystals as proved by the image of Fig. 8(c). It seems like a line because these nanocrystals link with each other firmly. The grain boundary between vicinal crystals can be clearly detected by the HRTEM image shown in Fig. 8(d). The morphology characterization by SEM and TEM revealed that the CoO wires were firmly anchored on the rGO surface. So the integrity of the wires was retained even after annealing. Meanwhile the existence of the wires between rGO sheets is also effective to inhibit the restacking of rGO sheets.
Schematic illustration of the procedures for preparation of rGO/CoO nanowires mutually-supporting porous structure.
FESEM images of (a) CoO precursor nanowires; (b) CoO after annealing; (c) GO/CoO precursor by electrostatic interaction; (d) rGO/CoO after annealing.

(a) TEM image of the pure CoO; (b and c) TEM and (d) HRTEM images of the rGO/CoO. The distance of two interference fringes was measured to be 0.24 and 0.21 nm, respectively, which is equal to the interplanar spacing of (111) and (200) plane of cubic CoO according to JCPDS 43-1004 XRD card.

The cycle performance of the rGO/CoO electrode was tested at a current density of 0.1 A/g, and it was compared with the pure CoO electrode. The results are shown in Fig. 9(a). The capacity of the rGO/CoO is superior to the CoO at the initial cycle. The reversible capacities are gradually increasing in the first dozens of cycles, which may be attributed to the formation of a polymeric surface film attached to the active material. Reference Peng, Chen, Qin, Yang, Li, Zuo, Liu and Yang27 It gets a maximum value of 1027 mA h/g at the 36th cycle, which is about 99.5% of the initial discharge capacity, and it can still maintain 994 mA h/g even after 100 cycles. The value is even higher than the theoretical value of rGO/CoO composite (C theoretical = C CoO × mass percentage of CoO + C graphene × mass percentage of graphene = 716 × 92% + 744 × 8% = 718.2 mA h/g). Such high specific capacity of rGO/CoO should be attributed to the following points: firstly, the rGO sheets have numerous significant disorder and defects, which can also contribute to the lithium storage capacity, except for the inherent capacity (formation of intercalation compounds Li3C). Reference Peng, Chen, Qin, Yang, Li, Zuo, Liu and Yang27,Reference Leng, Shao, Wei, Jiang, Lian, Wang and Jiang40 Secondly, the reversible decomposition of the electrolyte with the formation of SEI and extra lithium-ion adsorption/desorption on the SEI during cycling may also lead to the high experimental lithium storage capacity. Reference Poizot, Laruelle, Grugeon, Dupont and Tarascon18,Reference Nam, Kim, Yoo, Chiang, Meethong, Hammond, Chiang and Belcher41 For the pure CoO electrode, the initial capacity only is maintained for 18 cycles. After that, it declines sharply from 708 to 506 mA h/g.
(a) Charge/discharge capacities of the CoO and rGO/CoO electrode at a current density of 0.1C; (b) rate capabilities and cycle performance of the CoO and rGO/CoO electrode cycled at different current rates from 0.1 to 10C; (c) cycle performance and coulombic efficiency for rGO/CoO electrode at higher current density of 1C (for the first 10 cycles at 0.1C, 1C = 1 A/g).

The rGO/CoO electrode also exhibits excellent rate performance. As shown in Fig. 9(b), the rate performance was compared with the CoO electrode. The electrode delivers average reversible capacities of 960, 846, 790, 718, 646, 577, 504, 388, and 262 mA h/g for 0.1, 0.2, 0.4, 0.8, 1.6, 3.2, 5.0, 7.0, and 10C, respectively. It means 28% capacity is retained even after the current density enlarged 100 times from 0.1C to 10C. As the current rate returns to 0.1C, the initial capacity is reserved. The curve even persist the increasing trend during 72–82 cycles and 102–108 cycles, just same like the trend in first 11 cycles. Finally, the capacity rises above 1046 mA h/g at the 112th cycle, which is very close to the initial discharge capacity (1068 mA h/g). However, as the current density increase from 0.1 to 5C, the specific capacity of the CoO electrode decreases sharply to only 7.6% of its initial capacity. As the current density increases even higher up to 10C, the specific capacity is close to zero. When the current density returns to 0.1C, the electrode can't regain its initial capacity yet. Only 60% capacity is recovered. In fact, the cycle performance of the rGO/CoO electrode is much better than 100 cycles. As shown in Fig. 9(c), the electrode can maintain a reversible capacity of 790 mA h/g at a current rate of 1C to the 130th cycle. Then it suffers a sharp fading to 530 mA h/g from the 130th cycle to the 180th cycle. After that, the capacity levels off above 610 mA h/g until the 620th cycle with a coulombic efficiency of around 98.3–100.4%. At a higher current density of 3C, the trend is similar to 1C, but the specific capacity still can maintain 520 mA h/g even after 750 cycles. The reasons for the obvious capacity decreases at high rates maybe as follows Reference Song, Ru, Mo, Guo, Hu and An42–Reference Aifantis, Huang, Hackney, Sarakonsri and Yu44 : (i) the continuous reduction of active materials due to the insetting of metal Co in Li2O matrix partially, especially it occurs at high rates; (ii) the brush-fire aggregation of the active materials to larger clusters cannot be completely avoided; (iii) the structure strain of the active materials can't be totally eliminated during cycling even though the voids and rGO sheets could accommodate the volume change of the active species. These measurements confirm the merits of the rGO/CoO electrode.
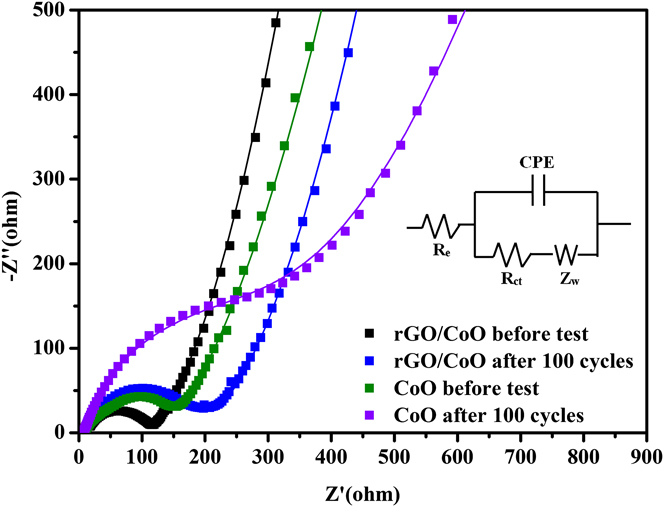
To clarify the difference of the electrochemical performances, EIS measurements are also carried out at frequencies from 100 kHz to 0.01 Hz on both electrodes before test and after 100 cycles at 0.1C to uncover the electrode kinetics evolution and its relationship to electrochemical performance (Fig. 10). The Nyquist plots could be well fit by using a commonly adopted equivalent circuit (the inset of Fig. 10). Reference Rahman, Wang, Hassan, Wexler and Liu45–Reference Zhang, Zhang, Li, Kang, Li and Wang47 In the equivalent circuit, R e is the electrolyte resistance; R ct is the charge-transfer resistance; Z w is the Warburg impedance related to the diffusion of Li ions into the bulk electrodes, and CPE is the constant phase-angle element, involving double layer capacitance. Whether the EIS was tested initially or after 100 cycles, the charge-transfer resistance (R ct) for the rGO/CoO composite is much smaller than the CoO electrode. This indicates that the rGO/CoO composite electrode possess lower charge-transfer impedances, which can lead to rapid electron transport during lithiation/delithiation process and thus result in significant improvement on the rate performance. The tail for the rGO/CoO electrode at low frequency has higher slope than the CoO electrode, which indicates that the rGO/CoO electrode possesses lower lithium diffusion impedance. Reference Qin, He, Zhao, Wang, Shi, Liu and Li48 The impedances both increased after 100 cycles, which may be attributed to the formation of SEI film. Reference Hu, Zhong, Zheng, Huang, Zhang and Chen49–Reference Mondal, Su, Chen, Xie and Wang51 But such increase in impedance does not lead the decline of capacity.
Nyquist plots (solid dots) for the cells made of CoO and rGO/CoO electrodes and the fit curves (solid lines) using the equivalent circuit shown in the inset.
The excellent electrochemical performance of the rGO/CoO anode should be ascribed to the unique structure it has. Reference Li, Li, Li, Meng, Yu and Sun52–Reference Li, Meng, Liu, Geng, Zhang, Banis, Li, Yang, Li, Sun, Cai and Verbrugge54 In this experiment, the attachment was completed before the annealing which induce the conversion of CoO precursor nanowires and GO sheets to rGO. The procedure is obviously effective to enhance the adhesion force between CoO nanowire and rGO. The CoO nanowires in fact are tightly anchored on the rGO sheets, so the integrity of the nanowires is kept. The rGO/CoO electrode can possess an outstanding electronic conductivity to rGO benefiting from the good adhesion. And rGO sheets are able to act as an expressway for charge transfer. The conductivity of the electrode is improved. Secondly, CoO nanowires are firmly anchored on rGO sheets surface. The CoO NPs which constitute the nanowire have little chance to shed and aggregate. Meanwhile the rGO which is separated by the CoO nanowires also have little chance to restack. Thus, the voids between the network of the CoO wires and rGO can be reserved. The voids and the interstices in the wire formed during gas releasing are essential for high performance transition metal oxide electrode for they supply uniform interspaces to accommodate the large volume change the transition metal oxide electrode suffers during lithiation/delithiation. The cycle performance of the electrode can be improved. Finally, the voids and interstices, together with rGO sheets, can also supply a large interface and pathway for Li+ reaction and diffusion. The nanowires, NPs indeed, with small diameter heavily shorten the hard pathway for Li+ diffusion inside transition metal oxide. Li+ diffusion rate in the cell assembled by the rGO/CoO electrode is improved, which induce the excellent rate performance.
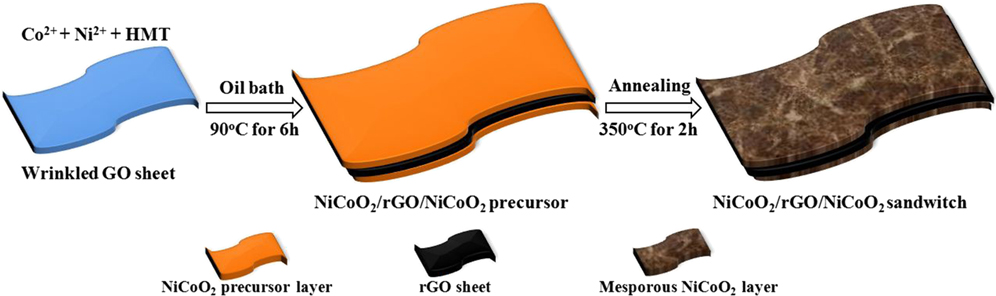
In another way, rGO sheets can also be encapsulated by TMO materials to form advanced LIB anodic materials. A facile and scalable strategy is proposed in my recent work for synthesis of a unique porous architecture built by ultrathin wrinkled NiCoO2/rGO/NiCoO2 sandwich nanosheets. Ultra-hydrophilic graphene oxide (GO) sheets are dispersed into Ni2+ and Co2+ solution as template for NiCoO2 precipitation. GO surface has ample oxygenic functional groups, some of which are negative polar. Reference Leng, Ding, Hu, Wei, Jiang, Lian, Wang, Jiang and Liu39,Reference Sun, Hu, Luo and Huang55 They can absorb and anchor positive ion such as Ni2+ and Co2+ on both sides of GO sheets. Reference Zhang, Yan, Tang, Li, Wang and Cao16,Reference Gao, Wu and Lou56 Ni2+ and Co2+ co-precipitate as NiCoO2 precursor layers on GO sheet, that is simultaneously chemically converted to reduced GO (rGO) by HCHO, as enough NH3 and HCHO are formed by hydrolyzing hexamethylenetetramine. Then NiCoO2/rGO/NiCoO2 sandwich nanosheets can be obtained by annealing. The sandwich sheets are as ultrathin as GO, thus they are random wrinkled. As these random wrinkled sheets stack together during drying, they mutually brace each other to form a unique porous architecture. This architecture owns sufficient specific surface area to facilitate the interaction of the active materials with electrolyte. Reference Li, Xiong, Liu, Ju and Qian57 In the architecture, the poor conductivity of NiCoO2 is heavily improved by high quality rGO, meanwhile the perfect flexibility of rGO can also guarantee the stability of the architecture. The electrochemical tests on the NiCoO2/rGO/NiCoO2 composite validate the architecture owns big advantage as electrode materials in SCs and LIBs.
The synthetic process of NiCoO2/rGO/NiCoO2 sandwich nanosheet is schematically illustrated in Fig. 11. Reference Leng, Shao, Wu, Wei, Jiang, Wang, Jiang and Lian58 Firstly, GO sheets are dispersed into de-ionized water, and then Ni2+, Co2+ and HMT are added in the solution serially. The metal cations (Ni2+ and Co2+) could be strongly absorbed by the polar oxygen-containing functional groups, such as hydroxyl and carboxyl, on both sides of GO sheets. Reference Chen and Wang59 As the solution is heated to 90 °C, the HMT starts to hydrolyze into HCHO and NH3. The former, as a strong reducing agent, has ability to reduce GO into graphene, and the latter can cause the increase of the solution pH value, and the precipitation of the NiCoO2 precursor. Reference Liang, Ma, Iyi, Ebina, Takada and Sasaki60 During the reaction, NiCoO2 precursors prefer to nucleate on the surface of GO sheets because of the coordination effect between metal cations and oxygen-containing functional groups of GO. Reference Gao, Wu and Lou56 Simultaneously, GO sheets are chemically reduced via losing oxygen-containing surface groups because of the presence of strong reducing agent (HCHO). As a consequence, ultrathin NiCoO2 precursor layers are generated on both sides of rGO sheets (designed as NiCoO2/rGO/NiCoO2 precursor). Finally, the NiCoO2/rGO/NiCoO2 sandwich nanosheets can be obtained by annealing treatment in N2. The whole formation reactions of NiCoO2 could be described by the following steps:
 $${\left( {{\rm{C}}{{\rm{H}}_2}} \right)_6}{{\rm{N}}_4} + 6{{\rm{H}}_2}{\rm{O}} \to 6{\rm{HCHO}} + 4{\rm{N}}{{\rm{H}}_3}\quad ,$$
 $${{\rm{H}}_2}{\rm{O}} + {\rm{N}}{{\rm{H}}_3} \to \mathop {{\rm{N}}{{\rm{H}}_4}}\nolimits^ + + \;{\rm{O}}{{\rm{H}}^ - }\quad ,$$
 $${\rm{C}}{{\rm{o}}^{{\rm{2 + }}}} + {\rm{N}}{{\rm{i}}^{{\rm{2 + }}}} + {\rm{4O}}{{\rm{H}}^ - } \to {\rm{Co}}{\left( {{\rm{OH}}} \right)_{\rm{2}}} + {\rm{Ni}}{\left( {{\rm{OH}}} \right)_{\rm{2}}}\quad ,$$
 $${\rm{Co}}{\left( {{\rm{OH}}} \right)_{\rm{2}}} + {\rm{Ni}}{\left( {{\rm{OH}}} \right)_{\rm{2}}} \to {\rm{NiCo}}{{\rm{O}}_{\rm{2}}}{\rm{ \;+\; 2}}{{\rm{H}}_{\rm{2}}}{\rm{O}}\quad {\rm{.}}$$
Schematic illustration of the synthesis of the wrinkled ultrathin NiCoO2/rGO/NiCoO2 sandwich nanosheets.
The structure and morphology of the as-prepared samples were characterized by FESEM and TEM. Figures 12(a) and 12(b) show the FESEM and TEM images of the pure NiCoO2 sheets. The NiCoO2 sheets are ultrathin, leading to the faint mass-density contrast in TEM image, and the thickness determined from the FESEM image is about 10 nm. The selected-area electron diffraction (SAED) pattern [the inset of Fig. 12(b)] shows well-defined diffraction rings, indicating the crystalline nature of the cubic phase. Although the sheets are crystalline, as validated by the XRD result and SAED pattern, they still have lots of random wrinkles, as shown in the FESEM and TEM images, because of ultrathin thickness. As the randomly wrinkled sheets were assembled together, they inevitably composed a unique porous framework shown in Fig. 12(a). The as-prepared NiCoO2/rGO/NiCoO2 composite has a similar structure, as shown by the FESEM images in Figs. 12(c) and 12(d) and the TEM image in Fig. 10(e). The diffraction rings of corresponding SAED pattern in the inset of Fig. 12(e) and the interference fringe in the HRTEM image of Fig. 10(f) validate that crystalline NiCoO2 sheets formed on the rGO sheets. After two NiCoO2 sheets anchor on both sides of GO, the thickness of the sandwich sheet is about 6 nm which is also determined by AFM. After adding GO, the thickness of the synthesized NiCoO2/rGO/NiCoO2 sandwich sheet is still thin enough, and comparable to that of the pure NiCoO2 sheet. Thus the unique porous architecture of the pure NiCoO2 nanosheets is inherited by the NiCoO2/rGO/NiCoO2 sandwich sheets as shown in Fig. 12(c). The BET specific surface area and pore volume are 138.1 m2/g and 0.80 cm3/g for the NiCoO2/rGO/NiCoO2 composite, which are even larger than the pure NiCoO2 (124.8 m2/g, 0.31 cm3/g).
(a) SEM image and (b) TEM image of the pure NiCoO2 and the inset is the corresponding SAED pattern; (c) and (d) SEM images of the NiCoO2/rGO/NiCoO2 composite; (e) TEM image and (f) HRTEM of the NiCoO2/rGO/NiCoO2 composite. The inset in e is the corresponding SAED pattern.

CV and galvanostatic charge/discharge measurements were performed on the NiCoO2/rGO/NiCoO2 composite in three electrode configurations to evaluate its electrochemical performance as an electrode of SC. Figure 13(a) shows the typical CV curves of the NiCoO2/rGO/NiCoO2 composite from 5 to 80 mV/s. The shape of the CV curve is distinct from that of electric double-layer capacitance characterized by nearly rectangular CV curves, Reference Cui, Lv, Sagar, Liu and Zhang61 which clearly confirms the pseudocapacitive behavior. Two pairs of well-defined redox peaks can be observed in the CV curves. For the CV curve scanned at the lowest rate of 5 mV/s, two oxidation peaks appear at ∼0.44 and 0.48 V in the anodic sweep and two reduction peaks appear at ∼0.29 and 0.33 V in the cathodic sweep, which correspond to the Faradaic oxidation/reduction reactions of Ni–O/Ni–O–OH and Co–O/Co–O–OH, respectively. As the scan rate increases, the shape of CV curve is well maintained, indicating that the NiCoO2/rGO/NiCoO2 composite is beneficial for fast redox reactions. But the potential differences between oxidation and reduction peaks also increase with scan rate, which suggests the irreversible reactions and electric polarization. Reference Feng, Zhang, Zhang, Bai and Wang62 The corresponding charge/discharge curves tested at various current densities are presented in Fig. 13(b). Evidently, there are well-defined voltage plateaus in all these charge/discharge plots, which further suggests the typical pseudocapacitive characteristics. Figure 13(c) shows the relationships between specific capacitance and the current density of pure NiCoO2 and NiCoO2/rGO/NiCoO2. Clearly, the NiCoO2/rGO/NiCoO2 electrode exhibits higher specific capacitance values than pure NiCoO2 electrode at each current density. The NiCoO2/rGO/NiCoO2 electrode gives an excellent pseudocapacitance of 784, 763, 682, 640, 572, and 546 F/g at current density of 1, 2, 5, 10, 20, and 30 A/g, respectively. The higher the current density is loaded, the larger the capacitance gap between the NiCoO2/rGO/NiCoO2 electrode and the pure NiCoO2 electrode is. It suggests that the NiCoO2/rGO/NiCoO2 electrode would benefit from the good conductivity of rGO. The rate performance of the electrode is also good, even compared with recent reported work. Reference Xu, Wei, Tan, Yu and Chen63 The cycling stability, an important indicator for high-efficiency SC, is further evaluated under repeated charge/discharge condition at a constant current density of 20 A/g [Fig. 13(d)]. Impressively, there is only a loss of 12.4% in the specific capacitance even after cycling for 2000 cycles.
(a) CV curves and (b) galvanostatic charge/discharge profiles of the NiCoO2/rGO/NiCoO2 electrode in three electrode configurations; (c) specific capacitance of the pure NiCoO2 electrode and NiCoO2/rGO/NiCoO2 electrode at various current densities; (d) cycling performance of the NiCoO2/rGO/NiCoO2 electrode at a current density of 20 A/g.

The lithium storage performances of the NiCoO2/rGO/NiCoO2 composite were also investigated by assembling them into lithium-ion half-cell batteries. Figure 14(a) displays representative CV profiles of the NiCoO2/rGO/NiCoO2 electrode at a scan rate of 0.2 mV/s between 0.01 and 3 V. Three obvious redox peaks can be clearly identified from every CV curve. For the first cathodic sweep, the dominant cathodic peak locating at around 0.51 V can be attributed to the reduction of Ni2+ and Co2+ and the formation of SEI film. And the cathodic peak subsequently shifts to around 0.93 V with a reduced intensity in the following scans. In addition, two poorly defined anodic peaks at ∼1.45 and 2.23 V could be assigned to the oxidation of metallic Co and Ni to CoO and NiO, respectively. Remarkably, apart from the first cycle, the subsequent cycles overlap well, suggesting the good reversibility of the redox reactions. On the basis of the CV results and previous literature, Reference Xu, Dong, Ding, Xiao and Yu64–Reference Ge, Gu, Wang and Tu67 the total electrochemical reaction mechanism could be described by the following electrochemical conversion reaction:
 $${\rm{NiCo}}{{\rm{O}}_2} + 4{\rm{L}}{{\rm{i}}^ + }{\rm{ + \ }}4{{\rm{e}}^ - } \to {\rm{Co}} + {\rm{Ni}} + 2{\rm{L}}{{\rm{i}}_2}{\rm{O}}\quad {\rm{.}}$$
 $${\rm{Co}} + {\rm{L}}{{\rm{i}}_2}{\rm{O}} \leftrightarrow {\rm{CoO}} + 2{\rm{L}}{{\rm{i}}^ + } + 2{{\rm{e}}^ - }\quad .$$
 $${\rm{Ni}} + {\rm{L}}{{\rm{i}}_2}{\rm{O}} \leftrightarrow {\rm{NiO}} + 2{\rm{L}}{{\rm{i}}^ + } + 2{{\rm{e}}^ - }\quad .$$
(a) Representative CV curves at a scan rate of 0.2 mV/s and (b) charge/discharge voltage profiles at a current density of 0.1 A/g of the NiCoO2/rGO/NiCoO2 electrode versus a metallic lithium reference electrode; (c) cycle performances at a current density of 0.1 A/g and (d) rate performances of the pure NiCoO2 and NiCoO2/rGO/NiCoO2 electrode; (e) cycle performance and coulombic efficiency for the NiCoO2/rGO/NiCoO2 electrode at a current density of 1 A/g.

The typical charge/discharge voltage profiles of NiCoO2/rGO/NiCoO2 composite at a current density of 0.1 A/g are shown in Fig. 14(b). The initial discharge and charge capacities of the electrode are 1186 and 850 mA h/g, respectively, suggesting a coulombic efficiency of 71.7%. The second discharge capacity is 920 mA h/g, suffering 266 mA h/g loss compared to the initial one. That is consistent with the peak intensity decline in the second cathodic sweep of the CV curves. The voltage plateaus of the second discharge curve increases from 0.75 V to 1.1 V, corresponding to the reduction peak shift in the second cathodic curve of the CV curves. The large irreversible capacity loss and the increase of the voltage plateaus should be associated with SEI film formation and electrolyte decomposition. Reference Guan, Wang, Li, Zhi, Zhai, Bando and Golberg68,Reference Gu, Li, Wang, Bongard, Spliethoff, Schmidt, Weidenthaler, Xia, Zhao and Schuth69 The following discharge/charge cycle overlaps the second one very well. The good overlapping of the curves after the first cycle suggests a good electrochemical reversibility. For pure NiCoO2 electrode, the initial discharge and charge capacities are 950 and 633 mA h/g, giving a much lower coulombic efficiency of 66.6%. And it still suffers capacity loss even after the second cycle.
The cyclic performances of the NiCoO2/rGO/NiCoO2 electrode and the pure NiCoO2 electrode are also compared at a current density of 0.1 A/g. As shown in Fig. 14(c), the capacity of pure NiCoO2 continuously drops off during discharge/charge cycle. After 60 cycles, the NiCoO2 electrode only delivers a reversible capacity of 391 mA h/g. For NiCoO2/rGO/NiCoO2 electrode, the reversible capacity is gradually increasing during the initial 17 cycles until it achieves the maximum value of 998 mA h/g, 83.8% of the initial discharge capacity. That capacity can be retained till the 60th cycle. Figure 14(d) show the rate performance of the NiCoO2/rGO/NiCoO2 electrode at different current density (0.1–1.6 A/g). The NiCoO2/rGO/NiCoO2 electrode delivers an average discharge capacity of 880, 886, 856, 807, and 706 mA h/g at current density of 0.1, 0.2, 0.4, 0.8, and 1.6 A/g, respectively. 80.3% of the capacity can be retained even as the current density is enlarged 16 times from 0.1 to 1.6 A/g. Importantly, as the current density returns to 0.1 A/g after the 60 cycles, the electrode releases an even higher reversible capacity (1010 mA h/g) than the initial. In fact, that value is comparable to the one obtained after 60 times cycling of discharge/charge at 0.1 A/g shown in Fig. 14(c). The electrode is so stable that large current density loading does not cause any capacity loss. Its cycle life can be up to 350 cycles at 1 A/g, as shown in Fig. 14(e). The reversible capacity suffers a fast decline in the initial 20 circles and then is maintained at 595 mA h/g for the following 330 cycles. As a contrast, the pure NiCoO2 electrode presents a worse rate capability at each current density and the gap between the reversible capacities of two electrodes expands as the current density increases. The large current density loading also cause unrecoverable capacity loss. As the current density returned to 0.1 A/g, only a half of the initial capacity was retained. The excellent performance of the NiCoO2/rGO/NiCoO2 electrode on storage of lithium is even rare in recent reports of the same kind electrodes. Reference Zhang, Yan, Tang, Li, Wang and Cao16,Reference Sun, Hu, Luo and Huang55,Reference Xu, Dong, Ding, Xiao and Yu64–Reference Liu, Zhao, Yu, Ahmad and Sun66,Reference Bai, Ju, Guo, Qian, Tang and Xiong70–Reference Xie, Yuan, Dong, Su, Zhang and Du75
EIS measurements were carried out at frequencies from 100 kHz to 0.01 Hz on both as-prepared electrodes. As shown in Fig. 15, the Nyquist plots of the NiCoO2/rGO/NiCoO2 and NiCoO2 electrodes share a similar feature with an inclined line at low frequency region and a depressed semicircle in the high-medium frequency region. The interception on the Z′ axis at the high-frequency end denotes the electrolyte resistance (R e). The size of the semicircle that encompasses the medium-frequency region is a symbol of the charge-transfer resistance (R ct). And the inclined line in the low-frequency response indicates the Warburg impedance related to Li-ion diffusion in the solid. Reference Zhang, Zhang, Li, Kang, Li and Wang47,Reference Leng, Wei, Jiang, Lian, Wang and Jiang76 Using the equivalent circuit model in the inset of Fig. 15, Reference Leng, Ding, Hu, Wei, Jiang, Lian, Wang, Jiang and Liu39,Reference Luo, Luo, Jiang, Zhou, Yang, Qi, Zhang, Fan, Yu, Li and Yu46 R ct can be obtained by fitting the spectra. It is 52 Ω for the NiCoO2/rGO/NiCoO2 electrode and 92 Ω for the NiCoO2 electrode.
Nyquist plots of the as-prepared pure NiCoO2 and NiCoO2/rGO/NiCoO2 electrodes versus metallic lithium reference electrodes over the frequency range from 100 kHz to 0.01 Hz at room temperature. And the inset is the fitting equivalent circuit model.
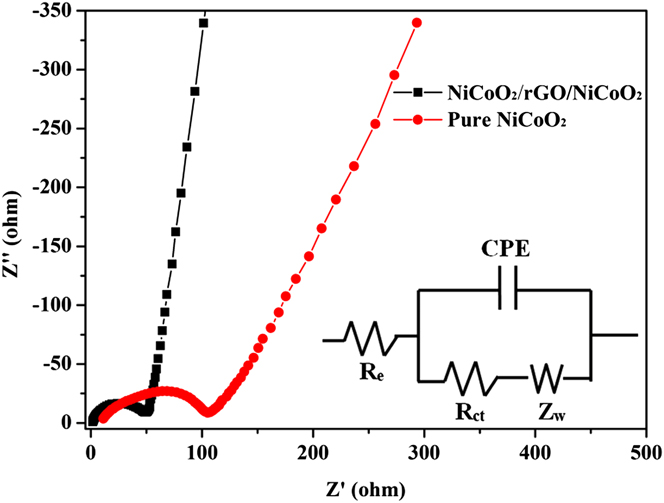
As excellent electrodes of SCs and LIBs, they should be porous, to make sure the access of electrolyte, own high specific surface area and good conductivity. Pseudo-capacitance chemical reaction takes place on the interface of electrode materials with electrolyte. High specific surface area can provide a high ratio of mass on the interface to react and thus guarantee a high specific capacitance. High specific surface area can also supply plenty of reaction sites for LIBs and shorten the route of lithium ion diffusion. Then the LIBs can have large lithium storage and good rate performances. Good conductivity is essential to electrode materials of SCs and LIBs, which can improve the reaction kinetics, power density, output voltage and energy density. The synthesized NiCoO2 sheets in this paper are ultrathin. Although they are crystalline, they can still be randomly wrinkled and needn't keep an invariable contour profile of crystal. As stacking together, the random wrinkled sheets mutually brace each other and build up a unique porous architecture. To improve the conductivity, the rGO sheets with high quality were in situ sandwiched by NiCoO2 sheets in the work, where rGO sheet can act as an expressway for charge transfer. The as-prepared NiCoO2/rGO/NiCoO2 sandwich sheets are as thin as the NiCoO2 sheets. So they can inherit the properties of the NiCoO2 sheets and build up a similar porous architecture like the NiCoO2 sheets. The adding of rGO significantly improves the conductivity of the electrode, as proved by the EIS results in Fig. 15. That makes the electrode have a better rate performance than the pure NiCoO2 electrode in SCs and LIBs. Meanwhile, rGO is ultra-flexible. The large volumetric change of NiCoO2 during lithiation/delithiation can be accommodated by the flexible rGO and the room between the sandwich sheets. Reference Chen, Zhuo, Deng, Xu, Li and Wang8,Reference Gao, Wu and Lou56 As the NiCoO2 sheets are firmly anchored with rGO, even if the NiCoO2 sheets pulverized during cycling, they wouldn't peel off from the surface of rGO. Thus, the electrode materials are still active, and the integration of the electrode remains stable. That explains why the cycle life of the SC/LIB using this electrode is pretty long.
IV. ULTRAFINE TMO NANOPARTICLES ENCAPSULATED BY CARBONOUS MATERIALS
Another strategy toward alleviating the poor conductivity and pulverization of TMO is nanostructuring. Compared to the bulk counterparts, nanosized electrode materials own many merits. Firstly, nanosized materials are generally too tiny to be pulverized. Meanwhile the void between the nanosized electrode materials can provide spaces to buffer the mechanical stress induced by the volume change. Reference Poizot, Laruelle, Grugeon, Dupont and Tarascon18 Consequently, nanostructured electrode materials usually have a higher reversible capacity as well as a longer cycle life than their bulk counterparts. Secondly, nanostructured electrode materials hold a very high surface-to-volume ration, which provide plenty of reaction sites and shorter diffusion paths. Reference Li, Tan and Wu77 Thus, these electrodes present a high rate capacity and a high power density. Substantial efforts have been made on nanostructuring and huge progress has been made on it. Reference Wang, Qiao, Sun, Li, Hu, Zhang and He24,Reference Li, Cheah, Ko, Teh, Wee, Wong, Peng and Srinivasan50 Meanwhile, these works also obviously show that nanostructuring can't solely solve all the problems thoroughly that transition metal oxides have suffered as LIBs anode materials. Nanoparticles (NPs) tend to aggregate after tens of cycling. This problem has been partially alleviated by separating them by graphene. Reference Huang, Wang, Xu, Wang, Wang, Xu, Wu, Liu, Zhang and Zhang11,Reference Li, Zhou, Shan, Pei, Li and Cheng78–Reference Choi, Chang, Lee, Bae, Kim and Huh80 But such physical adsorption is not very strong enough. After dozens of circulation, they can also be desorbed from the surface. The nanovoids included in the nanostructured electrode materials can't strongly support the structural stability and integrity. The initial morphology generally loses after dozen of cycles because of pulverization. If these nanovoids can be filled in by some solid materials which not only give a support to the nanostructured materials and buffer the inner stress but also improve the electric conductivity, then the LIBs anode materials are integrated as a unite. The properties of LIBs anode must be meliorated a lot. Thus, Co3O4 NPs were successfully synthesized and encapsulated by porous graphitic carbon nanosheets in my lab. It presented very high reversible capacity and excellent cycling stability especially at high rate as LIBs anode.
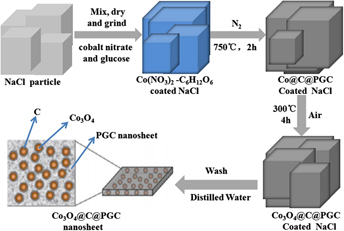
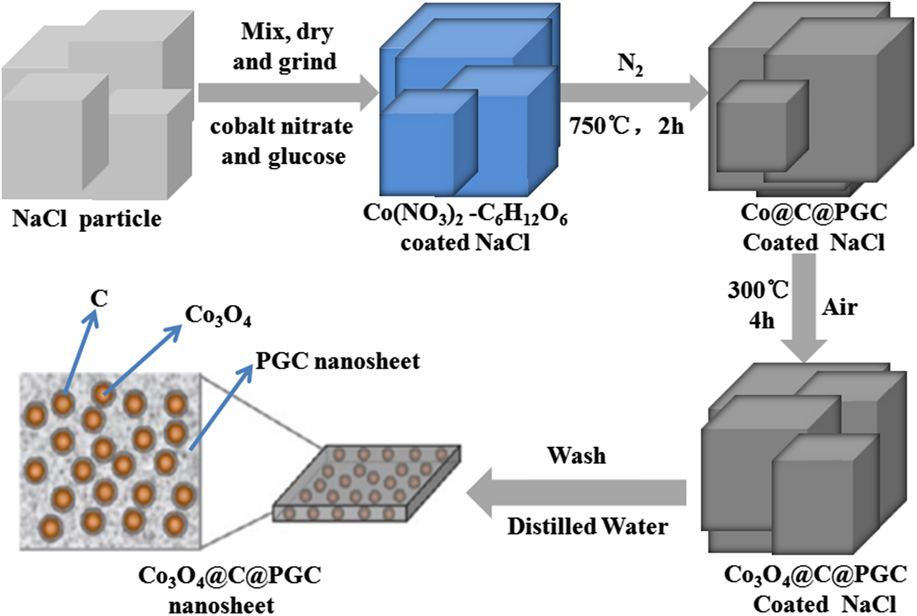
The overall synthetic procedure of the Co3O4@C@PGC nanosheets is schematically illustrated in Fig. 16. Reference Leng, Wei, Jiang, Lian, Wang and Jiang81 Two strategies were involved in this procedure. Firstly, the water-soluble NaCl particle surface was utilized as the template for the nanosheets because NaCl has a face-centered cubic (fcc, Fm3m (225), a = 0.5642 nm) crystal structure, and its growth rate can be controlled by varying the concentration and temperature. Reference Qin, He, Zhao, Wang, Shi, Liu and Li48,Reference Chakraborty and Patey82,Reference Chakraborty and Patey83 Secondly, glucose and cobalt nitrate were chosen as the carbon precursor and the metal precursor, respectively, due to their low cost. In the synthesis, the NaCl, C6H12O6, and Co(NO3)2 were first dissolved in distilled water to get a homogeneous solution. After gradually heated to 80 °C, the solution color changed from pink to blue, the sample viscosity increased greatly, and then the polymerization of the glucose began, which resulted in the generation of a very thin frame homogeneously coated on the NaCl particle surface. After that, the composite powders were calcined at 750 °C under N2. During this process, The Co(NO3)2·6H2O was decomposed into oxide. The oxide was subsequently reduced by C6H12O6 into Co NPs, which is very active to catalyze the decomposition of C6H12O6 into carbon. The fresh generated carbon usually encapsulated the Co NPs firstly, and then piled up in the form of porous graphitic carbon. As a result, the coating layer on the surface of the NaCl particles was converted to carbon-encapsulated Co NPs embedded in porous graphitic carbon nanosheets (Co@C@PGC nanosheets). In the second step, the Co NPs were further oxidized into Co3O4 NPs as the Co@C@PGC nanosheets were calcinated in air. Finally, the porous graphitic carbon nanosheets in which plenty of Co3O4 NPs were embedded (Co3O4@C@PGC nanosheets) were obtained on the surface of the NaCl particles.
Schematic illustration of the in situ sol–gel technique to fabricate Co3O4@C@PGC nanosheets by using the surface of NaCl particles as the template.
The morphology of Co@C@PGC and Co3O4@C@PGC nanosheets was shown in the SEM image of Figs. 17(a) and 17(b), respectively. As shown in Fig. 17(a), a lot of graphite nanosheets with a thickness of about 20 nm and an area of 1–10 μm2 interconnected with each other to build up a 3D porous architecture. This architecture can be reserved even after calcinations in air, which is evidenced by the SEM image shown in Fig. 14(b). The inset in Fig. 17(b) clearly shows that the thickness of the nanosheets is around 20 nm. The morphology of Co3O4/C composites was also observed by SEM. The flakes are very thicker and larger than Co3O4@C@PGC nanosheets. Their thickness is more than 500 nm. There is no interconnection among the flakes. They just pile up on each other, leaving very little space between them. Of course, the space isn't stable, yet. The thin sheets observed in Co@C@PGC and Co3O4@C@PGC disappear thoroughly in Co3O4/C composites. It suggests that NaCl particles have played a crucial role in building up such 3D porous architecture of nanosheets. A TEM image and HRTEM image of Co3O4@C@PGC nanosheets were shown in Figs. 17(a) and 17(d), respectively. The graphite carbon nanosheets seem to be transparent to the electron beam and show a very low contrast in the image, which again suggests that the nanosheet is very thin, around tens of nanometers. The black rings located on the sheet of Fig. 17(c) indicate a foam-like structure of the graphite. Co3O4 NPs, with diameters ranging from 5 to 40 nm, are well-dispersed in the PGC nanosheet. The selected area electron diffraction pattern in the inset of Fig. 17(c) further verifies the encapsulated core being Co3O4 NPs. In fact, the Co3O4 NPs were firmly anchored by the porous graphite nanosheets. As shown in Fig. 17(d), a Co3O4 crystal is perfectly encapsulated by thin and well-graphitized onion-like carbon shells. The HRTEM interference fringes of the Co3O4 crystal can be clearly discerned. They have a spacing of 0.24 nm, as denoted in Fig. 17(d), which is equal to the spacing of (311) plane of Co3O4. The spacing of the interference fringe of the shell is 0.34 nm, which is also equal to the spacing of (002) plane of graphite. And the thickness of graphite shell is about 9 nm. The morphology of Co@C@PGC nanosheets is also characterized by TEM and HRTEM. Carefully comparing the results, it is found that there is little difference on the morphology of the graphite carbon sheets and the crystal sizes. It again makes sure that the calcinations didn't hurt the graphite carbon sheets and none coalescence happened among Co NPs. The Co NPs just was oxidized at its place and converted to Co3O4 NPs.
(a) SEM image of Co@C@PGC nanosheets; (b) SEM image of Co3O4@C@PGC nanosheets and the inset is SEM image of high magnification; (c) TEM and (d) HRTEM image of Co3O4@C@PGC nanosheets.

The initial three cycles of the representative cyclic voltammogram (CV) performed on a coin half-cell at room temperature between 0.01 and 3.0 V at a sweep rate of 0.1 mV/s is presented in Fig. 18(a). In accord with previous results, the first cycle shows lots of differences from the subsequent ones on CV curves, especially on the discharge branch. Reference Luo, Wang, Liang, Ning, Li and Zhi29,Reference Li, Cheah, Ko, Teh, Wee, Wong, Peng and Srinivasan50,Reference Wang, Li, Zhang, Luo, Jin, Liang, Dayeh, Picraux and Zhi84 In the first discharge process, the obvious cathodic peak was located at around 0.97 V, which was attributed to the electrochemical reduction of Co3O4 to metallic cobalt accompanying the formation of Li2O and the solid electrolyte interphase (SEI) film. Reference Wang, Li, Zhang, Luo, Jin, Liang, Dayeh, Picraux and Zhi84–Reference Ge, Gu, Wang and Tu86 In the anodic process, broad peaks located at around 2.15 V can be ascribed to the reversible oxidation reaction from cobalt to Co3O4. Reference Li, Zhou, Shan, Pei, Li and Cheng78 The total electrochemical reaction mechanism of Co3O4 anode can be described by the following electrochemical conversion reaction Reference Xiong, Chen, Lou and Zeng87 :
 $${\rm{C}}{{\rm{o}}_3}{{\rm{O}}_4} + 8{\rm{Li}} \leftrightarrow 4{\rm{L}}{{\rm{i}}_2}{\rm{O}} + 3{\rm{Co}}\quad {\rm{.}}$$
(a) Representative CV curves of an electrode based on the Co3O4@C@PGC nanosheets obtained at a voltage range of 0.0–3.0 V (vs Li+/Li) and potential scan rate of 0.1 mV/s. (b) Voltage profiles of the Co3O4@C@PGC nanosheets electrode at a current density of 0.1C. (c) Charge/discharge capacities of the Co3O4@C@PGC nanosheets, Co3O4/C composite and Co3O4 NPs at a current density of 0.1C. (d) Rate capabilities and cycle performance of Co3O4@C@PGC nanosheets and Co3O4/C composite electrodes cycled at different rates from 0.1 to 20C (1C = 1 A/g).

The main reduction peak is shifted to ∼1.15 V, and the peak intensity drops significantly from the second cycle, indicating the occurrence of some irreversible reactions associated with formation of the SEI film in the first cycle. Reference Hou, Lang, Han, Li, Zhao, Wen, Zhu, Zhao, Li, Lian and Jiang88 On the other hand, the oxidation peak at ∼2.2 V in the anodic sweep exhibits little change during the three cycles, suggesting that the SEI formed on the PGC nanosheets surfaces in the first cycle is very stable.
Typical galvanostatic charge/discharge curves of the Co3O4@C@PGC nanosheets electrodes at a current density of 0.1 A/g between 0.01 and 3.00 V are shown in Fig. 18(b). The initial charge and discharge capacities are approximately 1187 and 1859 mA h/g, respectively, resulting in an initial coulombic efficiency of ∼64%. The initial irreversible capacity loss of the Co3O4@C@PGC nanosheets could be associated with the inevitable formation of SEI and decomposition of electrolyte Reference Chen, Zhuo, Deng, Xu, Li and Wang8,Reference Gao, Wu and Lou9,Reference Wang, Zheng, Wang, Chen, Xu, Zuo, Wu, Sun, Li, Hou and Song85,Reference Jia, Chen, Cui, Peng, Wang, Wang, Wei and Lu89 and in good agreement with the above CV results. The discharge voltage plateau at ∼1.1 V in the first cycle shift to ∼1.2 V since the second cycle, just corresponding to the shift of reduce peak in CV curves from 0.97 V to 1.15 V. The areas under the charge and discharge curves are comparable, indicating a very low energy loss during charge/discharge. Starting from the 10th cycle, both charge and discharge curves are overlapping the previous one up to the 100th cycle, which indicates that the Co3O4@C@PGC nanosheets exhibit excellent cycle stability. Reference Wang, Xu, Sun, Gao and Lin79,Reference Liang, Cheng, Ding, Zhao, Zhao, Song and Wang90
The cycle performances of the Co3O4@C@PGC nanosheets, Co3O4/C composite and Co3O4 NPs were investigated at a current density of 0.1 A/g. The results were shown in Fig. 18(c). The Co3O4@C@PGC nanosheets electrode has the best cyclic retention and the highest reversible capacity. After 100 cycles, the reversible capacity is as high as 1413 mA h/g. The capacity is even higher than the theoretical capacity of Co3O4. Such high specific capacity should be attributed to the following points: firstly, the PGC nanosheets have a reversible capacity of 580 mA h/g, and there would be synergetic effects between PGC nanosheets and Co3O4 NPs, Reference Wang, Zheng, Wang, Chen, Xu, Zuo, Wu, Sun, Li, Hou and Song85 which can also contribute to the lithium storage capacity. Secondly, the reversible decomposition of the electrolyte with the formation of SEI and extra lithium ion adsorption/desorption on the SEI during cycling may lead to the high experimental lithium storage capacity as well. Reference Nam, Kim, Yoo, Chiang, Meethong, Hammond, Chiang and Belcher41,Reference Poizot, Laruelle, Grugeon, Dupont and Tarascon91 In contrast, the reversible capacity of the Co3O4/C composite is much lower, which is only ∼763 mA h/g at the end of the 100 cycles. But it also has an excellent cycling performance. Although, the bulk carbon in Co3O4/C composite prevents the Co3O4 NPs from playing their best in the lithium storage capacity, it still takes an important role in holding the integrality of the structure. The Co3O4 NPs show the fastest capacity fading and the lowest reversible capacity which is below 549 mA h/g after 40 cycles. In the case of bare Co3O4 NPs, SEI trends toward rupture to accommodate the volume change induced by Li+ expansion/contraction. The Co NPs forming in discharging processes also have catalyzing effect on SEI and are harmful to the integrality of the film. Thus the electrode material surface will cyclically expose itself to the electrolyte and more and more SEI films consecutively form on it, which leads to continual consuming of electrolyte and the fast capacity fading. Reference Kim, Seo, Kim, Kim and Kang5,Reference He, Wu, Zhao, Shi, Liu and Li92 However, a very thin carbon shell covers the electrode material in Co3O4@C@PGC nanosheets, which induces a strong synergistic effect between porous graphitic carbon nanosheets and carbon-encapsulated Co3O4 NPs. Reference He, Wu, Zhao, Shi, Liu and Li92 During the charge/discharge process, the carbon shell is very beneficial to stabilize SEI film and avoid rupturing. Meanwhile, it is also effective to prevent the Co3O4 NPs from agglomerating. The porous sheet structure of carbon which links the shelled Co3O4 NPs provides enough space to accommodate the huge volume changes. In addition, the high specific surface area of Co3O4@C@PGC nanosheets ensures a high contact area between the electrode and electrolyte. So Li+ has plentiful diffusion accesses from electrolyte into electrode interior, which will intensively enhance the transport rate of Li+. All these factors are vital for the electrode to retain the excellent cycling stability and high reversible storage capability. Reference Zhang, Yan, Tang, Li, Wang and Cao16
The electrode made by Co3O4@C@PGC nanosheets also has the best rate capability, as shown in Fig. 18(d). After three cycles at 0.1C, the electrodes were firstly tested at 1C (1C = 1 A/g). It is obvious that the Co3O4@C@PGC electrode still needs ten more cycles to activate all active materials for its reversible capacity increases with cycle number until the 11th cycle. Reference Peng, Chen, Qin, Yang, Li, Zuo, Liu and Yang27,Reference Xiong, Chen, Lou and Zeng87 Meanwhile, the Co3O4@C composite electrode shows a stable capacity as tested at 1C. The reversible capacity of the Co3O4@C@PGC nanosheets electrode reaches a very high value of 1105 mA h/g at the 11th cycle, Reference Li, Zhou, Shan, Pei, Li and Cheng78,Reference Zhu, Bai, Sun, Zhang, Li, Cao, Yan and Xie93 while the Co3O4@C composite electrode maintains a reversible capacity of 502 mA h/g during these cycles. At each tested specific current density including 2, 5, 10, and 15C, the average reversible capacity of the Co3O4@C@PGC electrode (1030, 845, 560, and 461 mA h/g) is much higher than Co3O4@C composite electrode (430, 323, 240, 185 mA h/g). At most of specific current density except of 20C, the reversible capacity of the Co3O4@C@PGC electrode is larger than the theoretical capacity of a commercial graphite anode (∼372 mA h/g). Reference Jia, Chen, Cui, Peng, Wang, Wang, Wei and Lu89 Even at 20C, the average reversible capacity (345 mA h/g) is still very close to the theoretical capacity of graphite. When the current rate finally returns to the initial value of 1C after 61 cycles, the electrode can recover its initial capacity of 1030 mA h/g with a little bit loss. And it is still sustainable up to the 70th cycle.
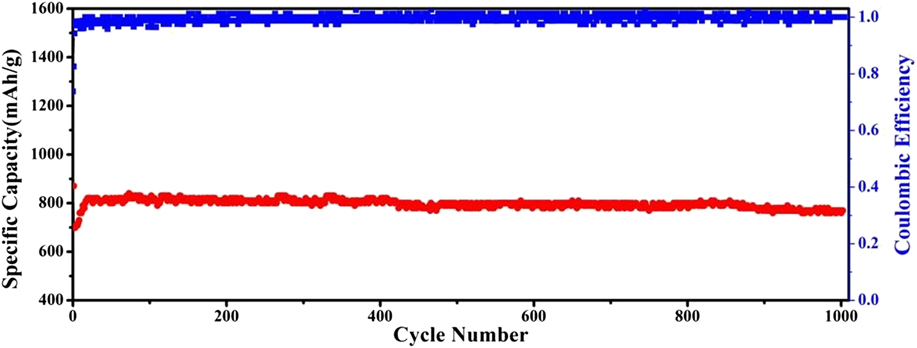
To further confirm the durability of this nanosheet anode to work at higher rate, the cyclability of the Co3O4@C@PGC nanosheets electrode has been further investigated upon 1000 cycles at 5C and the result is shown in Fig. 19. In the initial 20 cycles, the specific capacity gradually increases up to 820 mA h/g, corresponding to a process of activating the active substance, which is common in the literature. Reference Peng, Chen, Qin, Yang, Li, Zuo, Liu and Yang27,Reference Xiong, Chen, Lou and Zeng87 It is striking to note that the specific capacity can remain as high as 760 mA h/g even after 1000 cycles. Firstly, the well-graphitized carbon shells firmly cover Co3O4 NPs and integrate into PGC nanosheets. Thus, a continuous network is constructed by the conductive carbon, which ensures the electron transport freely. The porous structure of the nanosheets provides a huge interfacial area with electrolyte. The electrode has abundant accesses for Li+ to interior active materials. The thin film structure of Co3O4@C@PGC nanosheets shortens the diffusion path of Li+. So the electrode can work very well at a very high specific current density. Meanwhile, the thin carbon shells separate Co3O4 NPs from electrolyte and each other. So a firm and stable SEI film can form on the carbon surface because the side reaction between SEI film and Co3O4 NPs is effectively blocked. And the aggregation Co3O4 NPs can also be suppressed. Carbon materials always have good mechanical flexibility, which endow the shells with the ability to expand and contract with Co3O4 NPs during lithium ion insertion/extraction process. Finally, the volume change is accommodated by the abundant macropore and mesopore in the PGC nanosheets. Thus, the electrode shows a good cycling stability. At last, the thin film structure is also very favorable for the adsorption of lithium ions on both sides, edges, and other defects of these nanosheets. Reference He, Wu, Zhao, Shi, Liu and Li92,Reference Chen, Wang, He, Zhao, Shi, Liu and Li94 That endows the electrode with an ultrahigh lithium storage capability.
Cycle performance and coulombic efficiency for the Co3O4@C@PGC nanosheets electrode at higher current density of 5C.
V. CONCLUSION
No method can really prevent TMO from pulverization, because it is related to the Li ion storage mechanism. During discharge process, the TMO is reduced into metal nanoparticles which homogeneously distributes in a Li2O matrix. During charge process, the Li2O matrix disappears and the metal nanoparticles have little change to unite into a bulk metal oxide. Provided the nanoparticles keep activation, pulverization is not harmful, or even good for the reversible capacity, because the nanoparticles generated from pulverization can shorten the Li ion diffusion and electron transfer distance. How to keep the nanoparticles active is the key point to saving the capacity fading of TMO anodes. In our lab, we have tried SEI film and rGO to improve the stability of the structure. That purpose has been achieved to some extent. But the product is still far from commercial. It seems that those strategies just can alleviate but can't stop the fading of the capacity. Pulverization also has a limitation, beyond which pulverization can't happen. Thus we synthesized ultrafine nanoparticle of cobaltosic oxide, the diameter of which is close to 10 nm. Then the nanoparticles were encapsulated by porous graphitic carbon. The nanoparticles can still pulverize during lithium ion insertion/extraction process, but they would be split into finite particles. All the particles can be encapsulated by and connected with the well-graphitized carbon shells. So they still can react with lithium ion and keep active. The electrode made by this method has a very stable reversible capacity until 1000 cycles. The large over voltage problem of TMO anode is related to the kinetic transport at the electrode/electrolyte interface and in the inner TMO. Nanoparticles generated from pulverization can also generate more reaction site and shorten the Li ion diffusion path. Thus, the rate performance of the electrode is also excellent. 30% capacity of the electrode can be charged/discharged in 3 min.
ACKNOWLEDGMENTS
This work was supported by National Natural Science Foundation of China (Grant No. 51401083, 51371089, 51601067, 51475200 and 51631004), and Program for Innovative Research Team (in Science and Technology) in University of Jilin Province, and Technology Development Project of Jilin Province (No. 20150519007JH).


 Open access

