

Introduction
There are many parameters to be compared and evaluated when selecting a good site for deep-ice-core drilling. Absolute temperatures, rates of accumulation, and the direction and speed of ice-flow trajectories upstream of the potential drill site are some key ones. Moreover, to calculate ages of specific ice layers and to make climatic interpretations correctly in the deeper parts of ice cores, the bed topography must be known.
If we find a good site for drilling, where the parameters mentioned are known, we still do not know why accumulation is at a certain rate, the proportion of wind-blown snow, temporal changes in katabatic-wind pathways (Reference Parish and BromwichParish and others, 1987), spatial and temporal variability in snow layering and how much non-climatic parameters might influence a temperature record (Reference Richardson, Aarholt, Hamran, Holmlund and IsakssonRichardson and others, 1997; Reference Isaksson, van den Broeke, Winther, Karlöf, Pinglot and GundestrupIsaksson and others, 1999; Reference Richardson and HolmlundRichardson and Holmlund, 1999).
In the area of interest for this paper (Fig. 1) several expeditions have made ground traverses and obtained ice cores (Reference SchyttSchytt, 1958; Reference Isaksson and KarlenIsaksson and Karlen, 1994; Reference Peel, Mulvaney, Pasteur, Chenery, Jones, Bradley and JouzelPeel and others, 1996; Reference Richardson, Aarholt, Hamran, Holmlund and IsakssonRichardson and others, 1997; Reference Oerter, Graf, Wilhelms, Minikin and MillerOerter and others, 1999; Reference Steinhage, Nixdorf, Meyer and MillerSteinhage and others, 1999; Reference Van den BroekeVan den Broecke and others, 1999). During the 1997/98 season two drill sites were chosen for medium-long and shallow coring within the European Project for Ice Goring in Antarctica (EPICA)-Dronning Maud Land (DML) pre-site surveys. Field analyses were made on the shallow cores and the medium-long cores were brought home for further study.
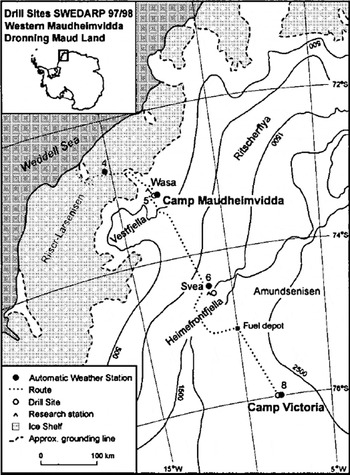
Fig. 1. Location nap. The route travelled is indicated with a dotted line. The numbers refer to the automatic weather stations described in Table 2.
In this paper we highlight some problems associated with climatic interpretations of single ice cores. The data used are ice and firn cores, snow pits, snow and radar depth soundings and global positioning system (GPS) measurements obtained during the 1997/98 Antarctic field season.
Field Activities
During the 1997/98 Nordic EPICA pre-site survey, field activities were concentrated at two sites (Fig. 1); at "Camp Victoria" (CV) on Amundsenisen (76°00’01"S, 08°03’03"W; 2400m a.s.L), approximately 550 km from the coast and at "Camp Maudheimvidda" (CM) on Maudheimvidda (74°06’19"S, 013°09’54"W; 362 m a.s.L), approximately 10 km from Was a, the Swedish station, and 140 km from the coast. CV is situated in the upper part of the drainage basin of the Stancomb Wills Ice Stream. CM is on the upstream side of the "Nunatak Basin" in the Vestfjella range. Ice moves from Ritschterflya towards the coast; the nunatak and associated subglacial obstacles act like a dam, diverting ice either side of the nunatak.
Firn and ice cores were drilled to obtain an estimate of the accumulation rate. The density and electric conductivity (ECM) of the cores were analysed in the field. Furthermore, to assess snow variability in the area, radar as well as pit studies were conducted. All field activities connected to the pre-site survey were conducted between 10 January and 10 February 1998.
Methods and Preliminary Results
Ice cores
The drilling programme included both medium-long firn/ ice cores and shallow firn cores. At CV, one 133 m core and five 10–20 m cores were sampled. The shallow cores were drilled at the corners of a 10 km grid centred on the medium-long-core drill site. A shallow core was drilled closeby. At CM, two medium-long cores, 104 m and 103 m, and five 10 m cores were retrieved from a 7 km grid. The two medium cores at CM were drilled 5 m apart.
Density
Density measurements were made on all cores during the packing and logging procedure. The depth-density data for the shallow cores around CV show a mean density of 408 kg m−3 for the 1–10 m column (std dev. = 8.4 kg m−3) and for CM a mean density of 522 kg m−3 (std dev. = 7.4 kg m−3).
Depth-density curves for the medium-long cores (Fig. 2) show a firn/ice transition 71m deep at CV (pore close off, 830 kg m−3) and at 55 m at CM (pore close off, 815 kg m−3) (Reference Martinerie, Lipenkov, Raynaud, Chappellaz, Barkov and LoriusMartinene and others, 1994). Observations of the core during packing suggest pore close off at about the same depth. The disturbance at the end of the density curves for the medium cores corresponds to measuring problems due to very brittle ice at these depths.

Fig. 2. Density profile for ice cores sampled at CV and CM, respectively. The firn-ice transition is marked with a solid line.
Electric-conductivity and dielectric-profiling measurements
Electric-conductivity measurements (ECM) were used to analyse all the shallow firn cores in the field. This was done according to the ECM technique described by Reference HammerHammer (1980). Each core piece, normally 0.35–0.45 m long, was planed with a microtome along the core axis. The width of the planed surface was 30–40 mm. Afterwards a core stratigraphy was established, including notes on grain-size, softer/ harder layers and ice lenses. The temperature of the core piece was also recorded. Since conductivity is temperature-dependent it is important to make measurements in an environment with stable temperatures and protected from direct solar radiation. The temperature in the CV laboratory was –17°C and –9°C in that at CM. To avoid temperature fluctuations within the core during the measurements all cores were stored in the laboratory for at least 15 h before measurements of a specific core started. However, the intercorrelation of results from the ECM measurements conducted on the shallow cores at CV was poor.
The medium-long ice cores were measured with a new version of the dielectric-profiling (DEP) device described by Reference WilhelmsWilhelms (1996) and Reference Wilhelms, Kipfstuhl, Miller, Heinloth and FirestoneWilhelms and others (1998). Using a fixed pair of electrodes, the core was moved through the device. This modification excluded any capacitance noise due to changing cable geometry. With the fixed pair of electrodes the instrument can be calibrated to a resulting error of 2% for permittivity and ≤ 5% for conductivity. The core’s density was calculated from the DEP data, with an error of ≤ 0.03 g cm−3, using Reference LooyengaLooyenga’s (1965) mixing model as described by Reference Wilhelms, Kipfstuhl, Miller, Heinloth and FirestoneWilhelms and others (1998). The records coincide with the ECM measurements and thus give strong evidence for the validity of the time markers used.
The 1815 Tambora volcanic signal level, found at 22.88 m depth, suggests a mean annual accumulation of 62 mm w.e. a"1 (Karlof and others, in press). The record shows a positive trend in accumulation during the last decades. According to the ECM and DEP analyses the CV ice core covers more than 1500 years (Karlof and others, in press) (Fig. 3). The Tambora event is not seen clearly in the CM core, but based on the (3 levels it is expected to show up at a depth of about 55 m. The entire core covers 300–400 years (Fig. 4).

Fig. 3. Stable oxygen isotope (δ18O) profile and ECM profile for the CV medium-long ice cores. The sample resolution is 25 mm for δ18O and 10 mm for the ECM.

Fig. 4. Stable oxygen isotope (δ18O) profile and ECM profile for the CM medium-long ice cores. The sample resolution is 250 mm for δ18O and 10 mm for the ECM. Table 1. Drill site locations and 10 m temperatures
10m temperature
The 10 m temperatures were taken with a thermistor string. To avoid wind pumping within the hole during the stabilizing time, the hole was sealed with an inflated plastic bag and snow. The thermistor string was left in the hole for at least 12 h before reading. Data from the measurements show some deviations. The mean 10 m temperatures at CV and CM are –38.5°C (std dev. = 0.5°) and –17.6°C (std dev. = 0.15°), respectively (Table 1). The temperature deviations probably cannot be explained solely by elevation differences nor by the different length of air-column-stabilizing period for each borehole. The 10 m temperatures for all locations are shown in Table 1.
Table 1. Drill site locations and 10 m temperatures

During the expedition, a new technique for measuring temperatures in boreholes was tested. If the thermistors are forced against the wall of the hole the relaxation time of the measurements should be reduced. When measuring with a suspended thermistor string the temperature measured is that in the hole; a value that is naturally sensitive to rapid air movements in the air column. An inflatable rubber tube was used to press the thermistors against the wall, the tube filling the diameter of the hole and preventing unstable air from flowing around the thermistors and disturbing the measurements. When measuring the air temperature, the relaxation time is normally about 12–15 h (Reference SeppalaSeppälä, 1992). Preliminary results from the tests with the new technique show a stabilizing period of about lh, significantly faster than when measuring with a string hanging free in the hole.
Stable oxygen isotopes
Stable oxygen isotopes from the CV medium-long ice core and from one of the CM medium-long ice cores were analysed by mass spectroscopy and the results expressed as δ18O‰ (Fig. 4). This value describes the relative deviation of 18O in the precipitation compared to standard mean ocean water (SMOW). The δ18O values found in the snowpack are closely related to the local mean annual surface temperature (Reference Dansgaard, Johnsen, Clausen and GundestrupDansgaard and others, 1973) and therefore can be used as a proxy for temperature. The less negative δ18O values in the CM core compared to the CV core are in accordance with the higher temperatures in the coastal area compared to the polar plateau. The CM core was sampled at a resolution of 25 mm along the entire core, while the CVcore was sampled at 25 mm in the top and bottom 20 m and at a resolution of 50 mm in between. There is no overall trend in the records over the time periods represented (approximately 300 years and 1500 years, respectively) but there is a substantial variation over both the longer (hundred years) and shorter (ten years) time-scales. The sample resolution is too coarse to reveal the annual cycles and therefor the dating has to rely on other parameters.
Total analyses
Apart from the atmospheric thermonuclear tests (conducted between 1952 and 1980, with two periods of intensive explosions in 1954 and 1961–62), two well-known radioactive layers, 1955 and 1965, are present in Antarctica.
After sampling and filtering about 500 snow samples from the two ice cores (Reference Delmas and PourchetDelmas and Pourchet, 1977), total (5 radioactivity (Reference Pinglot and PourchetPinglot and Pourchet, 1979), as well as gamma spectrometry, measurements were made to determine the deposition rates of specific radioisotopes, namely 137Cs and 210Pb. The January 1955 and January 1965 reference levels were determined in both the CV (7.45 m and 5.9 m) and CM (16.8 m and 13.4 m) ice cores.
The mean annual accumulation rates for the CV ice core depend on the time periods. The accumulation rates are 67 mm we. ± 2 mm, 69 mm we. ± 2 mm and 77 mm we. ± 6 mm, respectively, for the periods extending from 1965–98, 1955–98 and 1955–65. The rate for the CM ice core, for 1965–98 and 1955–98, is 220 mm we ± 6 mm.
The main uncertainty comes from determination of the exact depths of the radioactive layers (samples were about 0.1 m long). The January 1955 level corresponds to the first increase from natural radioactivity, whereas the January 1965 level corresponds to the first large increasejust before the maximum of total /3 radioactivity. A second significant uncertainty relates to the diameter of the ice cores and hence errors associated with the density measurements.
Automatic weather stations
Closely related to the medium-deep coring was the erection of six automatic weather stations (AWS) in Dronning Maud Land. These AWS were placed along a transect ranging from the coast to the Amundsenisen plateau, between the Swedish research stations Wasa and Svea (Fig. l).This means that altogether nine weather stations are now operational in DML and one on Berkner Island. Three AWS had already been erected in DML during the 1996/97 Nordic EPICA DML pre-site survey. The AWS on Berkner Island was erected in February 1995 by the Alfred Wegener Institute. The objective is to improve knowledge of the climatological conditions in this part of Antarctica, to obtain a better understanding of the surface energy and mass balance of the Antarctic ice sheet and to help with the interpretation of ice cores from the future EPICA DML drilling.
Each AWS consists of a vertical mast with a horizontal bar approximately 3 m high. All sensors, except the firn/ice temperature sensors, are attached to this bar. The stations measure air temperature, wind speed, wind direction, instrument height, air pressure, shortwave incoming and reflected radiation and longwave incoming and emitted radiation. The firn/ice temperatures are measured at ten different depths ranging from 0.1–100 m. The station recorders have a sampling rate of 5 mm and store and transmit two hourly averages using the ARGOS system.
Table 2 presents some results for the whole year 1998. They show the expected decrease in accumulation from the coast towards the higher plateau. The wind speed shows an increase towards the edge of the higher plateau where the surface slope increases. Except for site 5 the temperature decreases with increasing distance from the coast and increasing elevation.
Table 2. Annual mean values of 10 m firn temperature, wind speed and accumulation for 1998. The uncertainty given in the 10 m firn temperature is the standard deviation of the time series. AWS 7 is omitted because of lack of data

Radar
The high-resolution radar system was based on a Hewlett-Packard Network Analyser (8753B and D). It is a continuous-wave step-frequency radar, transmitting 201 evenly distributed frequencies. Three different bandwidths were used: 1.5 GHz centred on 1.5 GHz, penetrating 15 m of firn; 250 MHz centred on 900 MHz, penetrating about 100 m; and 6 MHz centred on 160 MHz, for a penetration depth of around 3000 m. Microwave measurements were performed using an output power 1–4 W, while VHF measurements were carried out using an output power around 100 W.
The radar was operated through a notebook computer. Positioning and navigation was possible using GPS receivers in different modes for different purposes.
Snow-radar measurements were made along routes from the coast up to CV, approximately 600 km. At CM both snow and depth radar surveys were performed (Reference Richardson and HolmlundRichardson and Holmlund, 1999). A large grid 10 × 20 km was mapped using 1.5 km spacing (Fig. 5) and high-resolution snow-radar soundings were also made at two smaller nets 5 × 5 km and 50 × 50 m. The spacings were 1km and 1.0 m respectively. Interpretation of the radar records has been described by Reference Richardson, Aarholt, Hamran, Holmlund and IsakssonRichardson and others (1997) and Reference Richardson and HolmlundRichardson and Holmlund (1999). Snow-radar soundings from CM indicate the accumulation rate at the drill site was 91% of the average in the study area (Reference Richardson and HolmlundRichardson and Holmlund 1999). The variability in snow-layer thickness, which was at approximately 10 m at the CM drill site, had a standard deviation of 40 % within the 10 × 20 km grid. The corresponding value for CV was 10%. The lower value is most probably due to relatively thick ice and low ice velocities compared to the coastal site, and thus a relatively smooth snow surface.

Fig. 5. Results from radar and GPS surveys carried out in February 1998 over a 10 × 20 km net. The bottom part shows the bed topography, based on radar soundings (150 MHz). The centre figure shows surface topography, based on GPS measurements. The top figure shows snow –layer thickness relative to the coring site. This data is based on high-frequency radar soundings (800–1100 MHz).
Snow-pit studies
Snow pits were dug at each drilling site, principally to increase the dataset on the spatial variability of chemical components in the snow and to obtain high-resolution records for interpretation together with the instrumental meteorological records. An understanding of the spatial variability and of the factors controlling the distribution of ions are essential for interpreting the climate and environmental history derived from the ion-chemistry records from a single deep ice core. Snow-pit sampling also assures a continuous chemical record from the loose uppermost part of the firn cores.
A large snow pit was dug at CV only 50 m from the medium-long-core drill site (Fig. 6). The pit was 2.5 m deep, 17 m in one direction and 7 m at 90° to the first direction. Structures were mapped and documented by photography, and the density and ECM at three different profiles on the walls were measured in situ (Reference Stenberg, Hansson, Holmlund and KarlofStenberg and others, 1999). Samples for analyses of δ18O and ten different ions were collected from one profile. Crust layers were observed at approximately 0.3 m intervals which may correspond to annual layers reflecting the increasing trend in accumulation observed in the area (Karlof and others, in press). The visible snow structure, together with records of δ18O, ions and ECM, indicated an average annual accumulation of about 75 mm.we. over the last 10 years.

Fig. 6. δ18O profiles for two snow pits and the upper 2m of the CV medium long core. The snow pits were dug at a horizontal distance of (a) 50 m and (b) 200 m, respectivelyJrom the medium-long-core drill site (c).
δ18O was also analysed in samples from a snow pit 200 m from the CV medium-long-core drill site. The δ18O profiles from the large snow pit, and from this second snow pit, are shown in Figure 6 together with the uppermost 2 m from the CVcore. The sample resolution was 40 mm in the large snow pit and 20 mm in the second snow pit. These records together indicate a large spatial variation in layering over these short distances. Not only is the phase is different, but also the amplitude and the absolute level as demonstrated by the mean values. The δ18O mean values (± std dev.) calculated for the upper 2 m are –41.6 ±2.8‰ for the profile from the large snow pit, –40.2 ±3.1‰ for the profile from the second snow pit and –39.7 ±3.2‰ for the CVcore (Fig. 6).
Conclusions
The ice-surface topography, 10 m temperatures, and temporal and spatial variability of the snow-layer thickness were mapped during a pre-site survey for medium-long ice cores, described in this paper, and as a pre-site survey for the EPICA programme.
At the Camp Victoria core site, the snow surface sloped gently towards southwest and had an elevation difference of 40 m within a 20 x20 km grid. The snow-layer thickness showed a standard deviation of approximately 10% both in a snow pit and along a 10 km snow-radar profile.
The ECM records showed a bad correlation between nearby drill sites. Stable oxygen-isotope records from the medium-long core and nearby snow pits were also lacking in correlation, emphasizing the importance of carefully done pre-site surveys. Mean δ18O values for 2 m profiles varied from –41.6%o to –39.7‰ (within a horizontal distance of 50 m). 10 m temperatures within the grid varied from –37.6°C to –39.1 °C, which cannot be explained by height differences. One possible process to be considered in interpreting these results is the drainage pattern of cold air in the area.
A 10 × 20 km grid at the Maudheimvidda core site was carefully mapped, using the snow-layering surface topography and bed topography. Ice thickness varied from 450–1200 m within the grid and bed topography was mirrored at the ice surface, though heavily smoothed and influenced by ice flow. The snow-accumulation pattern is governed by the surface topography, indicating a strong influence from snow-drift. The standard deviation of snow-layer thicknesses was 40% or more. A conclusion to be drawn from these numbers is that care should be taken when extrapolating absolute numbers from a core site to a regional scale. There is a negative correlation between time resolution and accuracy in accumulation determinations and error bars decrease asymptotically with increasing integration time.
The variability in snow-layer thickness is closely linked to variations in surface topography, which in turn are governed by the rate of ice velocity and variations in ice thickness. Redistribution of snow by drifting is thus significant, at least at the coastal site. Another reason for high variability in snow layering is connected to the occurrence of sastrugi.
At the Camp Victoria drill site the /3 horizon from the 1963 bomb tests indicated an accumulation rate of 61 mm w.e. ECM measurements showed a positive trend in snow accumulation during recent years. At Camp Maudheimvidda the corresponding /3 horizon indicated an annual accumulation rate of 220 mm w.e.
Acknowledgements
We are most grateful to the Swedish Polar Secretariat for providing the logistic support for the Expedition. This work is a contribution to the "European Project for Ice Goring in Antarctica", a joint European Science Foundation/European Commission (EC) scientific programme, funded by the EC under the Environment and Climate Programme (1994–98) contract ENV4-CT95-0074 and by national contributions from Belgium, Denmark, France, Germany, Italy, The Netherlands, Norway, Sweden, Switzerland and the United Kingdom. This is EPICA publication No. 12.
The radar programme was generously supported by Hewlett Packard AB and geodetic equipment was loaned by Geotronics AB.


