





Introduction
Bermudagrass [Cynodon dactylon (L.) Pers.] is a perennial, sod-forming grass that is grown extensively in the U.S. Southeast (Taliaferro et al. Reference Taliaferro, Rouquette, Mislevy, Moser, Burson and Sollenberger2004). This C4 warm-season species is both rhizomatous and stoloniferous, which allows for the formation of dense sod mats capable of persisting with environmental stressors (Baxter et al. Reference Baxter, Anderson, Gates, Rios and Burt2024). Within the Cynodon genus, the tetraploid (2n = 4x = 36) common bermudagrass [Cynodon dactylon (L.) Pers. var. dactylon] is the most economically and ecologically important species for turfgrass and forage production (Harlan and de Wet Reference Harlan and de Wet1969; Singh et al. Reference Singh, Wu, McCurdy, Stewart, Warburton, Baldwin and Dong2023). Originating in Africa and Southeast Asia, bermudagrass was introduced to the United States in Savannah, GA, in 1751 (Hanna and Anderson Reference Hanna and Anderson2008; Taliaferro et al. Reference Taliaferro, Rouquette, Mislevy, Moser, Burson and Sollenberger2004). This forage species spread rapidly across the U.S. Southeast, prompting extensive breeding efforts by the mid-20th century. One of the most notable interspecific forage hybrids released was ‘Tifton 85’, a cross with stargrass (C. dactylon × Cynodon nlemfuensis Vanderyst var. nlemfuensis) (Baxter et al. Reference Baxter, Anderson, Gates, Rios and Burt2024; Burton et al. Reference Burton, Gates and Hill1993; Hanna and Anderson Reference Hanna and Anderson2008). In addition to forage production, other hybrid bermudagrass cultivars crossed with African bermudagrass (Cynodon transvaalensis Burtt Davy) offer great use for athletic fields, golf course tees, fairways, and putting greens (e.g., ‘Tifway’, Tifgreen’, ‘Tifdwarf’, ‘TifSport’, and ‘TifEagle’), which revolutionized the turfgrass market (Baxter et al. Reference Baxter, Anderson, Gates, Rios and Burt2024; Hanna and Anderson Reference Hanna and Anderson2008). Currently, bermudagrass remains a vital source of nutrients for southeastern U.S. beef cattle and dairy farms, providing both grazing forage during the summer and hay for feeding during the winter (Hill et al. Reference Hill, Gates and West2001). In Alabama specifically, bermudagrass forage systems account for a large proportion of the more than US$221 million hay value (USDA-NASS 2026).
Although bermudagrass is an aggressive and vigorous plant, adequate nutrient management, especially nitrogen (N), phosphorus (P), and potassium (K) are necessary to maximize forage yields and quality (Overman et al. Reference Overman, Dagan, Martin and Wilkinson1991). Nitrogen applications increase crude protein and total digestible nutrients and decrease acid and neutral detergent fiber despite weather-dependent variations in bermudagrass yields (Kering et al. Reference Kering, Guretzky, Funderburg and Mosali2011). However, the interplay of forage cutting and N fertilization schedules can influence yield and N use efficiency (Sohoulande et al. Reference Sohoulande, Ma, Qi, Szogi, Stone, Harmel, Martin, Birru and Sima2025). Silveira et al. (Reference Silveira, Vendramini, da Silva, Borges, Ribeirinho, Lacerda, Azenha, Viegas and Aguiar2017) noted that adequate K supply is essential to sustain bermudagrass productivity and persistence, likely due to the contribution of K to improve overall plant health via stress response, primary metabolites, and biochemical/physiological processes (Amtmann et al. Reference Amtmann, Troufflard and Armengaud2008; Baxter et al. Reference Baxter, Anderson, Gates, Rios and Burt2024; Ortel et al. Reference Ortel, Roberts and Rupe2024; Wang et al. Reference Wang, Zheng, Shen and Guo2013).
Weed management is yet another major concern for bermudagrass producers in regard to both forage yields and quality. In Alabama, large crabgrass [Digitaria sanguinalis (L.) Scop.] and southern sandbur (Cenchrus echinatus L.) reduced the proportion of bermudagrass in total harvested forage by 59% and 38%, respectively (Walker et al. Reference Walker, Wehtje and Richburg1998). Forage bermudagrass areas without herbicide applications had no more than 5% ground coverage when competing with D. sanguinalis, broadleaf signalgrass [Urochloa platyphylla (Munro ex C. Wright) R.D. Webster], and yellow nutsedge (Cyperus esculentus L.) in a multiyear study in Texas (Butler et al. Reference Butler, Muir and Ducar2006). Certain palatable weeds like Carolina geranium (Geranium carolinianum L.) and Virginia pepperweed (Lepidium virginicum L.) that have high nutritive value may be considered beneficial when integrated with bermudagrass (Bosworth et al. Reference Bosworth, Hoveland and Buchanan1986; Marten et al. Reference Marten, Sheaffer and Wyse1987). However, many common pasture weeds are unpalatable, competitive with forage crops, and in some cases, poisonous (Nicholson Reference Nicholson2011). Poison hemlock (Conium maculatum L.) infestations in pastures can be toxic to a variety of livestock species, while certain broadleaf weeds (Amaranthus spp., Solanum spp., common lambsquarters [Chenopodium album L.]) can accumulate nitrates toxic to cattle (Puschner et al. Reference Puschner, Peters and Woods2006).
In Alabama forage systems, various grasses (Digitaria spp., Lolium spp., Setaria spp.), sedges (Cyperus spp.), and broadleaf weeds (Amaranthus spp., Solanum spp., Rubus spp.) rank among the most troublesome for growers (Webster Reference Webster2012). Effective control of broadleaf weeds is generally achieved with synthetic auxin herbicides (2,4-D, dicamba, triclopyr, fluroxypyr, etc.). Herbicides that inhibit acetolactate synthase, including halosulfuron, imazapic, metsulfuron, nicosulfuron, and sulfosulfuron, may be incorporated into bermudagrass production for controlling Vasey’s grass (Paspalum urvillei Steud.) and herbicide-resistant Italian ryegrass [Lolium perenne L. ssp. multiflorum (Lam.) Husnot], as well as several broadleaf and sedge weed species (Baxter Reference Baxter2026). Broad-spectrum herbicides like paraquat (photosystem I electron diverter) and glyphosate (5-enolpyruvylshikimate-3-phosphate synthase inhibitor) are effective against many weed species, but only during winter dormancy of established bermudagrass (Baxter Reference Baxter2026; Hurdle et al. Reference Hurdle, Grey, McCullough, Shilling and Belcher2020). During active bermudagrass growth in the summer, forage producers are challenged with controlling a wide range of species in their forage systems with a small number of unique herbicide chemistries.
Simulated studies and modeling show that pest management will become complicated under expected climate change impacts like elevated CO2 (Birthisel et al. Reference Birthisel, Clements and Gallandt2021; Castex et al. Reference Castex, Beniston, Calanca, Fleury and Moreau2018; Ramesh et al. Reference Ramesh, Matloob, Aslam, Florentine and Chauhan2017). Varanasi et al. (Reference Varanasi, Prasad and Jugulam2016) warned that weeds tend to show better survival mechanisms under environmental change due to genetic variation and physiological plasticity. For example, glyphosate efficacy can be significantly influenced by environmental conditions like drought and elevated CO2 (Mollaee et al. Reference Mollaee, Mobli and Chauhan2020; Ziska and Goins Reference Ziska and Goins2006; Ziska et al. Reference Ziska, Teasdale and Bunce1999). Management strategies that heavily utilize herbicides may have reduced effects on aggressive weed species under such conditions (Varanasi et al. Reference Varanasi, Prasad and Jugulam2016), although the effects of elevated CO2 have been inconsistent. For example, both C. esculentus L. and purple nutsedge (Cyperus rotundus L.) exhibited positive growth responses to elevated CO2 (Rogers et al. Reference Rogers, Runion, Prior, Price, Torbert and Gjerstad2008), but the efficacy of both glyphosate and halosulfuron was not impacted by Cyperus spp. growth under high CO2 conditions (Marble et al. Reference Marble, Prior, Runion and Torbert2015). Runion et al. (Reference Runion, Prior, Durstock, Sanz-Sáez and Price2023) reported that CO2 concentration did not impact glyphosate’s expected efficacy on either a susceptible or resistant Palmer amaranth (Amaranthus palmeri S. Watson) ecotype. However, Ziska and Bunce (Reference Ziska and Bunce1993) noted that increased weed germination rates might be expected with rising CO2 concentrations, as was demonstrated in both smooth pigweed (Amaranthus hybridus L.) and C. album. Overall, the specific effects of elevated CO2 on weed physiology and herbicide efficacy require additional research.
As a C4 species, bermudagrass grows well at high temperatures (35 C to 38 C), exhibits relatively high N and water-use efficiency, responds positively to high light flux, and shows a competitive advantage at low CO2 levels (Long Reference Long, Sage and Monson1999; Moser et al. Reference Moser, Burson, Sollenberger, Moser, Burson and Sollenberger2004). At high CO2 levels, C3 plants can benefit more than C4 plants because of a lower CO2-saturation point in C4 pathway (Arp et al. Reference Arp, Drake, Pockman, Curtis and Whigham1993; Rogers et al. Reference Rogers, Runion and Krupa1994; Sage Reference Sage1994; Ward et al. Reference Ward, Tissue, Thomas and Strain1999). A long-term forage system study showed that C4 bahiagrass (Paspalum notatum Flueggé) exhibited increased forage quantity and quality responses to elevated CO2, but fertility management had a more consistent impact on above- and belowground growth (Prior et al. Reference Prior, Runion and Torbert2019, Reference Prior, Runion and Torbert2025; Runion et al. Reference Runion, Prior and Torbert2024). Interestingly, Ziska and Bunce (Reference Ziska and Bunce1997) observed that elevating CO2 above ambient levels increased plant biomass for some C4 weeds such as redroot pigweed (Amaranthus retroflexus L.), barnyardgrass [Echinochloa crus-galli (L.) P. Beauv.], fall panicum (Panicum dichotomiflorum Michx.), and green foxtail [Setaria viridis (L.) P. Beauv.]. Although previous efforts have illustrated that elevated CO2 may have minimal effects on C4 plant growth and net photosynthesis, the authors caution against assuming that C4 plants are incapable of responding to elevated CO2. This could put additional pressure on bermudagrass growers, as the aforementioned C4 weeds are problematic in southeastern U.S. forage systems. Moreover, given the limited number of unique herbicides for forage management and burgeoning herbicide-resistance cases, these implications warrant integrated weed management strategies. Recent studies in Georgia have concluded that combining fertilizer with herbicide programs can improve P. notatum forage stands while reducing smutgrass [Sporobolus indicus (L.) R. Br.] competition, which is less expensive than pasture renovation as an alternative (Shay et al. Reference Shay, Baxter, Basinger, Schwartz and Belcher2022, Reference Shay, Baxter, Basinger, Secor, Burt, Hancock, Schwartz and Belcher2025). However, research concerning environmental change effects on integrated weed management in forages is lacking.
As no previous study has evaluated the combined effects of management practices and elevated CO2 on weed diversity in a bermudagrass forage system, the objective of this study was to evaluate those effects on the interactions between bermudagrass and both C3 and C4 weeds in the final 2 yr of a 7-yr study. We hypothesized that bermudagrass adequately managed with fertilizer and herbicide would produce sufficient biomass to effectively compete with C3 and C4 weeds under elevated CO2 conditions. However, we also predicted that elevated CO2 may have profound effects on different weed species, with C3 weeds possessing competitive ability against bermudagrass, especially when bermudagrass is not well managed.
Materials and Methods
Site Description
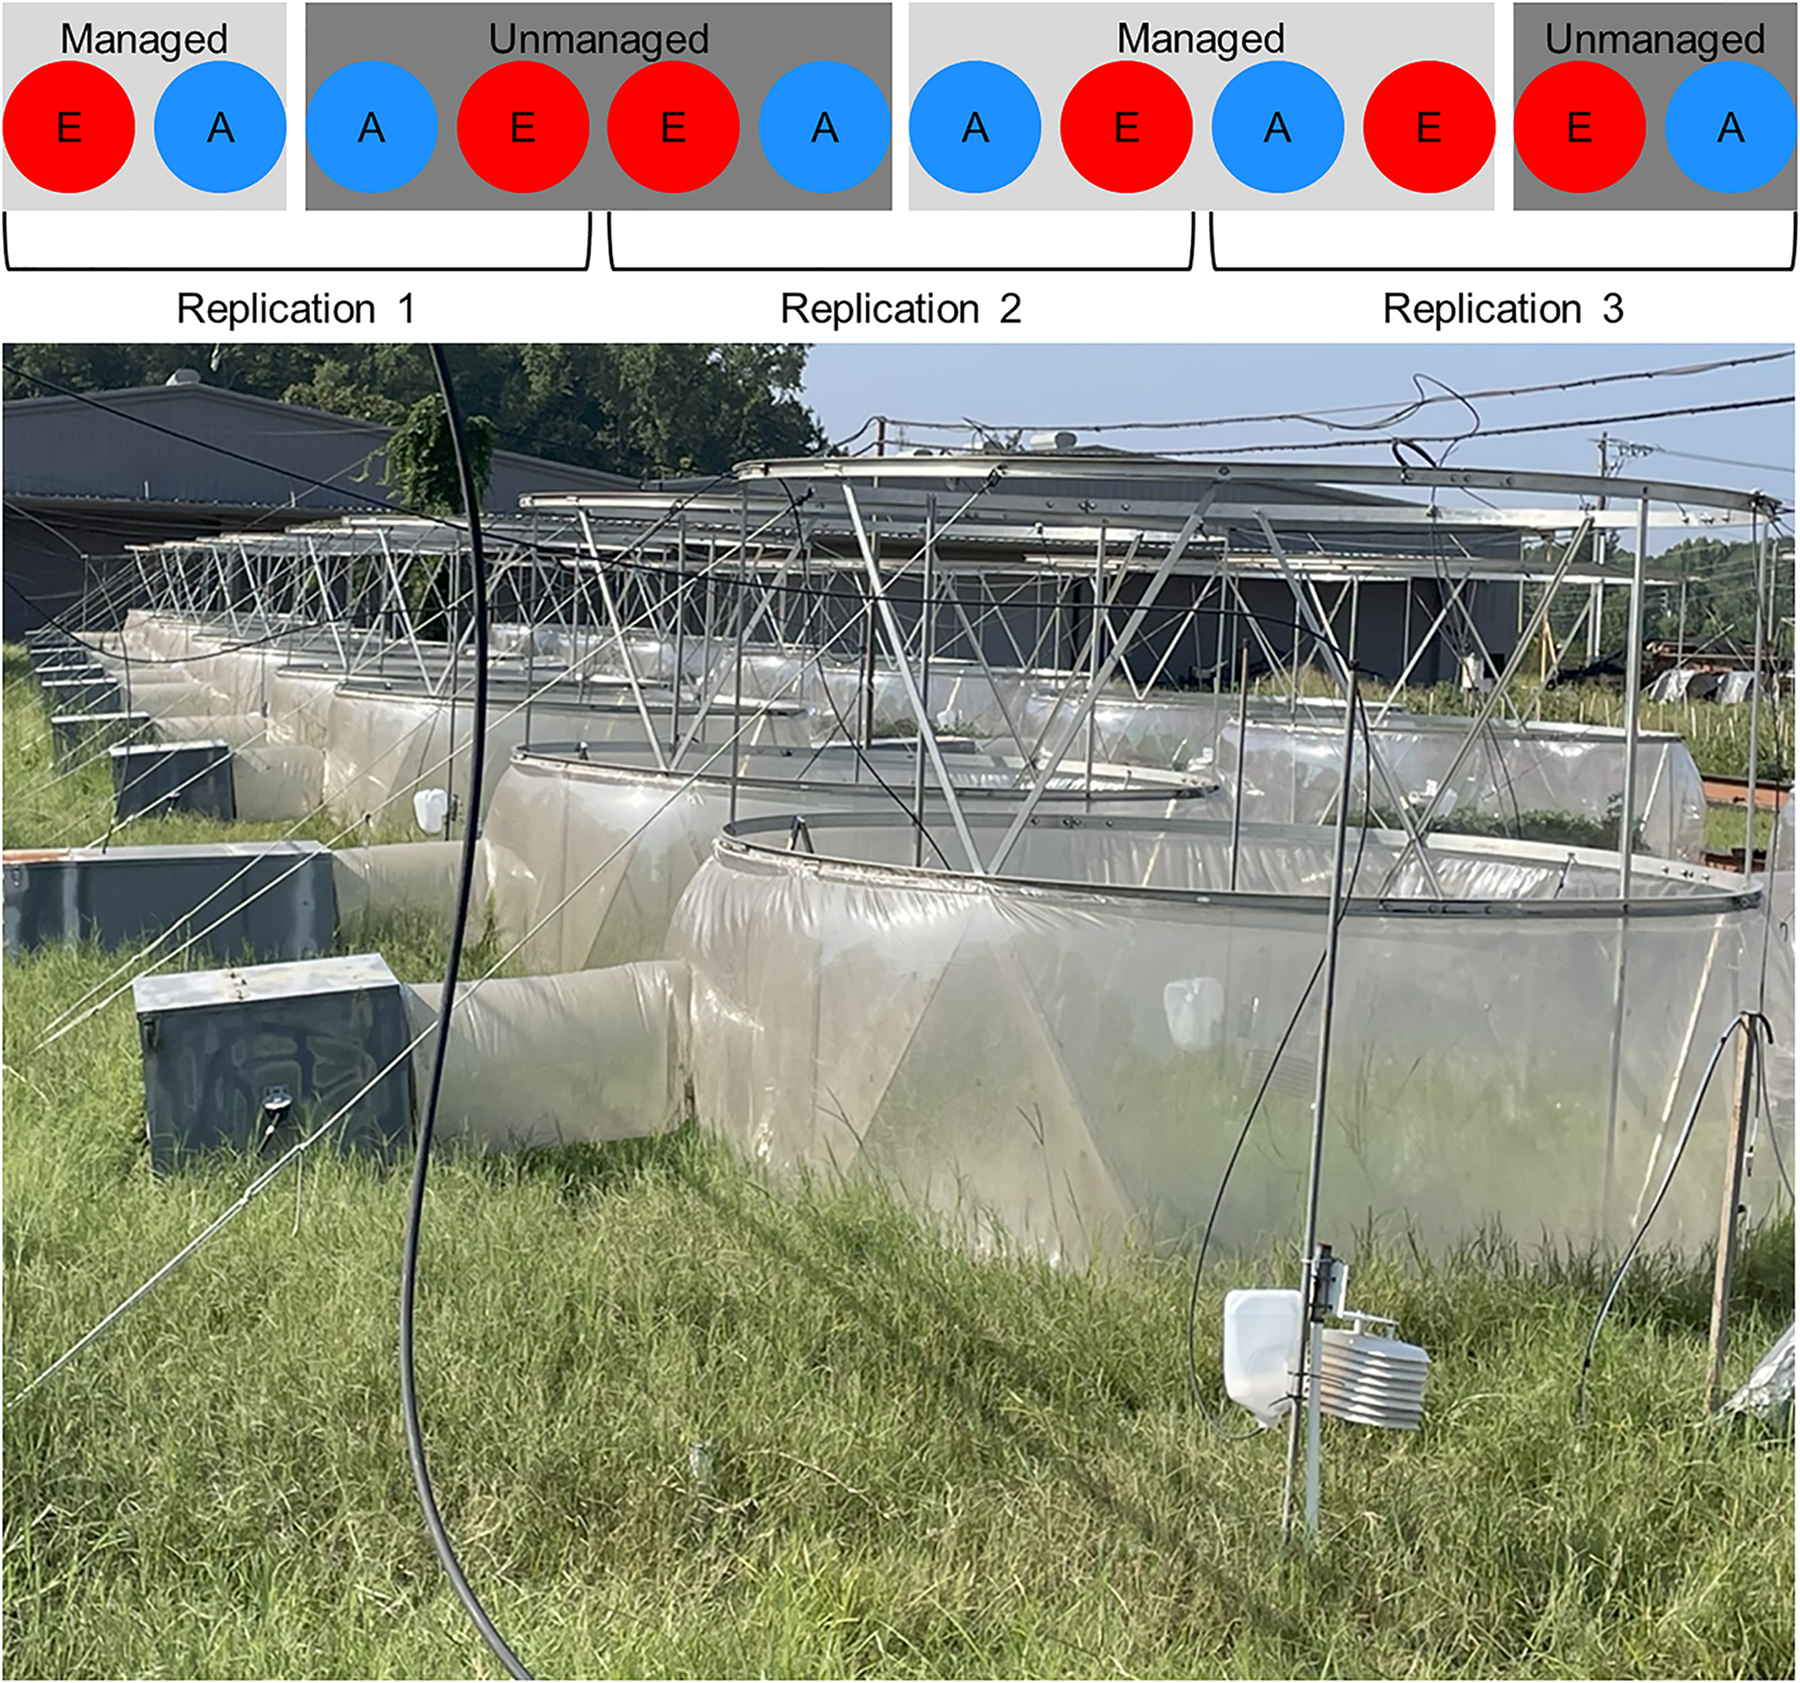
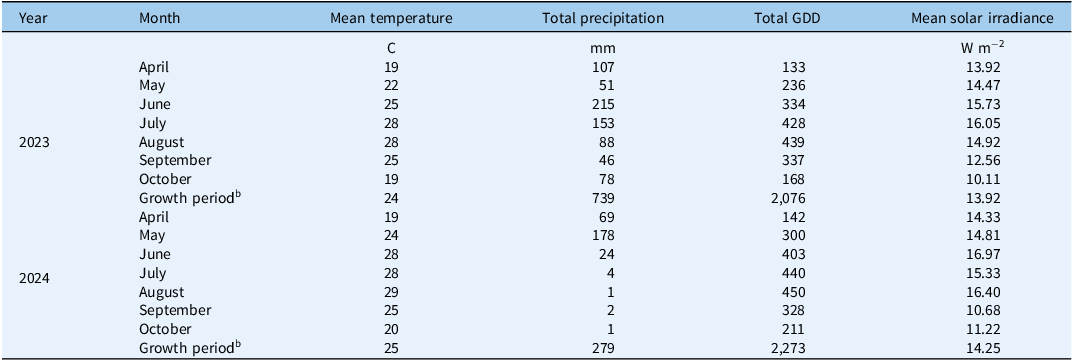
This study was conducted at the USDA-ARS National Soil Dynamics Laboratory in Auburn, AL, from 2018 to 2025. A bermudagrass forage system was established in 2017 in a 7-m-wide by 76-m-long by 2-m-deep outdoor soil bin (32.596993°N, 85.489459°W). The soil bin was filled with a Blanton loamy sand (loamy, siliceous, semiactive, thermic Grossarenic Paleudults) and supported on a tile and gravel drainage basin (Batchelor Reference Batchelor1984). Before the study implementation, the soil was intensively tilled to 30 cm and sprayed with nonselective burndown herbicides (glyphosate and paraquat) several times to exhaust emerging weeds. ‘Russell’ bermudagrass was sprigged in 2017 and allowed to establish for a year. Once grass established, open-top field chambers were installed to deliver elevated CO2 levels in 2018 (Figure 1). These chambers were constructed using an aluminum frame (3.05-m diameter by 2.40-m height) covered with a 0.2-mm-thick clear PVC film panel in accordance with previous methods reported by Rogers et al. (Reference Rogers, Heck and Heagle1983). Due to the low growth stature of plants in this study, only the bottom half of each chamber was covered with the film panel. All plots received only natural rainfall for the duration of the study. Temperature and precipitation were recorded every 10 min by an on-site weather station. Long-term (1991 to 2020) average temperature and annual precipitation recorded at a nearby (approximately 2.3 km) NOAA weather station (USC00010425) were 17.4 C and 1,435 mm, respectively, which were extracted from the NOAA National Centers for Environmental Information U.S. Climate Normals (https://www.ncei.noaa.gov/access/us-climate-normals/). Growing degree days (GDD) were calculated using daily temperature measurements and a base temperature of 15 C (Giolo et al. Reference Giolo, Sallenave, Pornaro, Velasco-Cruz, Macolino and Leinauer2021). Solar irradiance data for Auburn, AL (32.61°N, 85.46°W) were sourced from the National Solar Radiation Data Base (NSRDB), a publicly available meteorological dataset (Sengupta et al. Reference Sengupta, Xie, Lopez, Habte, Maclaurin and Shelby2018). Solar irradiance was recorded every hour as global horizontal ultraviolet (UV) irradiance (280 to 400 nm) at a 4-km spatial resolution. Monthly summaries of these weather parameters during the bermudagrass growth period (April through October) are listed in Table 1.
Top, Experimental design of management practices (managed [highlighted in light gray] and unmanaged [highlighted in dark gray]) and CO2 levels (ambient [A; highlighted in blue] and elevated [E; highlighted in red]). Bottom, Layout of open-top chambers at the USDA National Soil Dynamics Laboratory in Auburn, AL.

Figure 1. Long description
The image contains a diagram and a photo. The diagram at the top shows an experimental design with managed and unmanaged sections, each containing circles labeled with A and E, representing ambient and elevated CO2 levels respectively. The managed sections are highlighted in light gray, while the unmanaged sections are highlighted in dark gray. The photo at the bottom depicts a series of open-top chambers set up in a grassy field. These chambers are cylindrical structures made of transparent material, supported by metal frames. The setup appears to be part of an agricultural research study.
Monthly summaries for temperature, precipitation, growing degree days (GDD), and solar irradiance during the 2023 and 2024 bermudagrass growth periods. a

Table 1. Long description
The table presents monthly summaries for temperature, precipitation, growing degree days (GDD), and solar irradiance during the bermudagrass growth periods in 2023 and 2024. It includes data for each month from April to October, with additional rows for the entire growth period. The table has five columns: Year, Month, Mean temperature in degrees Celsius, Total precipitation in millimeters, Total GDD, and Mean solar irradiance in watts per square meter. Notable trends include higher precipitation and solar irradiance in 2023 compared to 2024, with significant variations in temperature and GDD across the months.
a Temperature and precipitation were recorded from an on-site weather station. GDD for bermudagrass were calculated using 15 C for a base temperature (Giolo et al. Reference Giolo, Sallenave, Pornaro, Velasco-Cruz, Macolino and Leinauer2021). Solar irradiance data were sourced from The National Solar Radiation Data Base (NSRDB) and reported as global horizontal ultraviolet (UV) irradiance (280–400 nm).
b During the bermudagrass growth period each year, means were reported for temperature and solar irradiance, and totals were reported for precipitation and GDD.
Experimental Design
This experiment was laid out in a split-plot design with three replications (Figure 1). The whole-plot factor was management practice (managed and unmanaged). Managed plots received adequate fertilizer and herbicide applications, while unmanaged plots remained devoid of any management practices throughout the duration of the study. For the managed plots, broadcast fertilization (90 kg N, 45kg P2O5, and 67.5 kg K2O ha−1) occurred each April. An additional 90 kg N ha−1 application was made immediately following the first and second cuttings (first week of July and September, respectively). Soil pH was monitored and adjusted as needed with lime according to extension recommendations (Auburn University Soil, Forage & Water Testing Laboratory). Managed plots also received standard rates of herbicide for adequate control of broadleaf and grass weed species. Recommended rates of pendimethalin (N-[1-ethylpropyl]-3,4-dimethyl-2,6-dinitrobenzenamine) (Prowl® H2O, BASF, Research Triangle Park, NC) and MCPP (dimethylamine salt of (+)-(R)-2-[2 methyl-4-chlorophenoxy] propionic acid) + dicamba (dimethylamine salt of dicamba [3,6-dichloro-o-anisic acid]) + 2,4-D (dimethylamine salt of 2,4-dichlorophenoxyacetic acid) (Trimec® Southern, PBI-Gordon Corporation, Shawnee, KS) were applied to managed plots in the spring before bermudagrass broke dormancy, with follow-up applications of Trimec® Southern as needed after each cutting.
The subplot factor for this study was CO2 concentration (ambient or elevated). Within each plot, one open-top chamber delivered fresh air (ambient CO2), while another open-top chamber delivered elevated CO2 (ambient CO2 + 200 mg kg−1 during daylight hours, then ambient CO2 at night). The elevated chambers were continuously monitored to deliver 200 mg kg−1 above the ambient CO2 level in accordance with methods from Mitchell et al. (Reference Mitchell, Runion, Prior, Rogers, Amthor and Henning1995) and Prior et al. (Reference Prior, Runion and Torbert2019).
Data Collection and Processing
As previously stated, the soil used in this study was intensively managed (repeatedly sprayed with herbicides and tilled) to eliminate any potential weed growth before sprigging bermudagrass. To assess the soil seedbank at the beginning of the experiment, 12 soil cores (5-cm diameter; 4 from each replication) were collected in 2017 and kept in cold storage (4 C). The top 30 cm of each core was removed, mixed thoroughly, spread in small plastic trays, and placed in a glass-glazed greenhouse set to 30 C during the day and 25 C during the night. Trays were placed underneath artificial lighting (14-h photoperiod) and watered daily to stimulate weed germination. After 28 d under these conditions, no germination occurred in any soil cores. Further visual examination of each soil sample yielded no seeds or vegetative structures, leading to the assumption that the soil seedbank was fully exhausted at the start of this experiment.
Weed species distribution and bermudagrass growth data were recorded during the 2023 and 2024 growing seasons (i.e., the final 2 yr of the 7-yr study). Each year, total forage biomass was collected at three cuttings (June, August, and October, thus a 2-mo harvest interval) from three randomly placed quadrats (0.25 m2) in each plot. All plant biomass present in the quadrat was uniformly cut at the thatch layer (∼3 cm), then separated into bermudagrass, monocotyledonous weeds (Poaceae, Cyperaceae, and Juncaceae families), and dicotyledonous weeds. Once separated, samples were dried to constant weight in a forced-air oven at 60 C and then weighed to determine dry biomass. At the conclusion of the experiment (April 2025), visual estimations of bermudagrass coverage, weed species and bermudagrass densities, and weed species richness were recorded in each plot to determine the shift in weed diversity since treatment implementation in 2018.
Statistical Analyses
Data were analyzed using R v. 4.5.2 (R Core Team 2025). Preprocessing of data included manual removal of obvious outliers as depicted by box plots for each response metric (data not shown). Graphics were produced in R using packages ggplot2 (Wickham Reference Wickham2016) and tidyverse (Wickham et al. Reference Wickham, Averick, Bryan, Chang, McGowan, François, Grolemund, Hayes, Henry, Hester, Kuhn, Pederson, Miller, Bache and Müller2019). Instead of raw forage yields, the proportions of bermudagrass, monocot, and dicot weed biomass were reported on a percentage basis, and total forage yield was expressed as percent relative yield (Equation 1): ${\rm{\% \;Relative\;forage\;yield}} = {{{{\rm{Yield}}}}\over{{{\rm{Yiel}}{{\rm{d}}_{{\rm{max}}}}}} }\times 100$
where Yield is expressed as the total dry biomass (bermudagrass and any weed species) harvested from each 0.25-m2 quadrat, and Yieldmax is the highest observed yield at each forage cutting. Normalizing yields to a relative scale is a common practice in agricultural research, because this reduces differences in site-specific yield potential due to temporal and environmental factors (Nelson and Anderson Reference Nelson, Anderson, Peck, Cope and Whitney1977; Pearce et al. Reference Pearce, Slaton, Lyons, Bolster, Bruulsema, Grove, Jones, McGrath, Miguez, Nelson, Osmond, Parvej, Pena-Yewtukhiw and Spargo2022).
For harvested biomass, differences among treatment means were analyzed with ANOVA using the aov function in the stats package (R Core Team 2025). Significant differences (α = 0.05) among treatment means were separated with Fisher’s LSD test using the LSD.test function in the agricolae package (de Mendiburu Reference de Mendiburu2023). Several other diversity metrics were analyzed using the same ANOVA and LSD procedures. This included species richness (S; Equation 2) as the sum of all unique species present in a sample, Margalef’s diversity index (D Mg; Equation 3), Shannon’s diversity index (H′; Equation 4), Simpson’s dominance index (λ; Equation 5), and Pielou’s evenness index (J′; Equation 6) (Table 2). Additionally, bermudagrass coverage, weed density, the ratio of weed to bermudagrass plant density, and weed species richness were analyzed at the beginning and conclusion of the experiment to determine the shift in weed competition and species diversity over time.
Weed diversity indices calculated at the α-diversity scale for this experiment.

Table 2. Long description
A table with four rows and five columns comparing different weed diversity indices. The columns are labeled Index, Equation, Measurement, and Reference. The rows list various diversity metrics: Species richness (S), Margalefs diversity index (DMg), Shannons diversity index (H), Simpsons dominance index (λ), and Pielous evenness index (J). Each row includes the equation used to calculate the index, the type of measurement it represents, and the reference to the original study. The table provides a summary of different methods used to assess weed diversity in an experiment.
a S, species richness; D Mg, Margalef’s diversity index; H′, Shannon’s diversity index; λ, Simpson’s dominance index; J′, Pielou’s evenness index.
b S, total number of species (i.e., species richness); N, total number of individuals in the sample; p i , proportion of individuals belonging to the ith species.
Results and Discussion
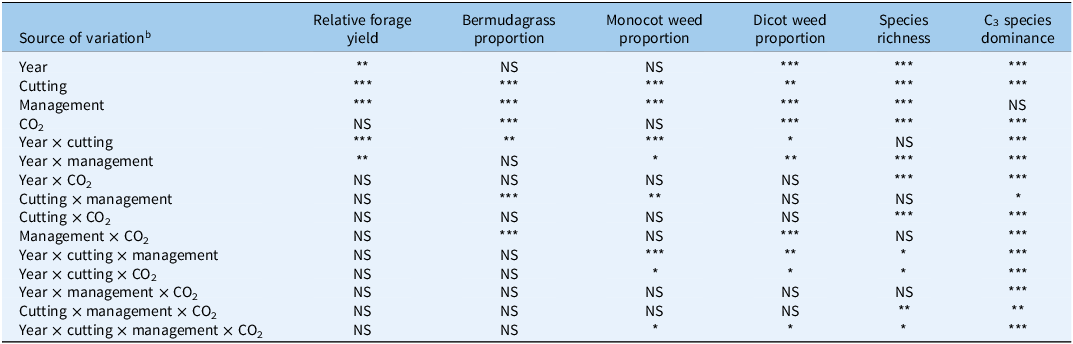
In the final 2 yr of this 7-yr study, mean temperatures and solar radiation were similar throughout the active period of bermudagrass growth (24 C and 13.92 W m−2, respectively, in 2023; 25 C and 14.25 W m−2, respectively, in 2024) (Table 1). Growing degree days were also similar, although slightly higher in 2024 (2,076 in 2023; 2,273 in 2024). Total precipitation accumulated from April through October was much greater in 2023 (739 mm) compared with 2024 (279 mm). The drought during the latter half of the 2024 growing season (8 mm from July through October) caused year and month of cutting to significantly affect bermudagrass growth (relative forage yield and proportions of bermudagrass in harvested biomass) and several weed metrics (monocotyledonous and dicotyledonous weeds; weed species richness; and the proportion of C3 to C4 weed species, i.e., C3 species dominance) (Table 3). Significant effects on these bermudagrass and weed parameters also occurred with our main treatments (management and CO2), as well as several interactions among the listed variables.
Overall ANOVA output for experiment year, month of cutting, management practices, CO2 levels, and their interactions affecting relative forage yield, proportions of bermudagrass, monocotyledonous (monocot) weeds, and dicotyledonous (dicot) weeds (DICOT) in total forage, weed species richness, and the proportion of C3 weed species relative to C4 weed species (i.e., C3 species dominance). a

Table 3. Long description
The table presents ANOVA results for a 7-year study examining the effects of year, cutting month, management practices, CO2 levels, and their interactions on relative forage yield, proportions of bermudagrass, monocotyledonous weeds, dicotyledonous weeds, species richness, and C3 species dominance. The table has 16 rows and 7 columns. The columns are labeled as Source of variation, Relative forage yield, Bermudagrass proportion, Monocot weed proportion, Dicot weed proportion, Species richness, and C3 species dominance. Each row lists a different source of variation and the corresponding significance levels for each measured variable. Notable trends include significant effects of year, cutting, management, and CO2 levels on various parameters, with interactions also playing a role. The data highlights the complex interplay of environmental and management factors on forage and weed dynamics.
a Significance codes: *P < 0.05; **P < 0.01; ***P < 0.001.
b Factor levels include year (2023, 2024), month of cutting (June, August, October), management (managed: annual fertilization and herbicide application; unmanaged: no fertilizers or herbicides), and CO2 (ambient; elevated: 200 mg kg−1 above ambient during daylight).
Bermudagrass Growth
Relative forage yield was significantly influenced by year (P < 0.01), month of cutting (P < 0.001), and management (P < 0.001), but not by CO2 (P > 0.05) (Table 3). Relative forage yield was also significantly affected by the interaction between year by month of cutting (P < 0.001), and year by management (P < 0.01). For the proportional weight of bermudagrass in total harvested biomass, year was insignificant (P > 0.05), whereas month of cutting, management, and CO2 were all significant (P < 0.001). Interactive effects on proportional bermudagrass included year by cutting (P < 0.01), cutting by management (P < 0.001), and management by CO2 (P < 0.001).
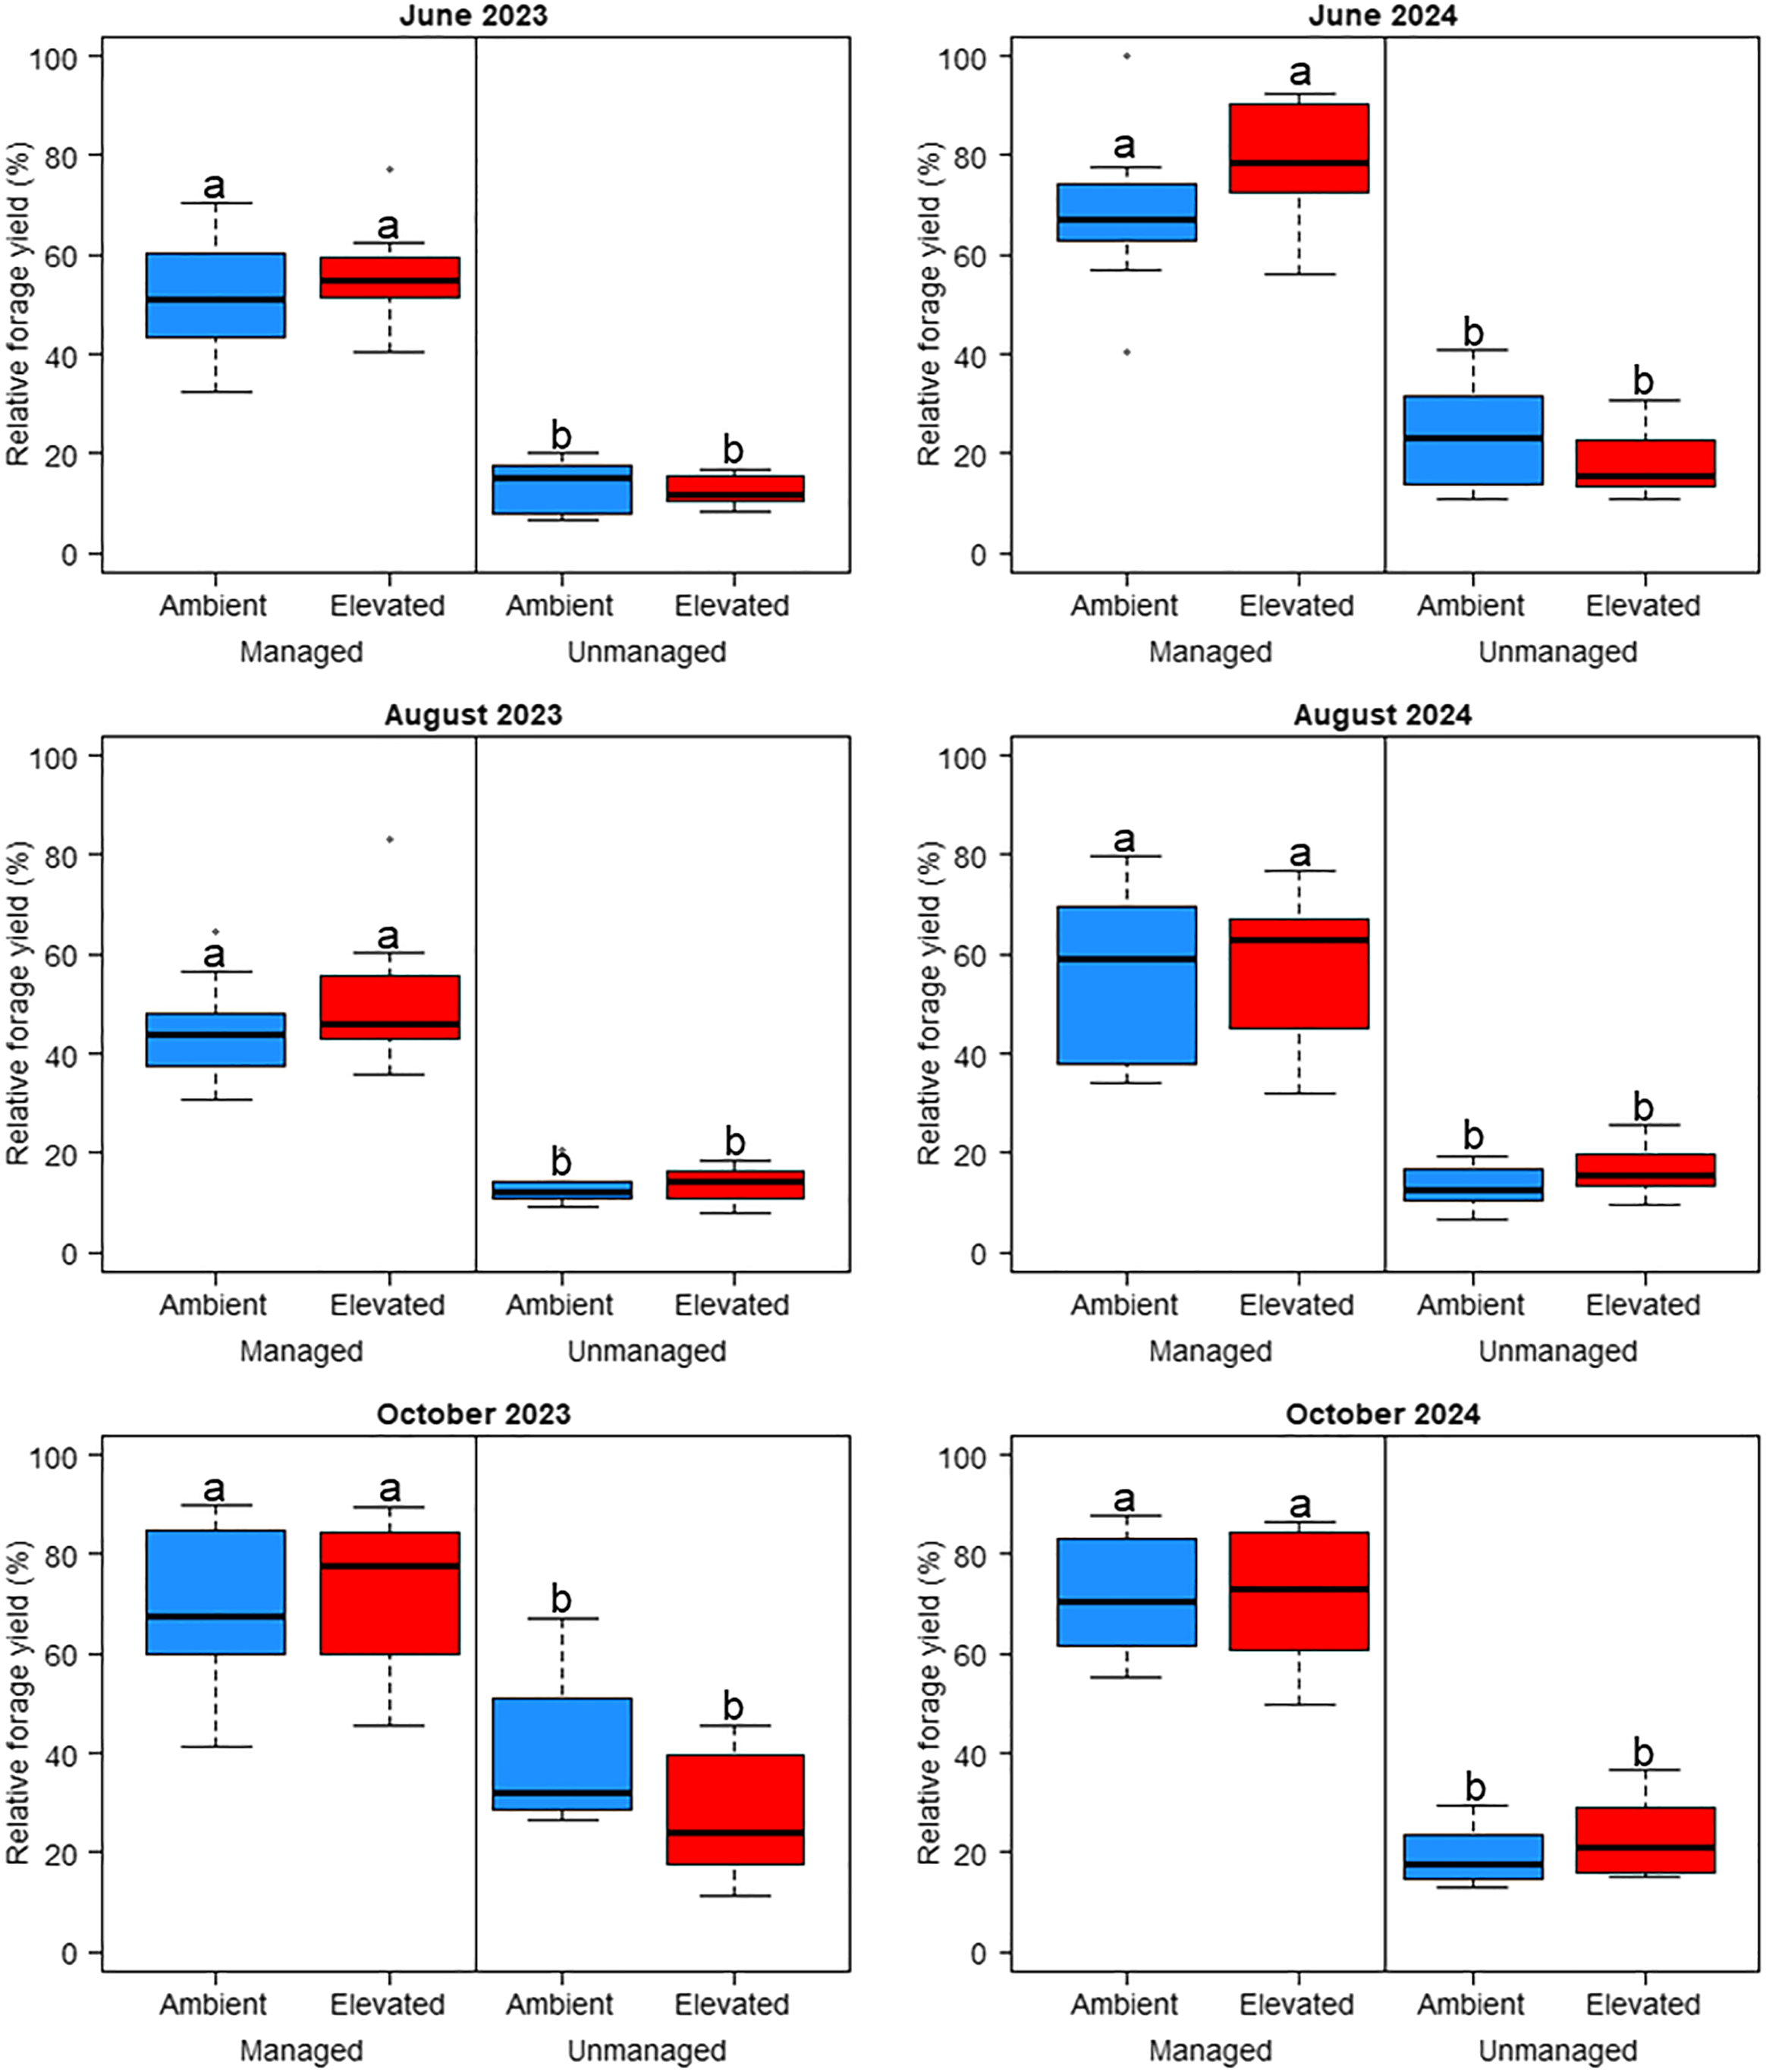
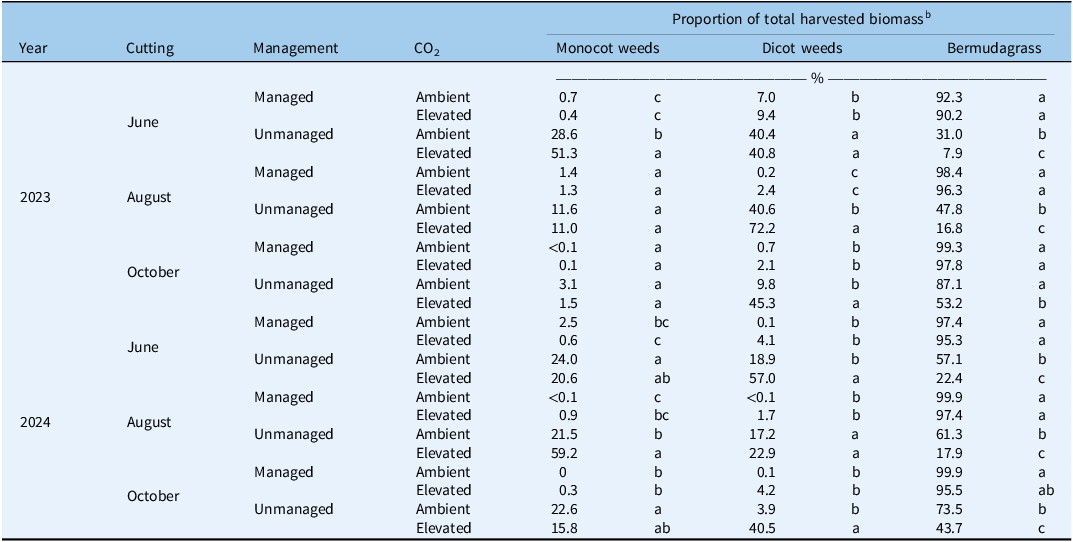
Bermudagrass plots that were managed with adequate fertilizer and herbicide had greater yield (P < 0.05) than unmanaged plots for all six cuttings (Figure 2), which aligns with past research verifying the importance of fertilizer and herbicide management for optimal bermudagrass yields (Barker and Culman, Reference Barker, Culman, Moore, Collins, Nelson and Redfearn2020; Butler and Muir Reference Butler and Muir2006; Butler et al. Reference Butler, Muir and Ducar2006; Haby Reference Haby2002; Hillard et al. Reference Hillard, Haby and Hons1992; Kering et al. Reference Kering, Guretzky, Funderburg and Mosali2011; Smith et al. Reference Smith, Cole and Watson1974). However, managed plots generally had much greater variation in relative forage yield compared with unmanaged plots in several cuttings. For example, in August of each year, relative forage yield ranged from approximately 30% to 80% in managed plots, whereas unmanaged plots ranged from approximately 10% to 25%. Independent of CO2 levels, the herbicide program consisting of pendimethalin, MCPP, dicamba, and 2,4-D used in managed plots provided generally satisfactory weed control at each cutting across both years, with total forage biomass composed of approximately 95% to nearly 100% bermudagrass (Table 4). Pendimethalin provides effective preemergence control of many grass weeds (Rector et al. Reference Rector, Pittman and Flessner2018), while synthetic auxin herbicides provide postemergence control of many broadleaf weeds in forage systems (Butler et al. Reference Butler, Muir and Ducar2006; Meyer and Bovey Reference Meyer and Bovey1991), which was reflected in the managed plots of our study. The proportion of bermudagrass in harvested biomass was greater (P < 0.05) in managed plots compared with unmanaged plots for all harvests except October of both years (the combination of ambient CO2 and no management was statistically the same as the managed plots during both October harvests). Previous studies indicate that optimal pest management and soil fertility are crucial for maximizing forage yield potential (Baxter et al. Reference Baxter, Anderson, Gates, Rios and Burt2024; Fu et al. Reference Fu, Song, Deng, Li, Sun and Fu2025). Our results confirm that bermudagrass yields can significantly benefit from weed and nutrient management.
Relative forage yield influenced by management practices (managed or unmanaged) and CO2 levels (ambient or elevated). Relative yields were calculated as a percentage of maximum forage yield observed during each individual cutting for each year. Different letters denote significant differences among treatment means using Fisher’s LSD test (α = 0.05).

Figure 2. Long description
The image contains six box-and-whisker plots arranged in a 2x3 grid, each representing relative forage yield percentages under different management practices and CO2 levels for June, August, and October 2023 and 2024. The x-axis categorizes the data into managed and unmanaged practices, further divided into ambient and elevated CO2 levels. The y-axis measures the relative forage yield in percentage, ranging from 0 to 100. Each plot shows the distribution of yields with median, quartiles, and outliers. Different letters denote significant differences among treatment means using Fisher’s LSD test. The plots indicate that managed practices generally result in higher forage yields compared to unmanaged practices, and elevated CO2 levels show varying impacts across different months and years. All values are approximated.
Mean proportion of monocotyledonous (monocot) weeds, dicotyledonous (dicot) weeds, and bermudagrass in total harvested biomass influenced by management practices (managed or unmanaged) and CO2 levels (ambient or elevated) across 2 yr (2023 and 2024) and three cuttings per year (June, August, October). a

Table 4. Long description
The table presents data on the mean proportion of monocotyledonous weeds, dicotyledonous weeds, and bermudagrass in total harvested biomass. The data is influenced by management practices (managed or unmanaged) and CO2 levels (ambient or elevated) across the years 2023 and 2024, with three cuttings per year in June, August, and October. The table has 18 rows and 6 columns. The columns are labeled Year, Cutting, Management, CO2, and Proportion of total harvested biomass with sub-columns Monocot weeds, Dicot weeds, and Bermudagrass. The data shows variations in the proportions of different plant types under different conditions. For instance, in June 2023, managed plots with ambient CO2 had 0.7 percent monocot weeds, 7.0 percent dicot weeds, and 92.3 percent bermudagrass. In contrast, unmanaged plots with elevated CO2 had 28.6 percent monocot weeds, 40.4 percent dicot weeds, and 31.0 percent bermudagrass. The table highlights the impact of management practices and CO2 levels on the composition of harvested biomass over time.
a Each row adds up to 100% (bermudagrass + weed biomass), whereas differences in biomass within a group (monocot weeds, dicot weeds, bermudagrass) should be analyzed down each column for each individual cutting.
b Within each cutting, different letters denote significant differences among treatment means using Fisher’s LSD test (α = 0.05).
Overall temporal effects on relative forage yield were expected due to contrasting precipitation between 2023 and 2024 (Table 1). It is well known that weather variability between years can influence bermudagrass growth and yield, and management strategies can also interact with those environmental conditions. For example, in Oklahoma, Kering et al. (Reference Kering, Guretzky, Funderburg and Mosali2011) described that consistent increases in bermudagrass yield in response to N fertilization could be explained by evenly distributed rainfall during the growing season. Periods of high precipitation in the late summer months can extend the growing season further, which can result in greater late-season yields. Kering et al. (Reference Kering, Guretzky, Funderburg and Mosali2011) also cited hot and dry conditions as a reason for negative bermudagrass responses to fertilization. In our study, the lower, unevenly distributed rainfall in 2024 likely contributed to year and month of cutting significantly reducing forage yields.
Beyond temperature and precipitation, other environmental factors can influence forage yield and response to management. Burton et al. (Reference Burton, Hook, Butler and Hellwig1988) found that daylength and solar radiation were the most important factors for bermudagrass yield. They described a sharp decline in forage yields in late summer and fall months that can be attributed to shortened daylengths and reduced solar radiation, even when water, fertilizer, and temperature are adequate. In our experiment, temperature, GDD accumulation, and solar irradiance were similar between years, although all metrics were slightly higher in 2024. Elevated CO2 had no effect on relative forage yield, both overall (Table 3) and at each individual cutting (Figure 2). However, proportional bermudagrass in harvested biomass was affected by CO2 alone and in combination with management practices. As a C4 species, bermudagrass growth due to elevated CO2 should be marginally affected (Ehleringer and Cerling Reference Ehleringer, Cerling, Mooney and Canadell2002), as was the case in our experiment and another long-term forage system study (Prior et al. Reference Prior, Runion and Torbert2019). Changes in the proportion of bermudagrass in harvested biomass might be explained by C3 weed species benefiting from elevated CO2, as an increase in weed biomass would decrease the proportional bermudagrass biomass.
Weed Growth
Varying effects among three weed metrics (monocotyledonous and dicotyledonous weed proportions in harvested biomass, weed species richness) were evident in response to year, month of cutting, management, and CO2 (Table 3). Year and CO2 were significant for dicot weed proportion and species richness (P < 0.001) but not monocot weed proportion. Month of cutting was significant for dicot proportion (P < 0.01), as well as for monocot proportion and species richness (P < 0.001). Management was significant for all three metrics (P < 0.001). Significant interactive effects (P < 0.05) for all three metrics included year by management, year by cutting by management, year by cutting by CO2, and year by cutting by management by CO2.
Compared with managed plots, unmanaged plots showed significantly lower proportions of bermudagrass, with monocot and dicot weed species dominating the total harvested biomass for most cuttings (Table 4). Furthermore, unmanaged plots exposed to elevated CO2 tended to exhibit a significantly greater proportion of weeds compared with plots with ambient CO2. This result likely occurred as C3 species (which comprised the majority of dicot weeds in this study) took advantage of elevated CO2 and subsequently increased biomass growth (Ehleringer and Cerling Reference Ehleringer, Cerling, Mooney and Canadell2002). Ziska et al. (Reference Ziska, Faulkner and Lydon2004) previously documented this in Canada thistle [Cirsium arvense (L.) Scop.], which is a very problematic perennial C3 weed in forage systems. They observed CO2-induced increases in root biomass that can make C. arvense and other perennial weeds that reproduce asexually from belowground organs more difficult to control under elevated CO2 conditions (Ziska et al. Reference Ziska, Faulkner and Lydon2004). These results indicate that a lack of fertilizer and herbicide management in bermudagrass forage systems will not only give rise to greater weed pressure, but that weed pressure can be further exacerbated under changing environmental conditions like elevated CO2. Such findings are especially pertinent for bermudagrass forage systems in the U.S. Southeast, as weed-infested hay can reduce profitability (Rhodes and Phillips Reference Rhodes and Phillips2012).
C 3 and C 4 Weed Ecology
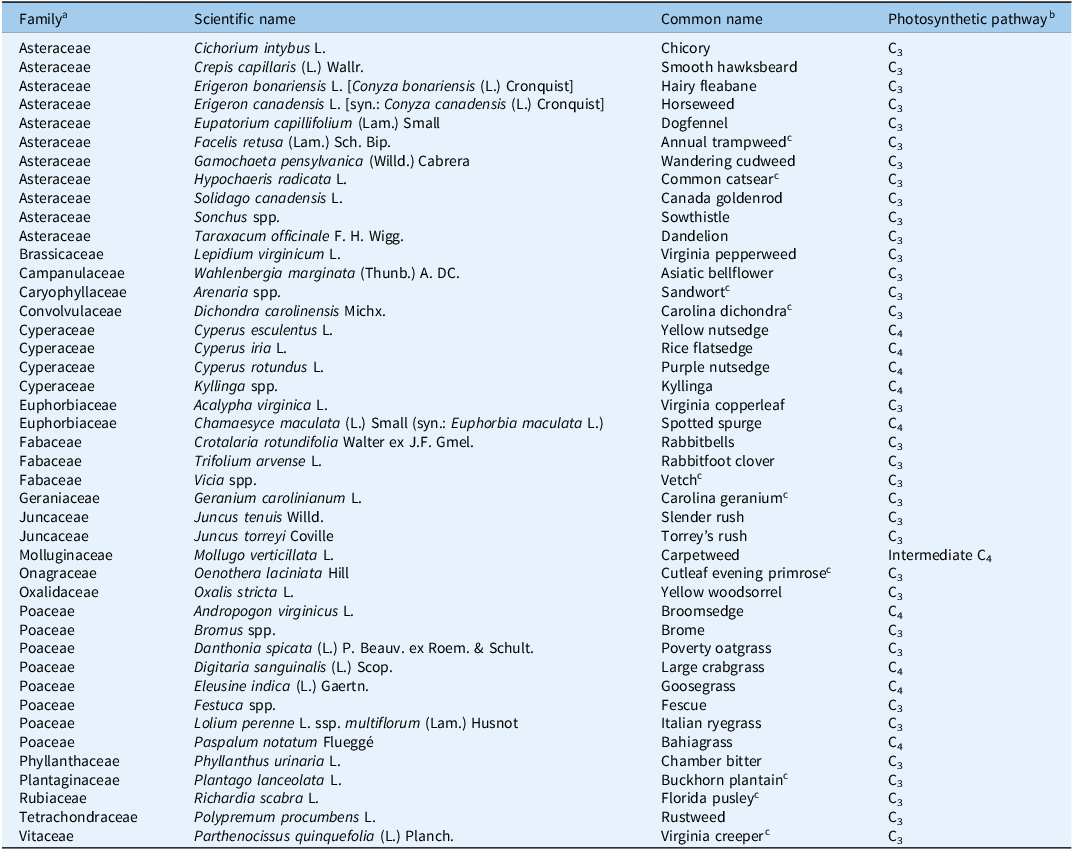
Throughout this study, we observed a total of 43 unique weed species, of which 29 were dicotyledonous species and 14 were monocotyledonous (Table 5). Regardless of management and CO2 treatments, Asiatic bellflower [Wahlenbergia marginata (Thunb.) A. DC.], Kyllinga spp., and Festuca spp. were dominant weeds observed at each cutting during both years. A majority of the dicot species (27 out of 29) utilize the C3 photosynthetic pathway. For the other two dicot weeds, spotted spurge [Chamaesyce maculata (L.) Small; syn.: Euphorbia maculata L.] uses the C4 pathway, while carpetweed (Mollugo verticillata L.) is an intermediate C4 plant (Kennedy and Laetsch Reference Kennedy and Laetsch1974). Although dicot weeds certainly infest forage systems in the Southeast, the lack of monocot species in our experiment was surprising, as several grasses and sedges are common in Alabama production fields. Dicot weeds are often more specialized for anemochory (wind dispersal) than monocot weeds. Because physical barriers isolated the chambers to about 1-m height, dicot weeds might have been favored more than grasses and sedges in the experimental plot. Nonetheless, the distribution of C3 and C4 monocot species was much more even. There were six C3 monocot weeds identified in this experiment, including two species from the Juncaceae family and four cool-season grasses. A total of eight C4 monocot weeds were identified, including four species from the Cyperaceae family and four warm-season grasses.
Composite list of weed species identified in this experiment and their corresponding photosynthetic pathways.

Table 5. Long description
The table presents a composite list of weed species identified in an experiment, detailing their family, scientific name, common name, and photosynthetic pathway. It includes 43 unique weed species, categorized into 29 dicotyledonous and 14 monocotyledonous species. The table has 43 rows and 4 columns, with headers for Family, Scientific name, Common name, and Photosynthetic pathway. Notable species include Asiatic bellflower, Kyllinga spp., and Festuca spp., which were dominant weeds. The majority of dicot species use the C3 photosynthetic pathway, while a few use C4 or intermediate C4 pathways. The distribution of C3 and C4 monocot species is more even, with six C3 monocot weeds and eight C4 monocot weeds identified.
a Throughout this study, monocotyledonous weeds included species from the Cyperaceae, Juncaceae, and Poaceae families, whereas all other weeds were classified as dicotyledonous.
b References: Elmore and Paul (Reference Elmore and Paul1983); Sage (Reference Sage2017).
c Only observed during the final data collection at the conclusion of the experiment (April 22, 2025).
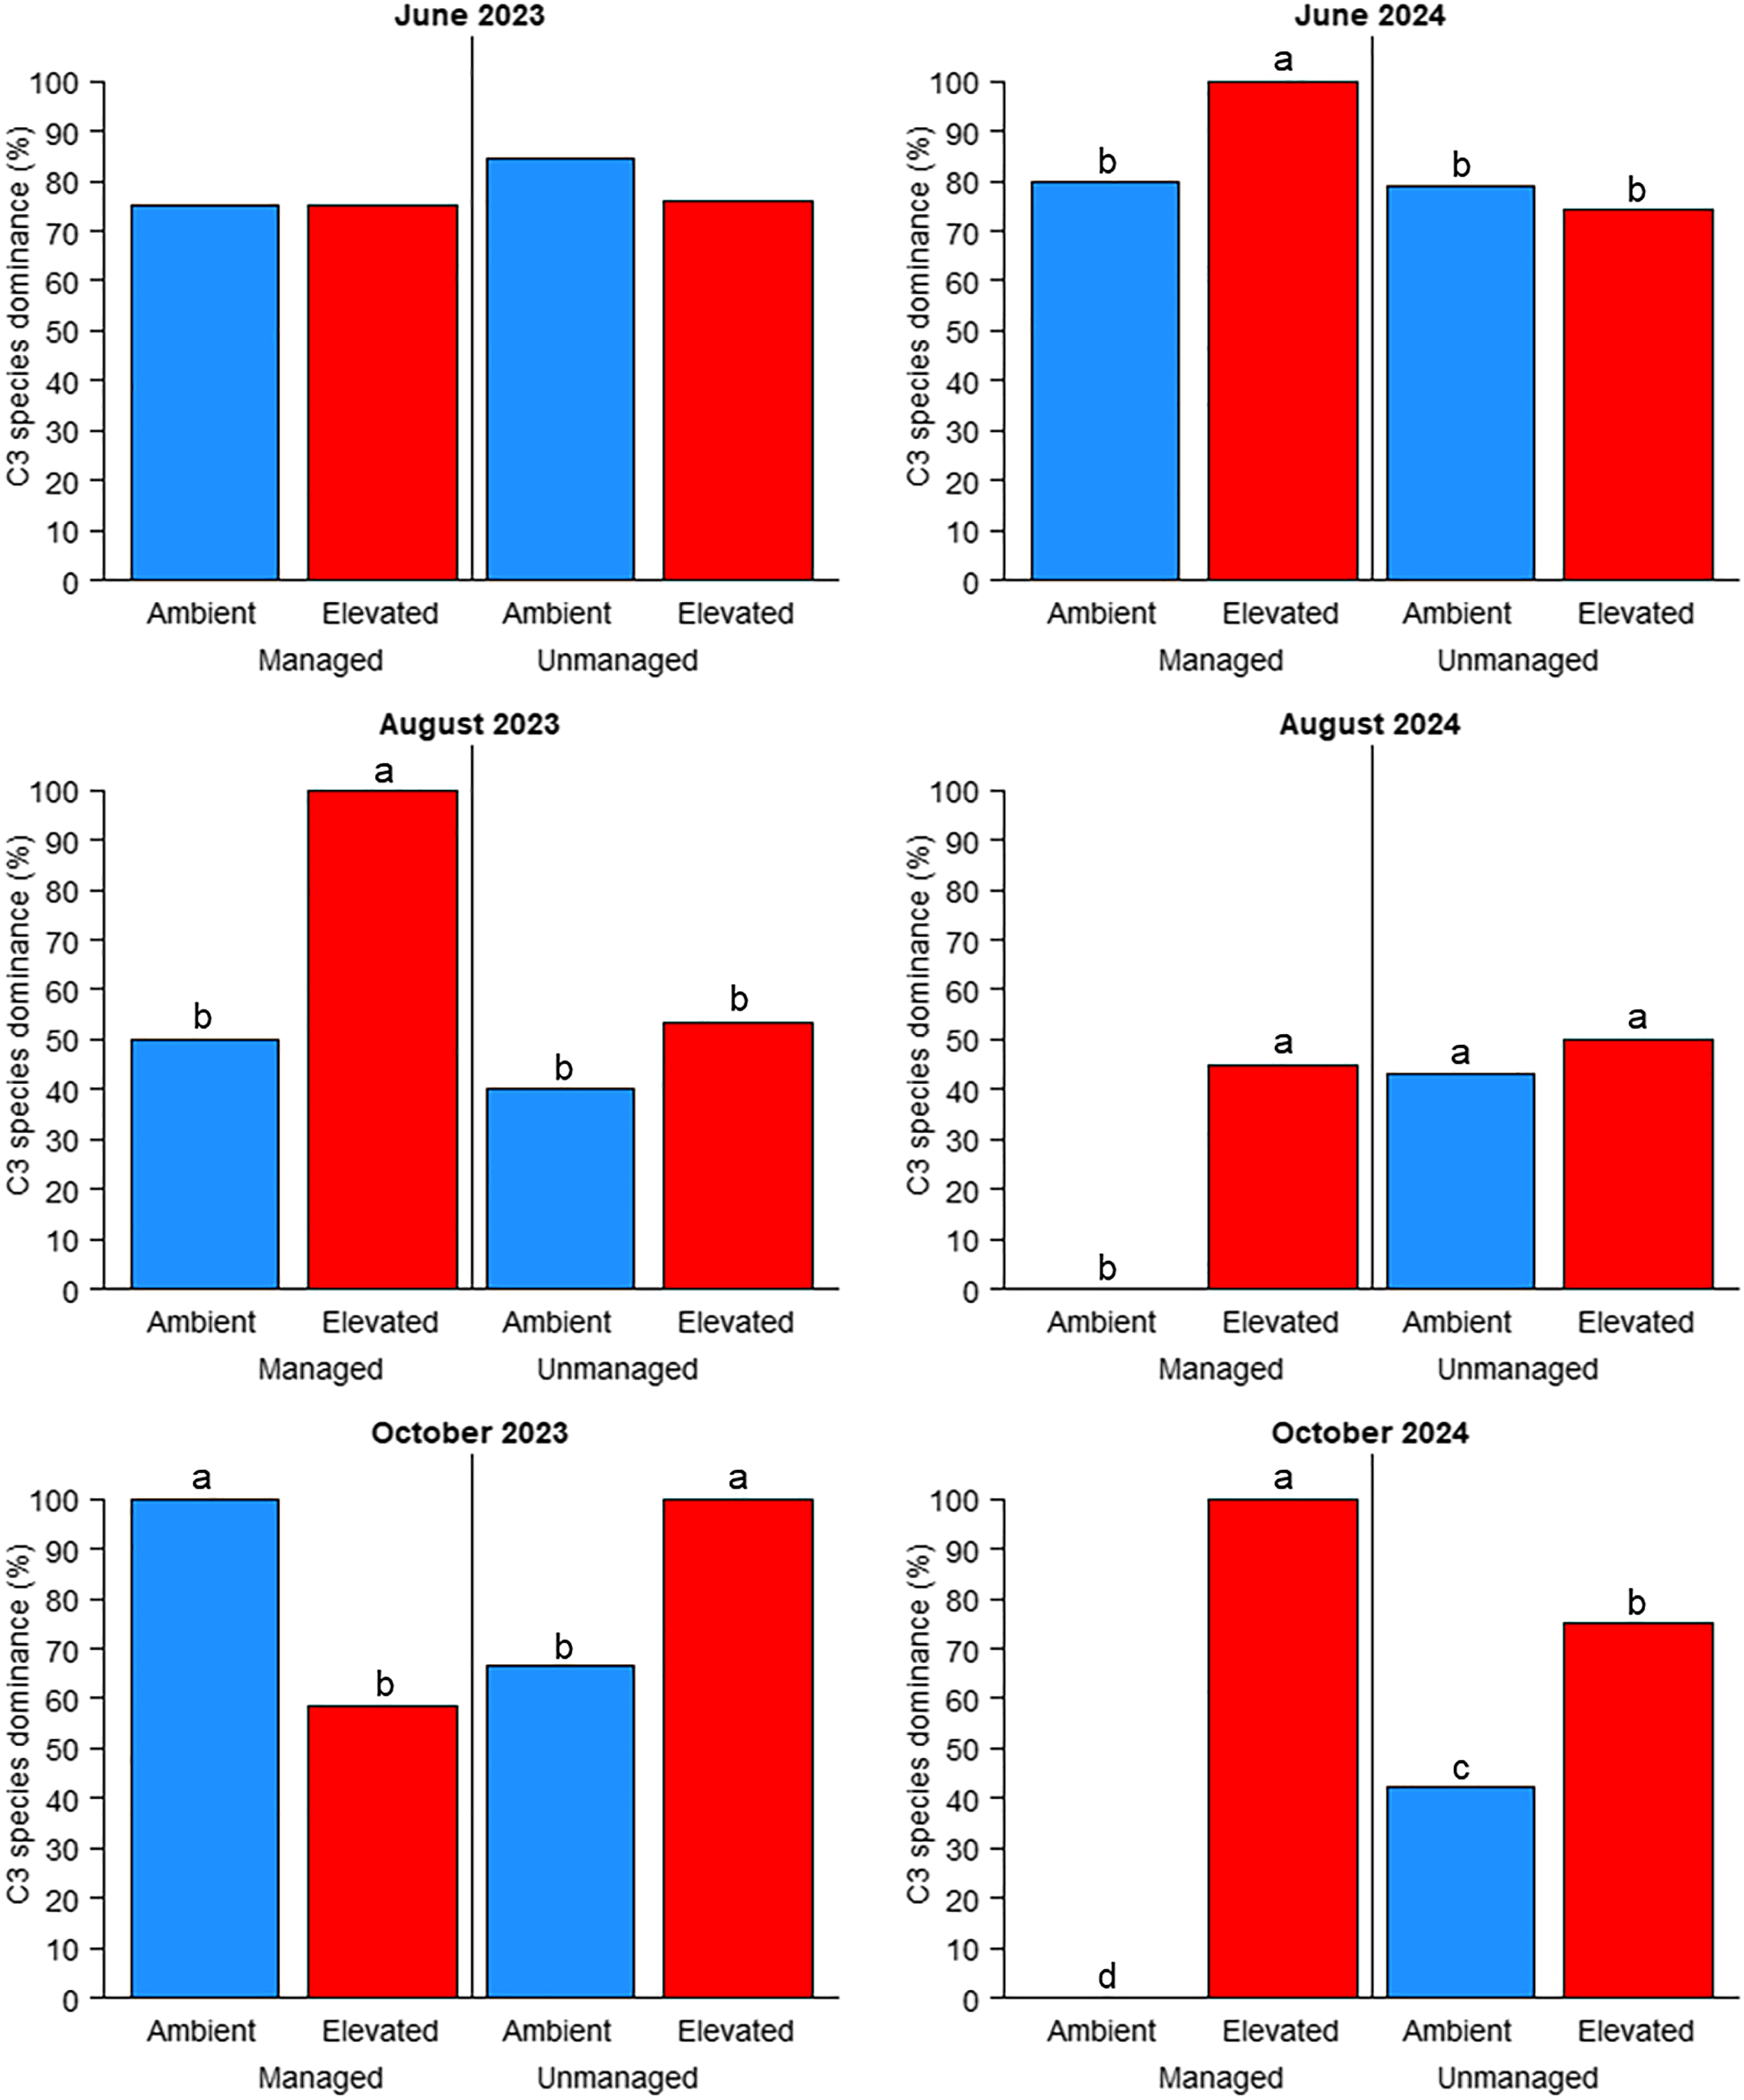
Overall, C3 species dominance was influenced the most by combinations of experimental factors. Management was the only insignificant factor (P > 0.05), while cutting by management (P < 0.05), cutting by management by CO2 (P < 0.01), and all other factor combinations (P < 0.001) were significant (Table 3). C3 species dominance was significantly affected (P < 0.05) by management and CO2 in all but one cutting (June 2023); however, this pattern was inconsistent (Figure 3). In August 2023, C3 species dominance was greatest (100%) in managed plots under elevated CO2 and was significantly greater than in any other treatment combinations. At the following harvest (October 2023), C3 dominance was 100% in managed plots under ambient CO2 and unmanaged plots under elevated CO2, and was significantly greater than in the other two treatment combinations. The June 2024 harvest resulted in the same pattern that was observed in August 2023. For the August 2024 harvest, C3 dominance was 0% in managed plots under ambient CO2, with all other treatment combinations being significantly greater (approximately 45 to 50%). For the final harvest in our experiment (October 2024), C3 dominance was significantly different for all four-factor combinations: 100% for managed plots under elevated CO2; 75% for unmanaged plots under elevated CO2; 45% for unmanaged plots under ambient CO2; and 0% for managed plots under ambient CO2.
The mean proportion of C3 weed species to C4 weed species influenced by management practices (managed or unmanaged) and CO2 levels (ambient or elevated). Different letters denote significant differences among treatment means using Fisher’s LSD test (α = 0.05). Absence of letters indicates no significant differences between treatment means.

Figure 3. Long description
The bar graph compares the mean proportion of C3 weed species to C4 weed species under different conditions of management practices (managed or unmanaged) and CO2 levels (ambient or elevated). The graph is divided into four sections representing different time periods: June 2023, June 2024, August 2023, August 2024, October 2023, and October 2024. Each section contains four vertical bars representing the different treatment combinations. The x-axis labels the treatment combinations: Ambient Managed, Elevated Managed, Ambient Unmanaged, and Elevated Unmanaged. The y-axis represents the percentage of C3 species dominance. Different letters above the bars denote significant differences among treatment means using Fisher’s LSD test (alpha equals 0.05). Absence of letters indicates no significant differences between treatment means. The color scheme uses blue for ambient conditions and red for elevated conditions. All values are approximated.
As C4 plants generally respond less to elevated CO2 than C3 plants, monocot weed proportions, which consisted of more C4 species than dicots, were not affected by elevated CO2. As described previously, yearly and monthly weather variations likely explain the influence of year and month of cutting on these weed measurements. Different weed species are known to respond physiologically to changes in temperature and GDD (Nussbaum et al. Reference Nussbaum, Wiese, Crutchfield, Chenault and Lavake1985; Shrestha and Swanton Reference Shrestha and Swanton2007). Also, higher temperatures are more advantageous for C4 plant growth (Long 1983), while water-use efficiency is greater in C4 plants compared with C3 plants (Ghannoum et al. Reference Ghannoum, Evans, von Caemmerer, Raghavendra and Sage2010). Therefore, slightly higher temperature, solar irradiance, and GDD accumulation in 2024, combined with drastically less rain than 2023, likely explain the differences among weed metrics in our study, especially in regard to photosynthetic pathways.
In three of the six cuttings (August 2023, June 2024, and October 2024), C3 species dominance was highest under elevated CO2 (Figure 3). These occurred in plots managed with fertilizer and herbicide, which (as previously mentioned) had significantly lower proportions of weeds in harvested biomass compared with unmanaged plots (Table 4). Therefore, while overall weed pressure was low in managed plots, elevated CO2 caused significantly greater C3 species dominance in half of the cuttings (C3:C4 ratio was >3:1). Although this disparity between C3 and C4 species is interesting to note, because the literature predicts a shift to C3 weed species with long-term elevation in CO2 levels (Patterson Reference Patterson1995), various C3 species were observed in all plots regardless of management or CO2 level. An example of this was W. marginata, a C3 dicot weed that was consistently found in all plots regardless of management and CO2. Therefore, measuring the proportion of C3 to C4 species dominance could have been skewed due to W. marginata and several other C3 weeds seemingly unaffected by management or CO2 levels, at least across 2 yr of observations. Long-term (10+ yr) effects on weed ecology should be considered to better elucidate these findings.
Temporal Shifts in Bermudagrass Growth and Weed Diversity
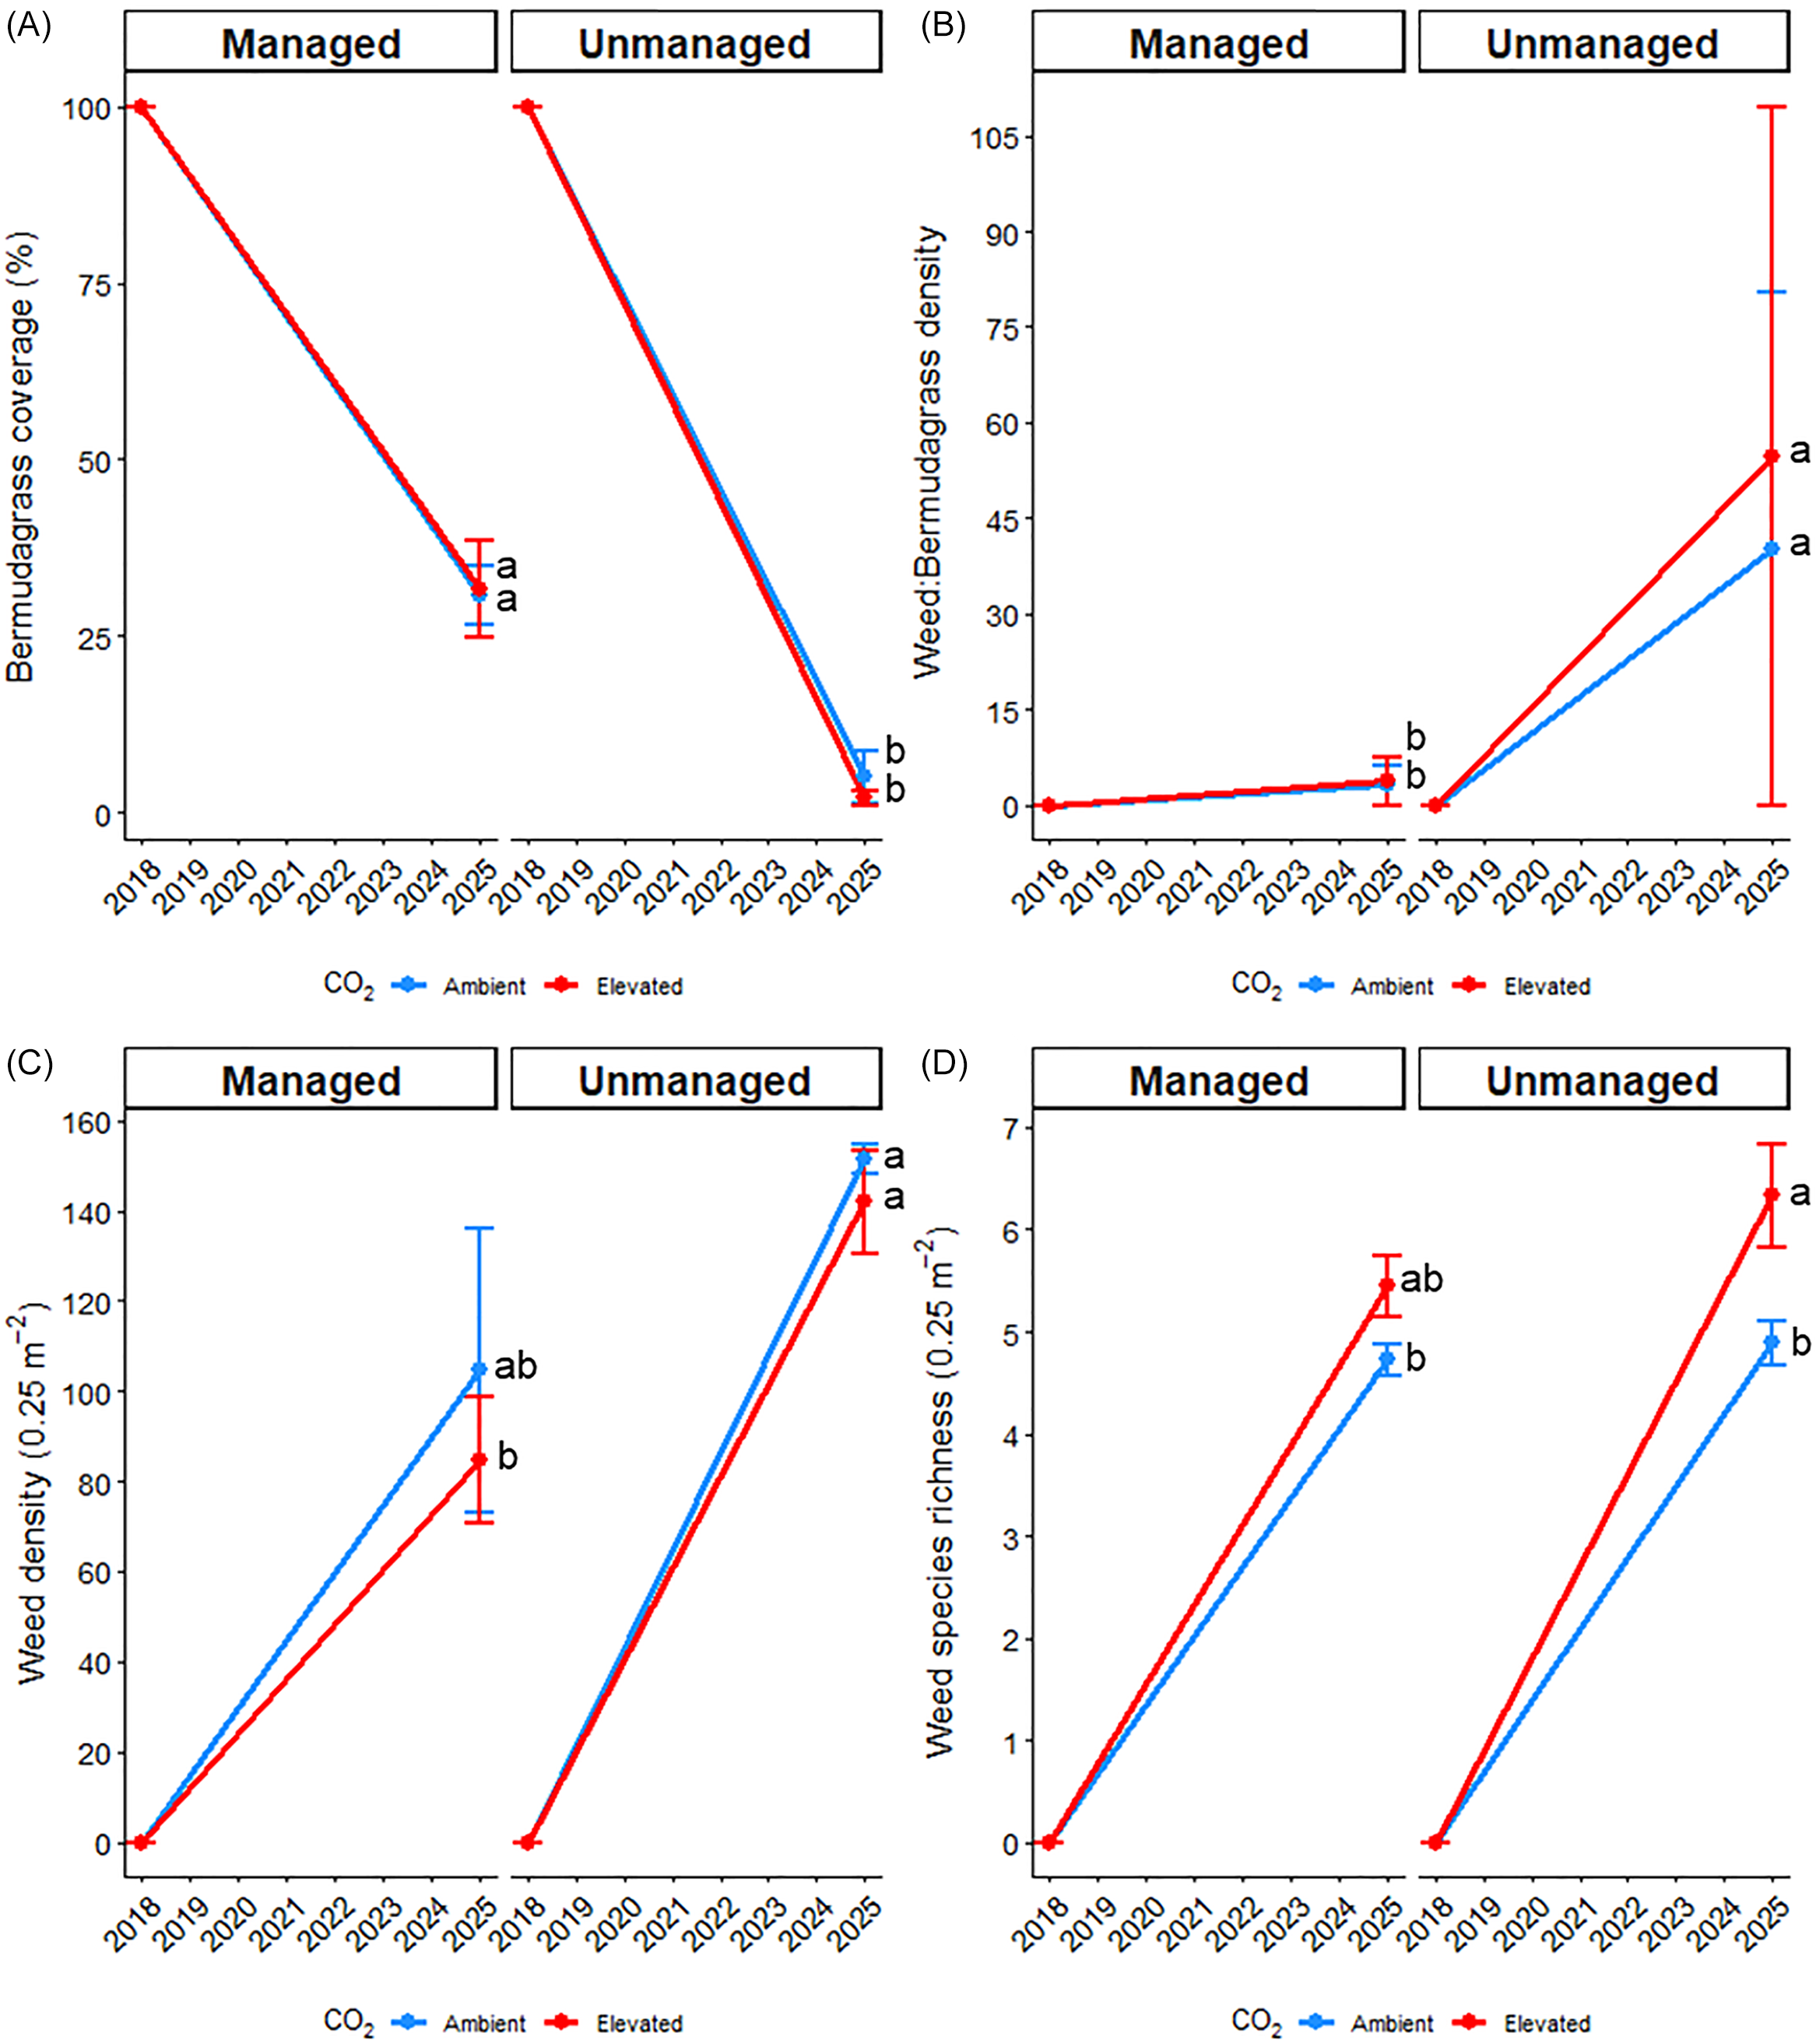
When the experiment was initiated in 2018, bermudagrass coverage was 100% in all plots, and no weeds were present. After 7 yr of treatment history (management and CO2), bermudagrass ground coverage dropped to 31% in managed plots and 3% in unmanaged plots (Figure 4). Although this 69% reduction in managed plots is surprising, bermudagrass coverage estimates were recorded at the conclusion of this experiment on April 22, 2025, which (if the experiment were to continue) would be immediately before spring herbicide applications. Although CO2 was not influential, bermudagrass coverage was greater (P < 0.05) in managed plots, which highlights the importance of proper weed and nutrient management for bermudagrass production. The ratio of weedy plants to bermudagrass plants was also not affected by CO2, but it was greater (P < 0.05) in unmanaged plots (40:1 to 55:1) compared with managed plots (3:1). Likewise, total weed densities were greater (P < 0.05) in unmanaged plots (142 to 152 plants m−2) than managed plots (85 to 105 plants m−2) yet unaffected by CO2. Unlike the other three metrics, weed species richness was greater (P < 0.05) under elevated CO2 (5.4 to 6.3) compared with ambient CO2 (4.8), but management was not influential.
Influence of management practices (managed or unmanaged) and CO2 levels (ambient or elevated) on visual bermudagrass coverage (A), the ratio of weed to bermudagrass individuals (B), total weed density 0.25 m−2 (C), and weed species richness 0.25 m−2 (D) throughout the entire study duration. Initial data were determined by visual observations and analysis of the germinable weed seedbank in 2018. Final data were recorded on April 22, 2025. For the final data, different letters denote significant differences among treatment means using Fisher’s LSD test (α = 0.05).

Figure 4. Long description
The image contains four line graphs labeled A, B, C, and D, each comparing data under managed and unmanaged conditions with ambient and elevated CO2 levels. Graph A shows bermudagrass coverage percentage from 2018 to 2025, with a significant decline in both managed and unmanaged conditions under elevated CO2. Graph B illustrates the weed to bermudagrass ratio, indicating an increase over time, particularly under elevated CO2. Graph C depicts weed density per 0.25 square meters, showing a rise in both conditions with elevated CO2 leading to higher densities. Graph D presents weed species richness per 0.25 square meters, also increasing over time with elevated CO2 resulting in greater richness. Different letters denote significant differences among treatment means using Fisher’s LSD test at alpha equals 0.05.
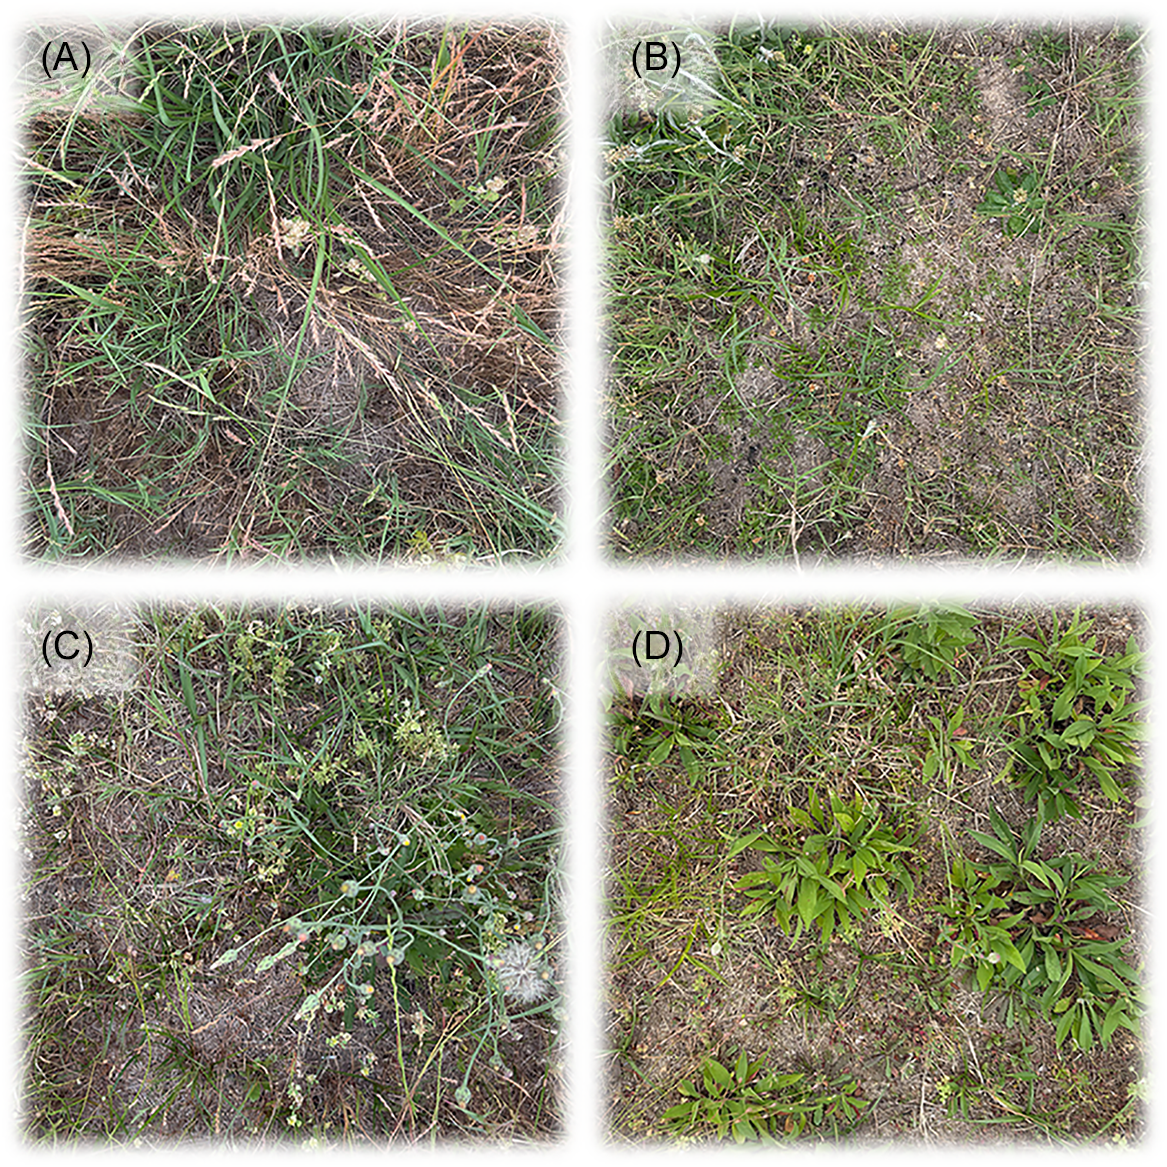
Similar to the 2023 and 2024 growing seasons, there is convincing evidence that long-term exposure (7 yr) to elevated CO2 can give rise to not only a greater proportion of weeds in harvested bermudagrass biomass but also increased weed species richness. This is exceptionally critical for forage producers, because herbicide options are already relatively limited, so a broader spectrum of weeds would need to be controlled in this scenario. Such a case was visually apparent during this final data collection, in which several diverse weed species were found in elevated CO2 plots, while consistently fewer species were observed in ambient CO2 plots (Figure 5). Among the dominant weeds at this specific time were Festuca spp. and L. perenne ssp. multiflorum (Table 6). Those species would not be controlled by the current herbicide program for the managed plots, as MCPP, dicamba, and 2,4-D have little to no efficacy on grasses, while pendimethalin will not control emerged weeds. The selective control of grass weeds in bermudagrass forage systems is difficult, as there is often a trade-off between good weed control and minimal bermudagrass injury (Peters et al. Reference Peters, Moomaw and Martin1989; Smith et al. Reference Smith, Cole and Watson1974). Therefore, the implications of elevated CO2 on increased weed species richness and competitiveness with bermudagrass should not be underestimated.
Visual representation of final weed densities and bermudagrass coverage after 7 yr of growth influenced by management + ambient CO2 (A), no management + ambient CO2 (B), management + elevated CO2 (C), and no management + elevated CO2 (D). Each square is 0.25 m2. Photos taken April 22, 2025.

Figure 5. Long description
The image consists of four separate photos labeled A, B, C, and D, each showing a 0.25 square meter area of bermudagrass and weed growth. Photo A shows the result of management with ambient CO2, featuring sparse weed growth and dense bermudagrass. Photo B depicts no management with ambient CO2, showing more weed growth and less bermudagrass coverage. Photo C illustrates management with elevated CO2, with moderate weed growth and dense bermudagrass. Photo D shows no management with elevated CO2, featuring significant weed growth and less bermudagrass coverage. The photos were taken on April 22, 2025.
Dominant weed species (based on plant density) observed in each treatment combination at the conclusion of the experiment (April 22, 2025).

Table 6. Long description
The table presents the dominant weed species identified by plant density in both managed and unmanaged plots under ambient and elevated CO2 conditions. It consists of five rows and four columns. The columns are labeled as Ambient CO2, Elevated CO2 for both Managed and Unmanaged categories. The rows are ranked from 1 to 5. In the managed plots under ambient CO2, the dominant species are Festuca spp., L. perenne ssp. multiflorum, G. pensylvanica, T. arvense, and H. radicata. Under elevated CO2, the dominant species are Festuca spp., L. perenne ssp. multiflorum, Arenaria spp., W. marginata, and O. stricta. In the unmanaged plots under ambient CO2, the dominant species are Festuca spp., P. notatum, S. canadensis, H. radicata, and C. esculentus. Under elevated CO2, the dominant species are S. canadensis, Festuca spp., T. arvense, C. esculentus, and O. stricta.
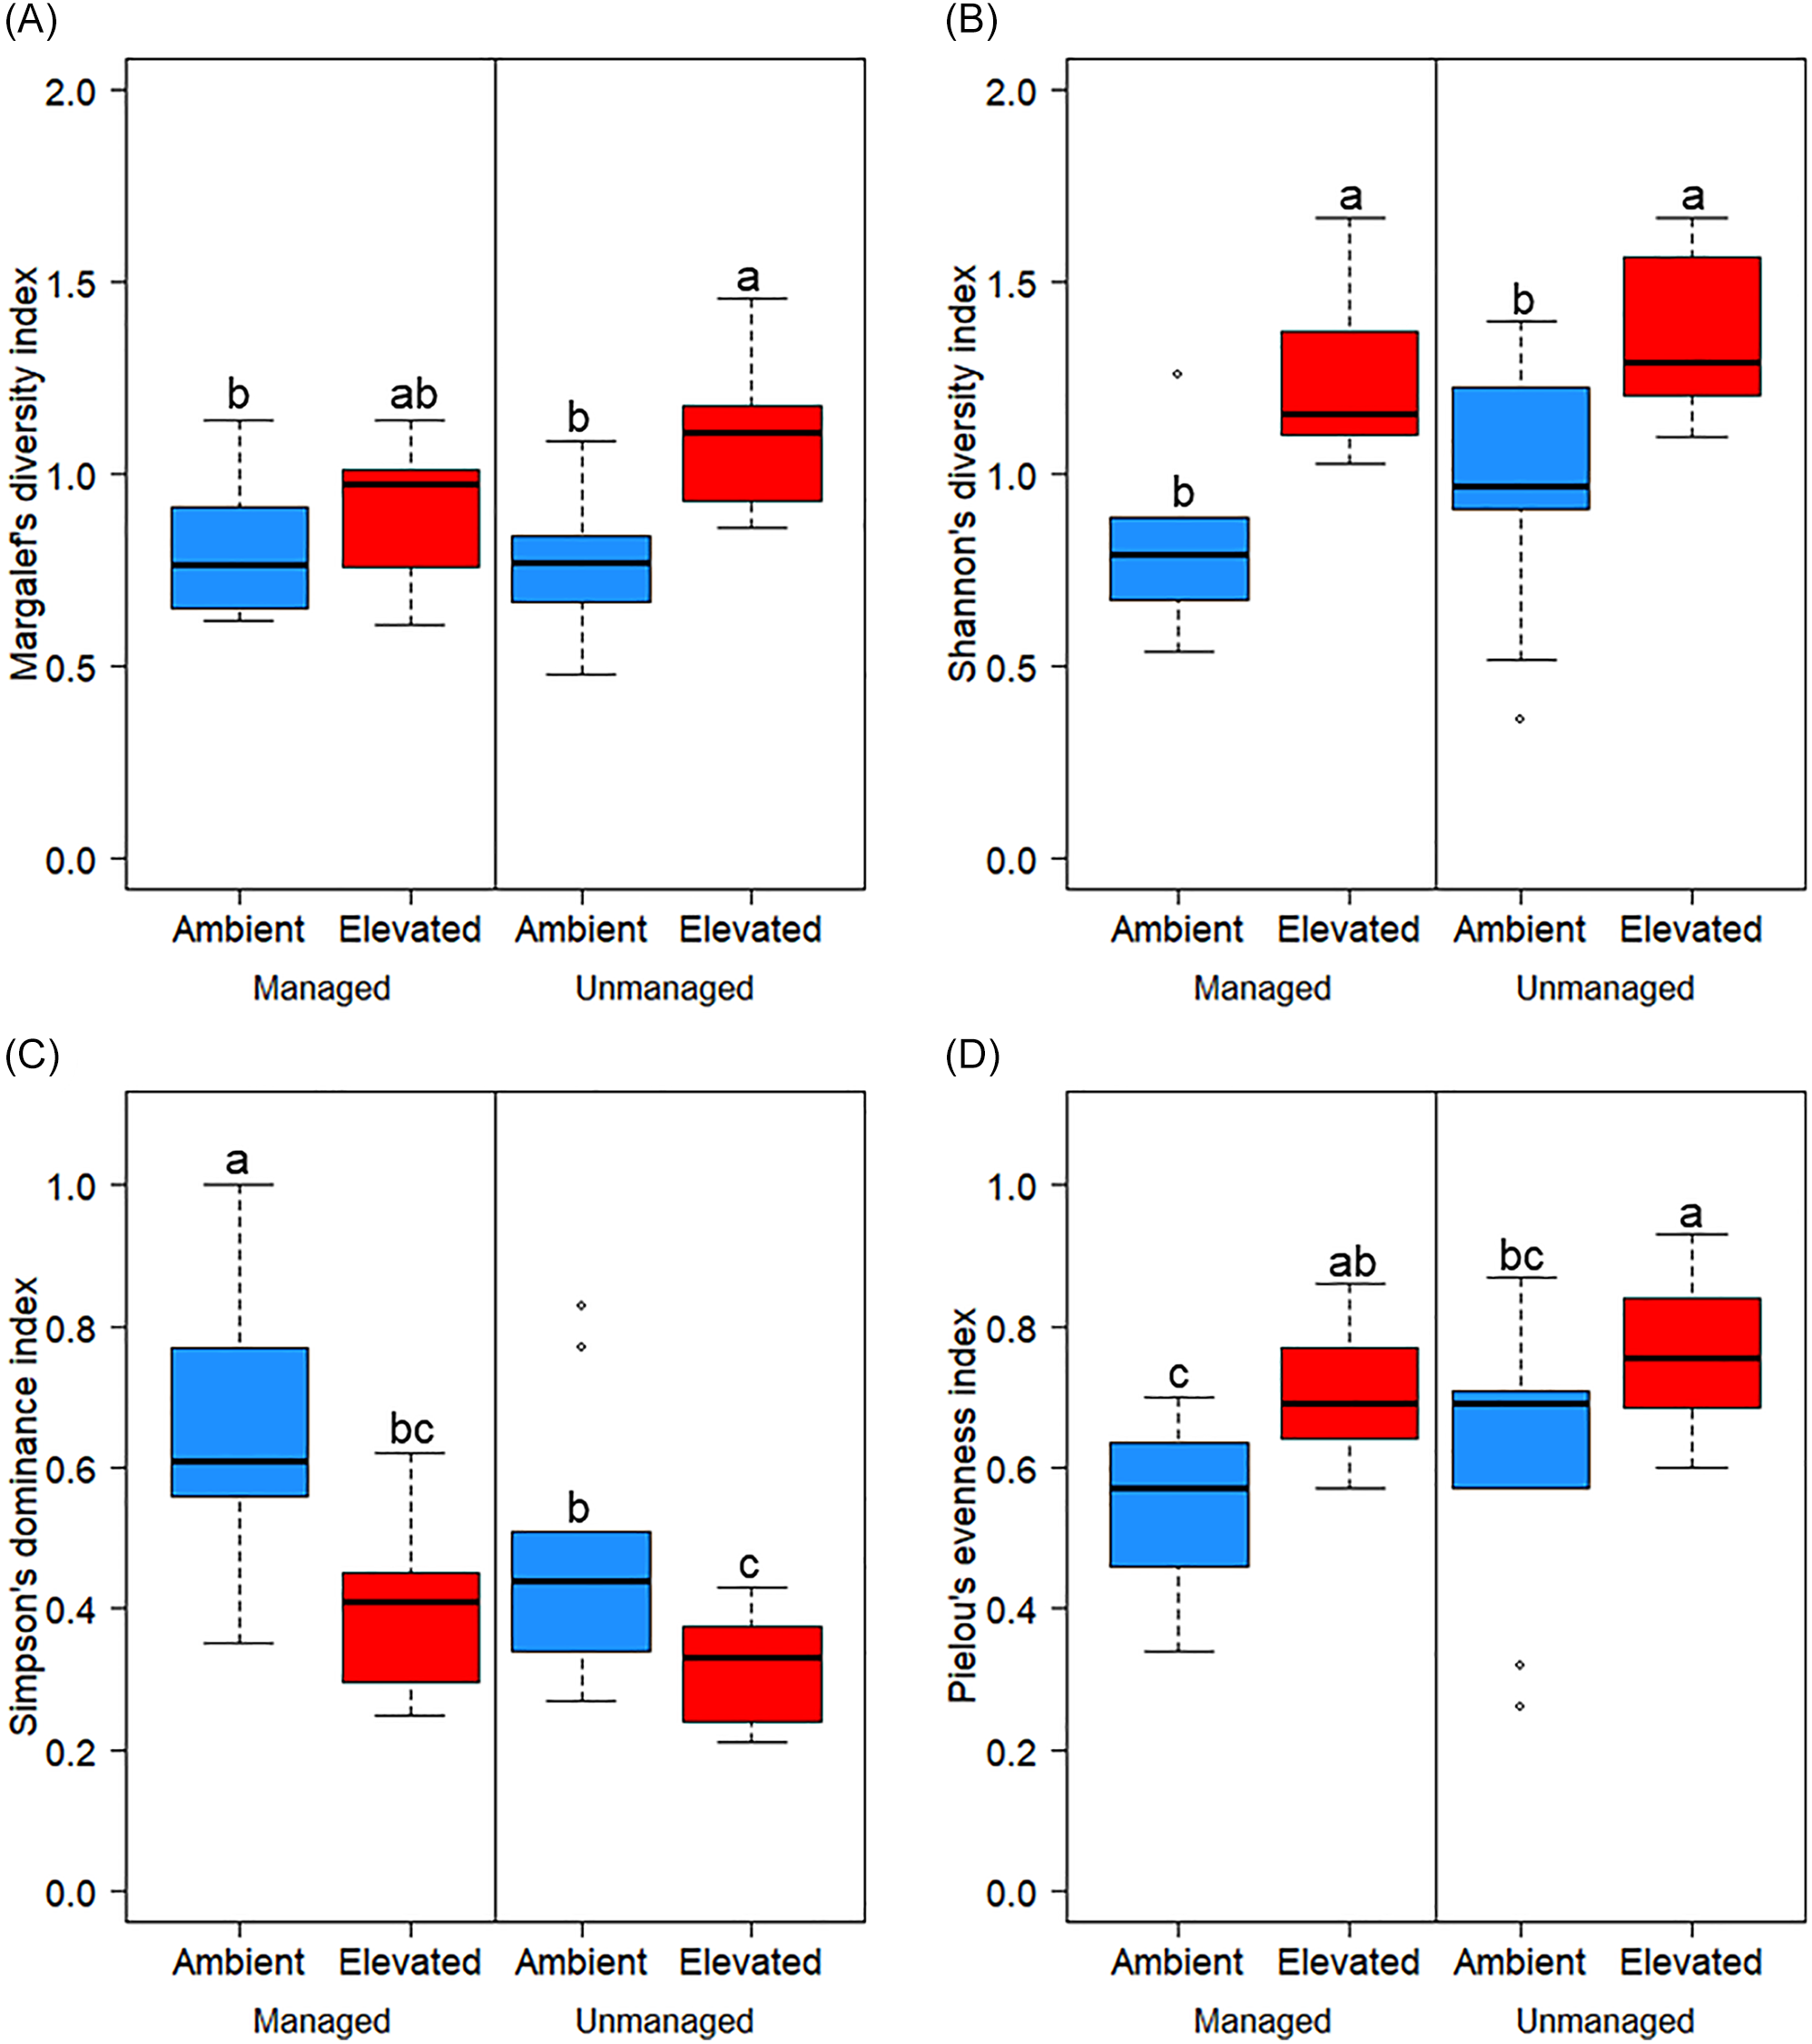
To verify these empirical observations on weed ecology, four major diversity indices were calculated at the conclusion of the experiment: Margalef’s diversity index (D Mg), Shannon’s diversity index (H′), Simpson’s dominance index (λ), and Pielou’s evenness index (J′) (Figure 6). For D Mg, H′, λ, and J′, a higher index indicates greater richness, richness + evenness, dominance, and evenness, respectively. D Mg was greater (P < 0.05) for elevated CO2, especially in unmanaged plots (mean of 1.1). Accounting for both species richness and evenness, H′ was greater under elevated CO2 conditions, regardless of management (mean of 1.3 to 1.4). For weed dominance, λ was highest in managed plots under ambient CO2 (mean of 0.7) and lowest in unmanaged plots under elevated CO2 (mean of 0.3). High species dominance in managed plots under ambient CO2 could be explained by fescue (Festuca spp.) plants comprising the only species in these plots, although the C3 nature of Festuca makes its dominance in these plots compared with elevated CO2 plots unusual. Species evenness (J′) data were, appropriately, inverse to that of λ, in which evenness was the lowest in managed plots with ambient CO2 (mean of 0.5) and highest in unmanaged plots with elevated CO2 (mean of 0.8). It is well documented that a diverse mixture of forage species can aid in weed suppression (Picasso et al. Reference Picasso, Brummer, Liebman, Dixon and Wilsey2008; Tracy and Sanderson Reference Tracy and Sanderson2004; Tracy et al. Reference Tracy, Renne, Gerrish and Sanderson2004). Conversely, forage bermudagrass grown as a monoculture is likely to have lower weed suppression, especially with increasing weed diversity (Sanderson et al. Reference Sanderson, Brink, Ruth and Stout2012). Once again, the increase in weed species diversity and competitiveness (especially for C3 weeds, which comprise a majority of southern U.S. forage system weeds) that accompanies elevated CO2 presents a major challenge for the future of weed management in bermudagrass and similar pasture crops.
Influence of management practices (managed or unmanaged) and CO2 levels (ambient or elevated) on Margalef’s diversity index (A), Shannon’s diversity index (B), Simpson’s dominance index (C), and Pielou’s evenness index (D). All indices were calculated at the α-diversity scale. Final data were recorded on April 22, 2025. Different letters denote significant differences among treatment means using Fisher’s LSD test (α = 0.05).

Figure 6. Long description
The image contains four box plots labeled A, B, C, and D, each representing different diversity indices. Plot A shows Margalef’s diversity index, Plot B shows Shannon’s diversity index, Plot C shows Simpson’s dominance index, and Plot D shows Pielou’s evenness index. Each plot compares the indices under two management practices (managed and unmanaged) and two CO2 levels (ambient and elevated). The box plots use different colors (blue and red) to distinguish between ambient and elevated CO2 levels. Different letters (a, b, ab, bc) denote significant differences among treatment means using Fisher’s LSD test at a significance level of 0.05. The data were recorded on April 22, 2025.
The dominant weed species at the conclusion of this experiment were Festuca spp., with the highest average plant density in all plots, except those that were unmanaged under elevated CO2 (Table 6). Consistent with the sampling date of late April, most of the top dominant weeds observed were C3 species [e.g., L. perenne spp. multiflorum, Canada goldenrod (Solidago canadensis L.)]. Only C3 species were present in managed plots, whereas C4 species (P. notatum, C. esculentus) were observed in unmanaged plots. Overall, temporal shifts in weed ecology due to management and CO2 were apparent. Our results indicate that weed species richness might increase as long-term atmospheric CO2 levels continue to rise, and this increase could be intensified without proper weed and nutrient management. This aligns with past predictions that weed population dynamics are expected to shift with environmental change factors like elevated CO2 (Ziska Reference Ziska2004, Reference Ziska2016). Such increases in weed diversity would broaden the spectrum of weeds that forage growers must manage, which is remarkably difficult for a sector of agriculture that already has relatively limited herbicide options. Therefore, maintaining adequate fertilizer and pest control are crucial measures to minimize the effects of environmental change on forage yields and productivity.
Overall, management appeared to be much more influential compared with elevated CO2 in regard to bermudagrass forage productivity. Although elevated CO2 had no significant effect on relative forage yield, it resulted in a significantly greater proportion of biomass occupied by weeds rather than bermudagrass, especially in unmanaged plots. A majority of the weeds identified in this study were C3 species. While overall weed pressure was low in managed plots, C3 species dominance was highest in these plots when subjected to elevated CO2 in three of the six cuttings. After 7 yr, bermudagrass coverage decreased by approximately 69% and 97% in managed and unmanaged plots, respectively. As weed species progressively occupied this forage system via various means of seed dispersal, management with fertilizer and herbicide still limited weed densities. Although management had no effect on weed species richness, we observed significantly greater richness in plots exposed to elevated CO2. Visual observations were confirmed with species diversity indices, which yielded significantly greater richness (D Mg and H′) under elevated CO2 conditions. High species dominance and low species evenness were only evident in managed plots exposed to ambient CO2. These findings support previous studies that predicted considerable shifts in weed diversity due to environmental change factors like elevated CO2. Furthermore, our findings indicate that greater weed species diversity may not only accompany elevated CO2 but may become more pronounced if adequate fertilization and herbicides are lacking. Therefore, we urge growers to prioritize pest and nutrient management as a means of combating the eventual impacts of environmental change on weed diversity and interference with agronomic crops.
Acknowledgments
We are grateful for help provided by Robert Icenogle and Barry Dorman at the USDA-ARS National Soil Dynamics Laboratory in Auburn, AL.
Funding statement
This research received no specific grant from any funding agency or the commercial or not-for-profit sectors.
Competing interests
The authors declare no conflicts of interest.



 Open access

