


Policy Significance Statement
Inspectorates often formulate inspection policies using models based on historical data. However, the specific behavioral interactions driving these models are often not well understood. This paper proposes a data-driven approach to constructing inspection models that shed light on the fundamental mechanisms contributing to the observed system-level behavior in real-world data. We illustrate the construction of a theory-infused phenomenological agent-based model by enriching historical data with behavioral theories. Adopting such models enables inspection agencies to glean valuable insights into the fundamental principles influencing inspection policies, thereby fostering the development of less biased models and more effective inspection policies.
1. Introduction
For over a decade, law enforcement agencies have increasingly embraced risk-based regulation as an official policy to encourage compliance with laws and safeguard public safety. Risk-based regulation theories assert that regulatory agencies should prioritize allocating scarce resources to inspected entities that pose the highest risk, namely those most likely to violate laws and whose violations carry significant societal consequences (Buie et al., Reference Buie1996; Hutter, Reference Hutter2005). Traditional approaches to risk-based regulation model inspectees’ motivations to violate laws known as “typologies of compliance” (Becker, Reference Becker1968; Becker and Stigler, Reference Becker and Stigler1974; Kagan and Scholz, Reference Kagan and Scholz1980; May, Reference May2005; Mitchell, Reference Mitchell2007; Stigler, Reference Stigler1970). These approaches carry significant limitations. Their models oversimplify reality by assuming perfect rationality; they neglect the multiple motivations, lack of access to information, and evolving behavior of actors in the real world (Alm et al., Reference Alm, Sanchez and De Juan1995; Beinhocker, Reference Beinhocker2006; Marin et al., Reference Marin, Fernandez and Vasconcelos2020; May, Reference May2005; Scholz, Reference Scholz1997).
Like risk-based regulation, responsive regulation theories offer inspectors an enforcement strategy tailored to specific non-compliant entities; rather than assessing risk, responsive regulation adjusts enforcement actions depending on the severity of the offense and inspectees’ response to it (Ayres and Braithwaite, Reference Ayres and Braithwaite1992; Baldwin and Black, Reference Baldwin and Black2008; Black and Baldwin, Reference Black and Baldwin2010; Lodge and Wegrich, Reference Lodge and Wegrich2012; Scholz, Reference Scholz1984). Despite some studies suggesting that responsive regulation increases compliance (Christian, Reference Christian2017; Islam and McPhail, Reference Islam and McPhail2011; Zhu and Chertow, Reference Zhu and Chertow2019), critics argue that it may be unrealistic. Responsive regulation wrongly assumes that inspectorates have sufficient resources to conduct follow-up inspections and requires the enforcement severity to increase over time (Short and Toffel, Reference Short and Toffel2010; Van Duin et al., Reference Van Duin, Dekker, Wielhouwer and Mendoza2018; Van Erp, Reference Van Erp2011). Existing research on risk-based and responsive regulation still lacks a consistent data-driven approach, hindering regulatory agencies’ ability to allocate resources efficiently.
Data can improve responsive risk-based regulation by quickly identifying emerging risks in various sectors, yet data-driven models come with explainability and generalizability issues (Amarasinghe et al., Reference Amarasinghe, Rodolfa, Lamba and Ghani2023; Kitchin, Reference Kitchin2014; Solomatine and Ostfeld, Reference Solomatine and Ostfeld2008; Yeung, Reference Yeung2018). A purely data-driven model relies on statistical patterns within observed data rather than on established theories (Chalikias et al., Reference Chalikias, Tsampoulatidis, Tsalakanidou, Nikolopoulos, Kompatsiaris, Komninos, Doudouliakis, Papastergios, Papafilis and Karkaletsi2020; Frigg and Hartmann, Reference Frigg and Hartmann2006; Hilborn and Mangel, Reference Hilborn and Mangel2013). This increases the model’s complexity and makes it difficult to explain to a broad audience (Amarasinghe et al., Reference Amarasinghe, Rodolfa, Lamba and Ghani2023; Yeung, Reference Yeung2018). A lack of explainability raises ethical concerns, particularly for public institutions like inspection agencies. Inspectorates must be able to justify their definition of risk and responsiveness, especially when dealing with vulnerable groups or if model flaws result in disproportionately high fines for individual households. Data-driven models are typically developed within specific contexts, limiting their generalizability only to the system of study. Current approaches to address generalizability issues in these models remain largely ad hoc and unstructured (Wang et al., Reference Wang, Lai and Grebogi2016).
Agent-based models (ABMs) provide the means to address the challenges of explainability and generalizability inherent in purely data-driven approaches (An et al., Reference An, Grimm, Sullivan, Turner Ii, Malleson, Heppenstall, Vincenot, Robinson, Ye and Liu2021). Importantly, ABMs also possess the unique capability to incorporate behavioral theories, enhancing their generalizability across diverse contexts (An et al., Reference An, Grimm, Sullivan, Turner Ii, Malleson, Heppenstall, Vincenot, Robinson, Ye and Liu2021). ABMs integrate behavioral theory by enabling modelers to define agents with distinct characteristics and behaviors while allowing them to interact with one another (Edmonds and Gershenson, Reference Edmonds and Gershenson2015). This interaction gives rise to system-level dynamics over time that provide a deeper understanding of the system under study.
ABMs are not inherently data-driven; rather, they primarily rely on data for parameterization, calibration, and historical validation (Chattoe-Brown, Reference Chattoe-Brown, Atkinson, Delamont, Alexandru, Sakshaug and Williams2019). To advance the use of data-driven approaches, we propose a methodology for developing a specific type of agent-based model that we call a “theory-infused phenomenological ABM” (TIP-ABM). Our approach merges a fundamental, theory-driven ABM structure with data-driven, empirical phenomena. This combination has notable potential to address the limitations of purely data-driven methods while reconciling the fundamental tensions between data-driven and theoretical approaches. ABMs can simulate inspectees’ behaviors in response to inspectors’ strategies, providing valuable insights to regulatory agencies on how to improve overall compliance (Ball, Reference Ball2012; van der Schaaf, Reference van der Schaaf2019). However, ABMs are rarely applied to the study of data-driven, risk-based inspections, especially for the inland shipping sector. To illustrate the development of the TIP-ABM, we present a case study focusing on the Dutch inland shipping industry.
This paper is structured as follows: The next section delves into the purpose, potential, and advantages of ABM; in addition, it examines current applications of ABMs and identifies gaps in its implementation within the policy-making inspection environment of the Dutch inland shipping industry. Section 3 presents a three-step, general methodology of combining theory and data-driven modeling into a TIP-ABM. Then, Section 4 introduces the case study of the Dutch inland shipping sector. Section 5 discusses the specific application of this methodology for the development of a TIP-ABM for the inland shipping sector. It details how key behavioral phenomena were identified and how agents interact with one another in the model. Finally, the article ends with model results, a discussion, and a conclusion on TIP-ABM. Ultimately, we conclude that our methodology helps verify and investigate implicit beliefs and theories regarding inspectees’ behavior, thus enhancing explainability. However, the risk of overfitting the model to statistical data from the inland shipping sector may limit its generalizability.
2. Agent-based modeling for risk-based enforcement
2.1. Potentials and advantages of agent-based modeling
ABM is a modeling method that involves simulating multiple autonomous agents who have unique characteristics and behaviors (Edmonds and Gershenson, Reference Edmonds and Gershenson2015). These agents interact with one another and their environment, making independent decisions based on their interactions (Macal and North, Reference Macal and North2005). Throughout the simulation, they exercise their agency and learn from past experiences over time (Edmonds and Gershenson, Reference Edmonds and Gershenson2015). For ABMs to be effective, they must serve a clear purpose and simplify reality. Clarity of purpose ensures that the model provides value to real-world contexts (Melchior et al., Reference Melchior, Dignum and Ruiz2019). Moreover, ABMs inherently contain abstractions of reality that require simplification (Edmonds and Gershenson, Reference Edmonds and Gershenson2015). The simplification process compels the modeler to make critical choices and weigh trade-offs properly, as these decisions can alter the model’s suitability for the intended context.
ABMs allow modelers to simulate realistic agent interactions without relying on established theories to explain their motivations. They excel at modeling bounded rationality, which refers to decision-making constrained by limited access to perfect information and a finite ability to process available information (Marin et al., Reference Marin, Fernandez and Vasconcelos2020; Simon, Reference Simon1957). Bounded rationality applies not only to inspectees deciding whether to comply but also to inspectorates facing an action dilemma. Regulatory agencies operate in uncertain environments with incomplete information and fixed resources (Bruijn et al., Reference Bruijn, Heuvelhof and Koopmans2007). Despite these challenges, they are mandated to achieve acceptable compliance outcomes in an industry. ABMs capture bounded rationality by simulating interactions between agents with limited information, enabling researchers to analyze the system-level consequences of agents’ actions based on the information available to them (Gräbner, Reference Gräbner2016; Marin et al., Reference Marin, Fernandez and Vasconcelos2020).
ABMs offer several advantages and applications in studying human behavior and developing effective strategic policy. They serve as valuable tools in policy development by accurately representing observed or theoretical phenomena (Edmonds and Gershenson, Reference Edmonds and Gershenson2015). By describing specific phenomena, ABMs help explain possible theories, explore scenarios, and predict future outcomes (Edmonds et al., Reference Edmonds and Meyer2017; Edmonds and Gershenson, Reference Edmonds and Gershenson2015; Epstein, Reference Epstein2008). For “dynamic and complex phenomena” which Edmonds et al. (Reference Edmonds and Meyer2017) define as situations where several mechanisms interact over time, ABMs offer a “direct representation without theoretical restrictions,” ensuring consistency between the represented entities and their interactions.
In addition, ABMs are highly flexible and adaptable; they accommodate changes to agent behavior based on expert knowledge and integrate random effects seamlessly (Barbaro, Reference Barbaro2015; Edmonds and Gershenson, Reference Edmonds and Gershenson2015). This adaptability enables ABMs to capture greater complexity than traditional mathematical models (Barbaro, Reference Barbaro2015). They provide valuable insights into intricate problems and help policymakers better understand complexity (Edmonds and Gershenson, Reference Edmonds and Gershenson2015; Edmonds et al., Reference Edmonds and Meyer2017). ABMs also inform decision-making processes by guiding adaptive strategies, scenario development, and generalization (Edmonds, Reference Edmonds2017; Edmonds and Gershenson, Reference Edmonds and Gershenson2015). Furthermore, ABMs shed light on inspectee behavioral dynamics, identifying trends and serving as virtual laboratories for testing intervention strategies before real-world implementation (van Asselt et al., Reference van Asselt, Osinga and Bremmers2016).
2.2. Applications of agent-based models to law enforcement
ABMs have been applied in the policy-making process, as evidenced by examples in existing literature that showcase their effectiveness in simulating illicit criminal markets and evaluating intervention strategies. For instance, Hoffer et al. (Reference Hoffer, Bobashev and Morris2009) employ an ABM to examine the heroin market in Denver, Colorado during the 1990s, linking observational data with agent behaviors to unveil its collective local impact. Despite its experimental nature, the ABM proved to be a groundbreaking method that shed light on the interactions in the heroin market and its resulting outcomes.
Other scholars use ABM to test law enforcement policies. Jones et al. (Reference Jones, Brantingham and Chayes2010) investigate the effectiveness of two police deployment strategies with an ABM: increased patrolling in crime hotspots and barring criminals from entering such areas. Their findings reveal that law enforcement deployment reduces crime rates at varying levels depending on the number and distribution of deployed police agents. Notably, they found that patrolling crime hotspots requires fewer police agents than barring criminals at the periphery.
Certain academics illustrate how criminal markets develop with an ABM. Hegemann et al. (Reference Hegemann, Smith, Barbaro, Bertozzi, Reid and Tita2011) leverage geographic information and gang data to simulate interactions among competing street gangs. Their ABM provides a flexible method to test theories about gang behavior and evolution. However, it falls short of pinpointing the root causes of gang formation. Nevertheless, their model effectively portrays the social dynamics between rival gangs, offering insights for devising strategies to prevent gang formation.
Few ABM applications focus on simulating the inspection environment. Van Asselt et al. (Reference van Asselt, Osinga and Bremmers2016) utilize an ABM to simulate how pig farmers comply with regulations regarding antibiotic usage. Their model evaluates several inspection approaches and discovers that social pressure significantly influences compliance. Pig farmers strive to comply as they seek acceptance within their community, resulting in higher compliance rates. Additionally, Van der Voort et al. (Reference Van der Voort, Sedee, Booijink and Vaart2020) apply an ABM to determine how inspectorates should implement data-driven risk-based inspections without introducing bias in the data. Their results suggest that inspectors should select a portion of inspection candidates randomly to ensure the data remains reliable in the long run. This recommendation provides a strategy for regulatory agencies to optimize their resource allocation.
Similar researchers employ ABMs to study inspections in the finance sector. Smojver (Reference Smojver2012) analyzes how banks and bank regulators interact, identifying the rules banks are most likely to break. This knowledge helps regulators adapt intervention strategies effectively to reduce the number of violations. Furthermore, ABMs have been applied to model tax compliance within social networks across various contexts. Studies by Korobow et al. (Reference Korobow, Johnson and Axtell2007), Hokamp and Pickhardt (Reference Hokamp and Pickhardt2010), Llacer et al. (Reference Llacer, Miguel, Noguera and Tapia2013), and Andrei et al. (Reference Andrei, Comer and Koehler2014) reveal insightful results for policymakers. Hokamp and Pickhardt (Reference Hokamp and Pickhardt2010) assert that ethical standards and time-based effects reduce tax evasion more than higher audit probabilities or tax rates. Andrei et al. (Reference Andrei, Comer and Koehler2014) emphasize the impact of an agent’s network on tax compliance, especially in centralized networks with substantial fines. In contrast, Llacer et al. (Reference Llacer, Miguel, Noguera and Tapia2013) find that social pressure improves compliance only under certain deterrence conditions. Korobow et al. (Reference Korobow, Johnson and Axtell2007) highlight that overall compliance increases only when inspectees are unaware of their neighbors’ payoffs. Although an agent-based approach can examine behavioral dynamics within a complex social system by depicting agents with bounded rationality, its application in the policy development process for inspectorates has been limited (Melchior et al., Reference Melchior, Dignum and Ruiz2019). Therefore, our research pursues further development and application of ABMs within the Dutch inland shipping inspection environment.
3. Theory-infused phenomenological agent-based modeling
ABMs provide law enforcement agencies a valuable tool for simulating networks where autonomous agents interact dynamically. Traditionally, scientists utilize ABMs to study how micro-interactions shape macro-level behavior in complex systems (Ball, Reference Ball2012). However, ABMs have been scarcely applied in the law enforcement domain, especially in a predictive capacity (Melchior et al., Reference Melchior, Dignum and Ruiz2019). Moreover, existing applications often rely on key assumptions about the behavior of inspected organizations. These assumptions typically originate from field observations made by inspectors. They often lack a data-driven understanding of the underlying motivations of those they inspect.
Phenomenological modeling offers a method for analyzing behavioral phenomena without presupposing the multitude of potential underlying motivations that may drive an individual’s decision to act lawfully or unlawfully. It can investigate behavioral dynamics beyond conventional compliance theories, such as peer pressure effects (Durlauf, Reference Durlauf1999). Combining a phenomenological and data-driven approach with ABM into a theory-infused ABM enables investigating complexity starting from empirical observations rather than theoretical conjectures. Consequently, a phenomenological model provides a distinct approach to traditional ABM, as detailed in Table 1.
Traditional versus TIP approach to ABM.
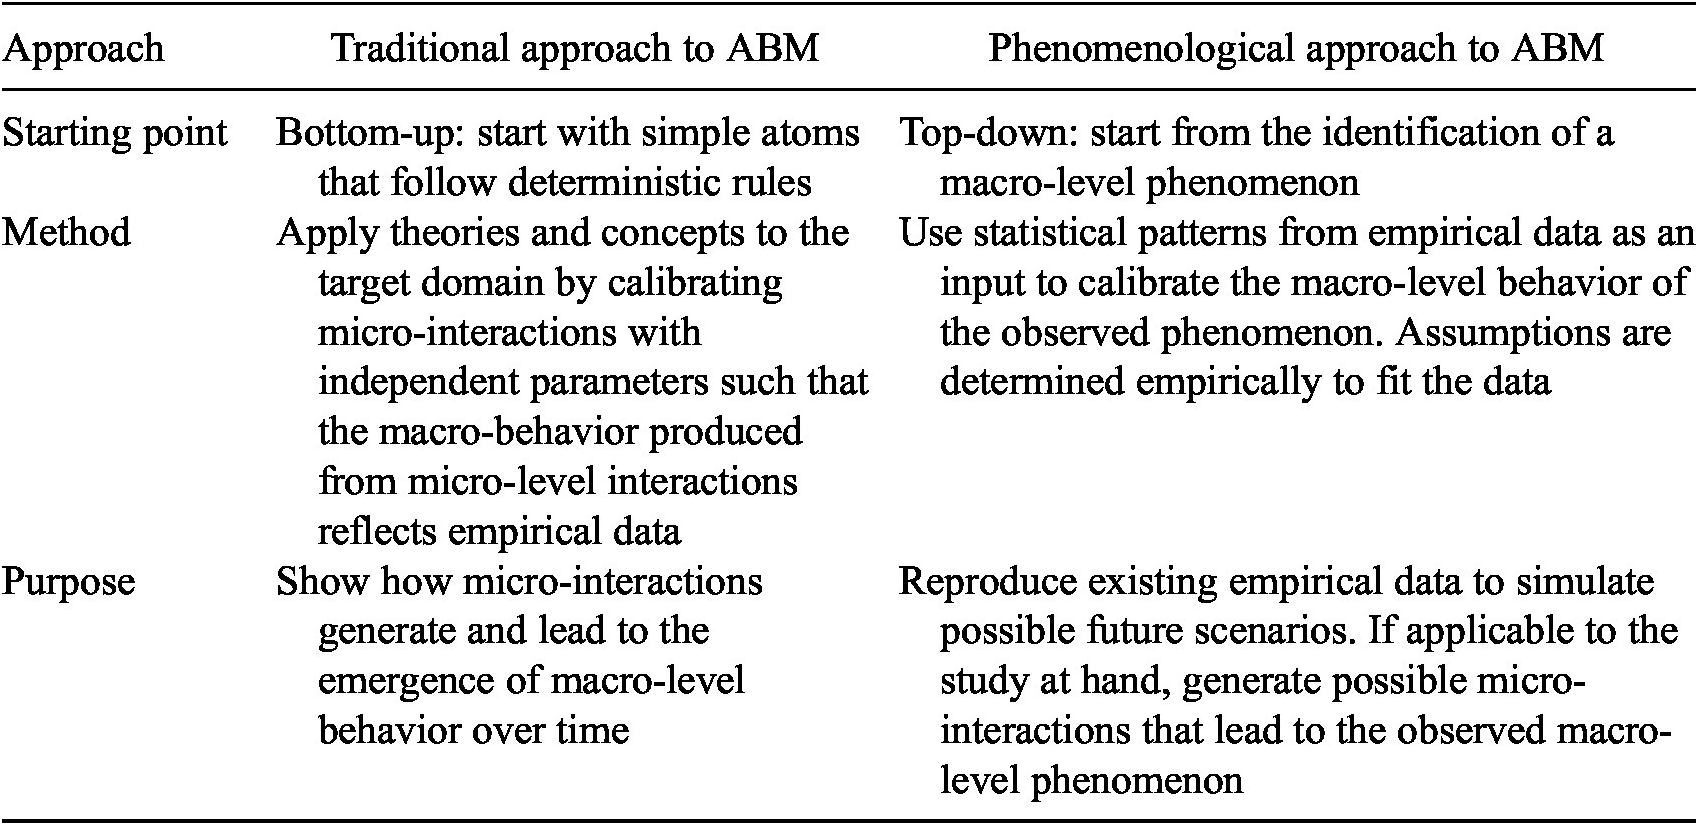
Source: Adapted from Schinckus (Reference Schinckus2019).
To integrate a data-driven ABM with behavioral theories, the first step involves identifying macro-level behavioral phenomena (Schinckus, Reference Schinckus2019). A phenomenon is an observed relationship between two variables in a dataset (Hilborn and Mangel, Reference Hilborn and Mangel2013). To determine the phenomena of interest, qualitative and quantitative data must be collected and analyzed to discern relationships between key variables. Subsequently, relevant behavioral theories should be identified. The data analysis and theories can then be conceptualized into a TIP-ABM. Figure 1 gives a high-level overview of the process of combining theories and data to create a TIP-ABM. This approach offers an advantage over pure phenomenological modeling methods by enhancing explainability; incorporating behavioral theories allows for a more comprehensive understanding and explanation of observed behaviors. In the following sections, this process of building a TIP-ABM is discussed in more detail through its application to a case study in law enforcement.
Process for combining theories and data to create a TIP-ABM.

4. Case study: law enforcement in the Dutch inland shipping sector
De Inspectie Leefomgeving en Transport (ILT), the Human Environment and Transport Inspectorate in the Netherlands, is responsible for 1) evaluating inspectees’ adherence to rules and regulations, 2) boosting compliance throughout industry, and 3) safeguarding the safety and sustainability of society, environment, infrastructure, transport, and housing (Inspectie Leefomgeving en Transport, 2022a). The Netherlands boasts the largest fleet of inland shipping vessels in Europe (Inspectie Leefomgeving en Transport, 2022b). These ships transport approximately 92 million tons of dangerous cargo annually, including flammable chemicals and toxic waste products (Inspectie Leefomgeving en Transport, 2022b).
The ILT enforces legislation in the inland shipping industry for the “safe transport of goods and passengers by water and fair competition within the sector” with measures like fines and administrative penalties (Inspectie Leefomgeving en Transport, 2022a). We apply our TIP-ABM in this context to illustrate its practical application.
5. An agent-based model for inspections of inland shipping actors
We combine a data-driven ABM with behavioral theories to create a TIP-ABM that evaluates compliance as inspectors and inspectees interact. Our model generates 7878 inland shipping agents and 100 inspectors, each capable of conducting around 13 inspections per inspection cycle. These agents are randomly distributed within the model world. Inspectors choose whom to inspect based on five user-defined inspection strategies outlined in Section 5.3 and Table 4. Subsequently, the chosen inspectees undergo inspection, and inspectors implement enforcement interventions. Inspectors can opt for a standard enforcement (SE) or a responsive enforcement (RE) strategy, as explained in Section 5.2 and Figure 4. Inspectees determine their compliance behavior in response to three variables: peer pressure, inspections, and enforcement (see Table 2). For example, a shipping company might succumb to peer pressure by imitating the behavior of their neighbors. If a compliant company is surrounded by law-breaking ones, they might start violating regulations unless enforcement measures are administered. Moreover, an inspectee can adjust their compliance level in response to inspections, either by escalating or deescalating the severity of their offense. Enforcement strategies can encourage non-compliant entities to cease unlawful behavior if they are responsive to enforcement. By modeling these behavioral phenomena individually and in combination, our model stimulates discussion within the ILT regarding the underlying and implicit behavioral dynamics of the inspection environment.
Behavioral phenomena studied in this research.

5.1. Define macro-level empirical phenomena
A TIP approach to ABM starts with identifying macro-level behavioral phenomena through analysis of empirical data (Table 1). We examine the Inspectieview Binnenvaart (Inland Shipping Inspection) dataset, which contains records of inspections conducted between March 2, 2015 and March 16, 2020 from five agencies: 1) ILT, 2) Ministry of Infrastructure and the Environment (Rijkswaterstaat), 3) Dutch National Police, 4) Port Authority of Rotterdam, and 5) Port of Amsterdam (Inspectie Leefomgeving en Transport et al., 2020). This dataset comprises longitudinal data detailing the outcomes of inspections, specifically whether inspected shipping companies had violated any Dutch environmental regulations governing the sector.
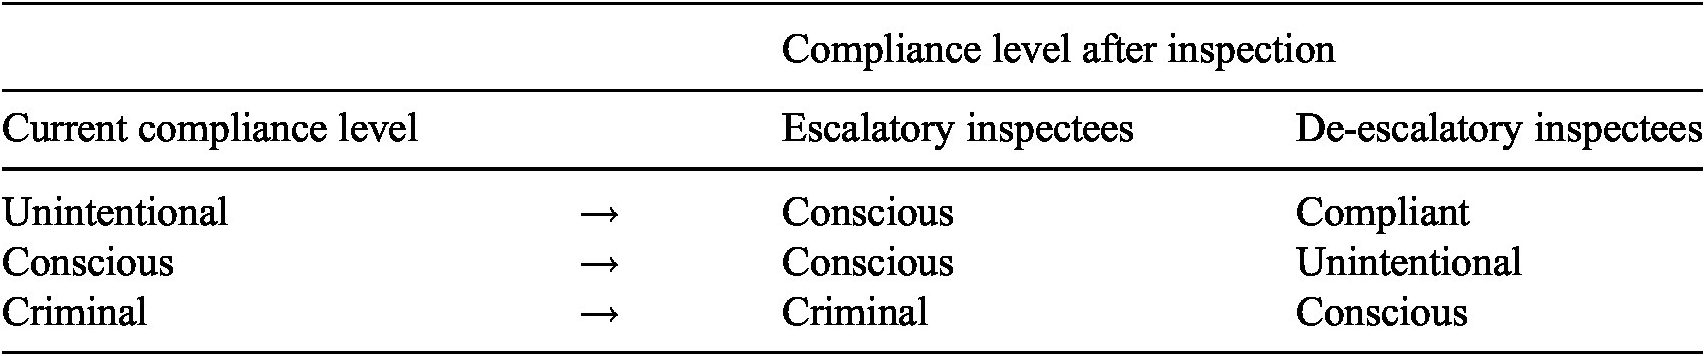
Statistical patterns in the Inspectieview Binnenvaart data show a correlation between inspectees’ behavior and inspection frequency (variable #2 in Table 2). Utilizing group-based trajectory modeling (GBTM), a technique that uses maximum likelihood estimations to find subgroups of a population sharing similar behavioral trajectories over time (Nagin, Reference Nagin2010), we identify three main categories of inland shipping inspectees: de-escalatory, escalatory, and those with unchanged behavior (Meester, Reference Meester2021). De-escalatory inspectees improve compliance with increasing inspections over time; they de-escalate the severity of their offense after inspection. These inspectees comprise 6.98% of the inland shipping population. Conversely, escalatory inspectees increase the severity of their offense after inspection; 2.97% of inland shipping inspectees behave in this manner. The remaining 90.05% do not change their behavior after inspection (Meester, Reference Meester2021). Historically, an average of 39.6% of inspected shipping companies are compliant. The remaining 60.4% of non-compliant inspectees have varying offense severity levels, with 20.8% unintentional-, 76.4% conscious-, and 2.8% criminal-level violators (Figure 2). Unintentional offenders are indifferent, benevolent, and potentially incompetent actors with violations having minimal to no impact on society. Conscious offenders are calculative risk-takers who commit violations that have limited to moderate impact. Criminal offenders violate in a structural and coordinated way, such as money laundering and fraud, with significant, threatening, and irreversible impacts (Inspectie Leefomgeving en Transport, 2022c). Inspectees adjust their compliance level based on their current behavior and how they react to inspections, as outlined in Table 3. The results of the GBTM analysis contribute to defining inspectees’ response to inspections as the macro-level empirical phenomena that form the foundation of our TIP-ABM.
Average violations per inland ship for a population of 7878. On average, approximately 40% of inspected ships are compliant, with a majority of inspectees having less than 10 violations.
Source: Adapted from Meester (Reference Meester2021).

Behavioral trajectories of escalatory versus de-escalatory inspectees
5.2. Identify behavioral theories of interest
Through a literature review and interviews with ILT experts, we identify two key behavioral theories: inspectees’ response to peer pressure and enforcement. We gathered qualitative data by conducting unstructured interviews, attending informational meetings, and observing ILT activities such as weekly meetings. These interviews were held in face-to-face group settings with ILT experts over several weeks. They were designed to be conversational and open-ended, allowing for collective engagement among ILT participants to discuss the behavior of inland shipping companies and the effectiveness of inspections within the sector. Anecdotal responses from participants were recorded and analyzed thematically to identify recurring insights. The analysis was then reviewed in subsequent group meetings to validate the results with the participants. The data from these interviews show that ILT inspectors observe the effect of peer pressure on inspected companies in the inland shipping sector. When influenced by peer pressure, inspectees imitate the compliance behavior of nearby companies. Existing research also supports the theory that individual actions in a network are determined by group dynamics (Durlauf, Reference Durlauf1999; Keizer et al., Reference Keizer, Lindenberg and Steg2008). While the ILT lacks concrete data on peer pressure, we conceptualize this micro-interaction based on theoretical principles and qualitative insights from the ILT. Despite being more aligned with the traditional ABM methodology than a phenomenological approach, we included peer pressure in the model because of inspectors’ anecdotal observations in the inland shipping sector. Thus, the interviews led to the identification of peer pressure as a key behavioral theory to model (variable #1 in Table 2).
We identify inspectees’ responses to enforcement from a literature review of behavioral theories that suggest the most effective methods for boosting compliance. In May 2022, the ILT implemented a new enforcement strategy, the Landelijke Handhavingsstrategie (LHS), or National Enforcement Strategy. This strategy, akin to the responsive regulation theory proposed by Ayres and Braithwaite (Reference Ayres and Braithwaite1992), assesses offenders’ behavior and potential societal harm to determine appropriate enforcement interventions (Inspectie Leefomgeving en Transport, 2022c; see Supplementary Material). The LHS marked a shift in ILT inspection practices. Previously, inspectors adhered to the “Interventieladder” (Intervention Ladder) policy, which mandated starting with the lowest level of enforcement and escalating only after repeated offenses (Inspectie Leefomgeving en Transport, n.d.). In contrast, the LHS grants inspectors with the flexibility to choose from a range of interventions based on inspectees’ degree of responsiveness to the enforcement measure. Moreover, the LHS redefines inspection objectives, urging inspectors to pursue not only increased compliance but also to focus on maximizing positive social impact (Inspectie Leefomgeving en Transport, 2022a). In our TIP-ABM, SE represents the pre-LHS Interventieladder policy, and RE aligns with the LHS. According to the LHS’s responsive regulation theory, inspectees assess whether they can withstand the severity of the enforcement before deciding their next action. If their capacity to absorb the enforcement’s severity equals or exceeds it, they continue violating at the same level. Otherwise, they opt for compliance. This mechanism simulates the inspectees’ learning process; if they believe they can handle the cost of enforcement, they continue their non-compliant behavior. Although incorporating behavioral theory diverges from a purely phenomenological approach, it was included in the model to explore the effectiveness of the LHS in improving compliance. By investigating the macro-level effects of enforcement reactions, the ILT can better understand the circumstances under which such reactions lead to improved outcomes.
After completing steps 1 and 2 (Figure 1), we establish three behavioral phenomena describing how inspectees decide whether to comply with or violate laws, as shown in Table 2. Our TIP-ABM integrates two behavioral theories informed by a literature review and insights from ILT experts: inspectees’ reactions to peer pressure and enforcement. In addition, the model accounts for the phenomenon of inspectees reacting to inspections, supported by empirical evidence found through analysis of the Inspectiview Binnenvaart dataset.
5.3. Conceptualize an agent-based model using behavioral theories and empirical phenomena
Our TIP-ABM simulates various inspection and enforcement strategies for increasing compliance in the inland shipping sector, given the effects of peer pressure, inspections, and enforcement on compliance behavior. The model comprises two agent types: inspectors and inland shipping companies. At the beginning of the model, the inland shipping agents are randomly assigned to be either compliant or non-compliant based on empirical characteristics of the sector (see Section 5.1). The non-compliant agents are further categorized into three groups based on behavioral trajectories found in empirical data: escalatory, de-escalatory, and unchanging entities (see Section 5.1).
Each discrete time step represents one inspection cycle, which occurs multiple times a year at ad-hoc intervals. According to the Inspectieview Binnenvaart dataset (Inspectie Leefomgeving en Transport et al., 2020), the five Dutch agencies (ILT, Rijkswaterstaat, Dutch National Police, Port Authority of Rotterdam, and Port of Amsterdam) together conducted an average of 6781 inspections annually between 2015 and 2020. At the start of each time step, inspectors select inspection candidates according to the user-defined inspection strategy. The model tests five inspection strategies as detailed in Table 4: All Random (AR), Risk-based Highest Non-Compliant Record (RbNC), Risk-based Highest Offense Severity (RbOS), Mix of Random and Risk-based Non-Compliant Record (MRRbNC), and Mix of Random and Risk-based Offense Severity (MRRbOS). In the AR strategy, inspectees are selected randomly. For RbNC and RbOC strategies, inspectors choose inspectees with the highest history of non-compliant inspections and offense severity, respectively. An inspectee’s offense severity represents the impact of the violation on the environment and society. The MRRbNC and MRRbOS strategies combine randomized and risk-based selection with the proportion of risk-based selections based on non-compliant records and offense severity, respectively. The total number of inspections depends on the number of available inspectors and their inspection capacity per cycle. Without the impact of peer pressure or enforcement, escalatory inspectees always raise their offense severity level with every inspection until they reach the criminal level of offense or until an enforcement intervention compels de-escalation. Conversely, de-escalatory inspectees reduce their offense severity to a lower level upon inspection (see Table 3). In our TIP-ABM, we assume that all inspectees are available for inspection at each time step. However, this assumption may not fully reflect reality, as some inspectees might be inaccessible for various reasons. For instance, some could be in transit when the inspector arrives, or their businesses could have ceased operations.
Modeled inspection strategies.

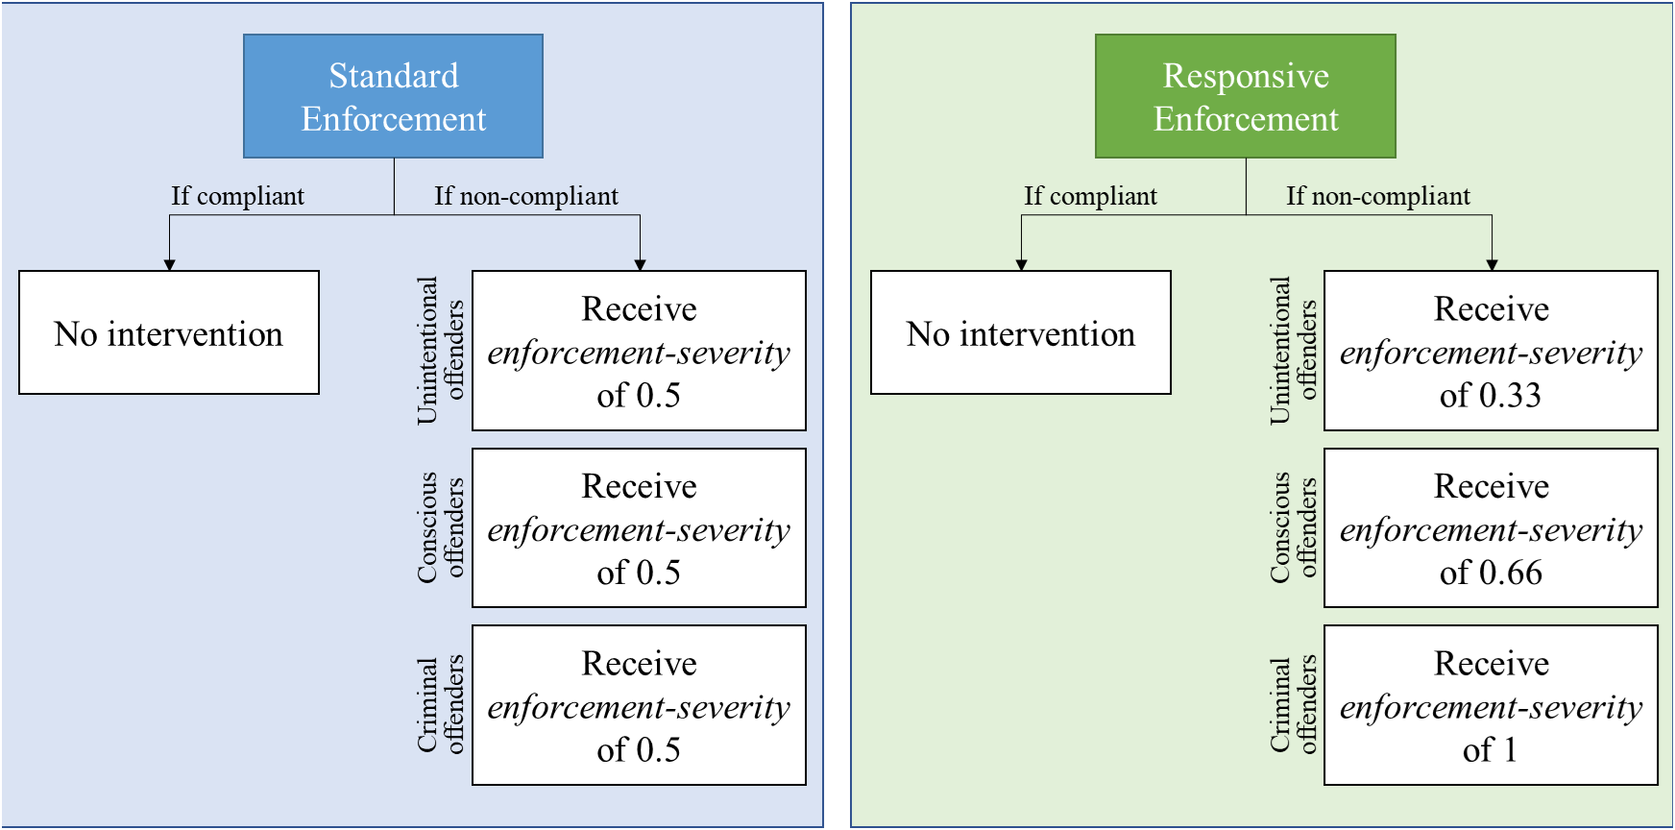
After inspection, inspectors apply enforcement measures to non-compliant entities. Our model includes two enforcement approaches: SE and RE (Figure 4). SE represents the pre-LHS strategy, where inspectors apply a uniform enforcement intervention to all non-compliant actors. On the other hand, RE adjusts the enforcement to match the offense severity level, reflecting ILT’s current LHS enforcement strategy. When reacting to enforcement, noncompliant inspectees assess if they can withstand the severity of the intervention before deciding their next action. If the inspectee’s absorbance capacity exceeds the enforcement severity, they continue to violate at the same offense severity level; otherwise, they de-escalate their behavior because they cannot resist the enforcement measure (Table 3). This simulates inspectees’ learning: if they realize they can bear the cost of the intervention, they continue violating (see Section 5.2).
All inland shipping agents, regardless of whether they had been inspected, can succumb to peer pressure by adopting the neighbors’ most prevalent offense severity within a user-defined radius. This phenomenon is observed not only by ILT’s inspectors but also based on the behavioral theory that pressure from other actors in a networked environment drives an individual’s decisions (Durlauf, Reference Durlauf1999; Keizer et al., Reference Keizer, Lindenberg and Steg2008). By the end of each time step, all inspectees must make a binary choice to comply or violate, with non-compliant inspectees also choosing the severity of their violation based on their response to inspection and enforcement.
To summarize these behavioral dynamics, Figure 3 diagrams the model process. The TIP-ABM, implemented in NetLogo version 6.2.2 (Willensky, Reference Willensky2021), includes user-controlled on/off switches for testing the aforementioned behavioral phenomena and strategies in different scenarios. Developed as open-source software for creating ABMs, NetLogo was selected for its user-friendly interface, visualization capabilities, easy-to-understand code, and simplicity (Van Dam et al., Reference Van Dam, Nikolic and Lukszo2012). Its ability to adjust parameters easily and demonstrate the model’s functionality makes NetLogo practical for field inspectors and data scientists.
Phenomenological ABM flow diagram.
The circles indicate the start of an event, while the rectangles denote the processes in the model. The diamonds determine the conditions that must be fulfilled to continue down the pathway indicated by the arrows.

6. Results
The model ran four scenarios to determine the most effective intervention strategies based on various behavioral characteristics of the inspectee population. These scenarios explore two dimensions influencing inspectees’ behavior: peer pressure effects and response to enforcement. Designed to address gaps in hard data for a purely phenomenological approach, the scenarios assess different combinations of behavioral dimensions. The simulated inspectee populations range from individualistic (unaffected by peer pressure) to networked (peer-influenced) and non-responsive to responsive to enforcement interventions.
Each scenario’s inspection strategy underwent 50 simulations, which was considered satisfactory due to the minimal standard deviation between each run. In other words, additional simulations did not increase variation. The results, depicted in Figure 6 for SIM-1, exhibit a standard deviation below 0.4% across time steps 10, 100, and 1000.
SE versus RE strategies.
NetLogo interface of the TIP-ABM.
The menus on the left of the interface represent the parameters calibrated with the Inspectieview Binnenvaart dataset and those derived from behavioral theories. Users can select inspection and enforcement strategies from the dropdown list. Additionally, they can toggle the variables of interest—peer pressure, reaction to inspection, and enforcement—on and off. This allows for simulating variations of the interactions between inspectee and inspector agents.

Standard deviation of the average compliance rate for SIM-1.

Given the uncertainties and unknowns in the inspection environment, these scenarios prompt the ILT to anticipate future dynamics by integrating their theories about inspectees’ behavior and empirical patterns in the data. These scenarios, outlined in Table 5, simulate and compare all five inspection strategies to discern the most favorable outcomes. The compliance rate, or percentage of compliant inspectees, serves as a proxy for good behavior, and we evaluate the time taken to achieve compliance. In all scenarios, inspectees consistently respond to inspections, as this is the only behavioral dynamic calibrated by statistical data. Furthermore, only RE is simulated; sensitivity analysis and structural validation consistently show improved compliance outcomes for RE compared to SE (see Supplementary Material).
Summary of scenarios.

6.1. SIM-1: base case individualistic, non-responsive
In the base case scenario (SIM-1), inspectees do not react to peer pressure or enforcement interventions; they only respond to inspections. This scenario reflects the most phenomenological state of the model, as agents’ response to inspections is a statistical pattern identified from empirical data. In this case, the RbNC inspection strategy is the most effective in the short term (Figures 7 and 8). However, in the long run, the MRRbOS inspection strategy is the most effective at increasing the share of compliant inspectees (Figure 7). However, the MRRbOS inspection strategy requires a relatively longer time horizon, approximately 125 time steps or inspection cycles before it produces the same share of compliant inspectees as the RbNC inspection strategy (Figure 8). Therefore, the MRRbOS strategy may be untenable, and it might be necessary to significantly increase the severity of enforcement over time to achieve faster compliance outcomes.
SIM-1: Share of compliant inspectees over time (1000 ticks).

SIM-1: Share of compliant inspectees over time (150 ticks).

For all inspection strategies, there is an increase in the share of criminal inspectees, demonstrating the effects of escalatory behavior over time (Figure 11). However, this represents only a small share of the non-compliant population. De-escalatory behavior is more prevalent in the Dutch inland shipping sector, as evidenced by the increase in unintentional violators as the number of conscious violators decreases (Figures 9 and 10). Notably, only the MRRbOS inspection strategy can decrease the share of unintentional violators even after the initial de-escalation from conscious-level non-compliant behavior (Figure 9). This suggests that randomizing a portion of inspections offers further potential for additional inspectees to de-escalate their behavior until they become compliant. However, achieving this requires a long time horizon. Nonetheless, the impact of inspections is relatively small, as demonstrated by the plateau of the share of compliant inspectees at around 45.5% for the RbNC inspection strategy (Figure 7).
SIM-1: Share of non-compliant, unintentional violators over time.

SIM-1: Share of non-compliant, conscious violators over time.

SIM-1: Share of non-compliant, criminal violators over time.

6.2. SIM-2: networked, non-responsive
In a networked environment, inland shipping agents are subject to peer pressure and, therefore, imitate the behavior of their neighbors. This scenario represents a sector in which inland shipping companies are networked. Moreover, inspectees react to inspections, but those identified as non-compliant do not respond to subsequent enforcement measures. Here, the most effective inspection strategy is the RbNC inspection strategy, followed by the MRRbNC inspection strategy (Figures 12 and 13). Targeting inspections based on inspectees’ non-compliant records is more effective in a networked environment compared to an individualistic one. However, inspections alone cannot achieve majority compliance among inspectees. These findings highlight the significant influence of negative peer pressure within a networked context, corroborating the anecdotal observations from ILT experts. With only 7% of inspectees who would de-escalate their behavior in response to inspections, peer pressure exerts an overpowering effect compared to inspections. Given the high non-compliance in the inland shipping sector, peer pressure to violate laws spreads rapidly. This network effect undermines the effectiveness of inspections.
SIM-2: Share of compliant inspectees over time (1000 ticks).

SIM-2: Share of compliant inspectees over time (50 ticks).

The disparity between the share of conscious violators and unintentional or criminal violators widens from its initial values when the simulation begins (Figures 14–16). With the initial population skewed toward conscious violators, a networked population facilitates a rapid spread of conscious-level non-compliant behavior. Despite the efforts of inspectors, the pervasive influence of peer pressure perpetuates non-compliance, illustrating the limited efficacy of inspections in countering entrenched behavioral dynamics within a networked environment.
SIM-2: Share of non-compliant, unintentional violators over time.

SIM-2: Share of non-compliant, conscious violators over time.

SIM-2: Share of non-compliant, criminal violators over time.

6.3. SIM-3: individualistic, responsive
This scenario represents a sector where inland shipping companies do not react to peer pressure; inspection candidates only react to inspections and RE. The most effective strategy for increasing the share of compliant inspectees is the MRRbOS inspection strategy in both the short and long term (Figures 17 and 18). The least effective strategy is the RbNC inspection strategy (Figures 17 and 18). These results indicate that targeting risk-based inspections based on offense severity first reduces the non-compliance of higher-level offenders. As these offenders become compliant because of RE, the risk-based inspections then target lower-level offenders. The share of random inspections also allows for the inclusion of a wider range of inspection candidates, which ensures that some lower-level offenders are also inspected concurrently. This strategy casts a wide net while addressing the worst offenders early on. Compared to SIM-1, the rate at which the share of compliant inspectees increases is much higher. This is because criminal violators who cannot absorb the severity of enforcement become compliant in one inspection cycle; conversely, de-escalatory criminal violators require three inspection cycles to become compliant. The effect of enforcement is much quicker than that of inspections.
SIM-3: Share of compliant inspectees over time (1000 ticks).

SIM-3: Share of compliant inspectees over time (100 ticks).

Because of the reaction to enforcement, the share of criminal inspectees is very low (Figure 21). Similar to SIM-1, the de-escalatory behavior shifts inspectees from being conscious violators (Figure 20) to unintentional violators (Figure 19), causing an increase in the share of unintentional violators at the start of the simulation. Notably, the MRRbOS inspection strategy is effective at de-escalating unintentional violators, making it the most effective strategy in this scenario (Figure 19). The reaction to enforcement allows the population of inspectees to move toward compliance quicker than inspections alone.
SIM-3: Share of non-compliant, unintentional violators over time.

SIM-3: Share of non-compliant, conscious violators over time.

SIM-3: Share of non-compliant, criminal violators over time.

6.4. SIM-4: networked, responsive
This scenario simulates a sector where inland shipping entities react to peer pressure, inspections, and RE. The most effective strategy for increasing the share of compliant inspectees is the MRRbOS inspection strategy (Figures 22 and 23). As mentioned in the preceding section, targeting inspection candidates based on offense severity is effective in responsive environments, as it addresses the highest-level offenders quickly. In the long term, all inspection strategies except the AR strategy yield at least a 95% share of compliant inspectees (Figure 22), though the MRRbOS inspection strategy produces the fastest increase. Because this strategy contains a proportion of random inspections, the share of compliant inspectees plateaus at 95%, while the RbOS strategy eventually yields a 100% compliant population. Although this outcome is unrealistic, it shows that using a pure RbOS strategy systematically shifts the behavior of criminal, conscious, and unintentional violators in that order until all of them are compliant. However, this approach is redundant due to its long time horizon, especially when compared to the MRRbOS inspection strategy, which achieves higher compliance in the near term.
SIM-4: Share of compliant inspectees over time (1000 ticks).

SIM-4: Share of compliant inspectees over time (100 ticks).

The RbNC and MRRbNC inspection strategies initially result in a decrease in the compliant population, followed by an increase after approximately 10 inspection cycles (Figure 23). The networked nature of inspectees, combined with a high initial population of non-compliant individuals, leads to the spread of non-compliant behavior that both inspections and enforcement struggle to address initially. This early phase illustrates the strong peer pressure effects present at the start of the simulation. As some inspectees de-escalate their behavior after inspection or succumb to RE, they become compliant. Subsequently, these newly compliant agents begin to positively influence their peers toward compliance, leading to a rise in the proportion of compliant inspectees after the initial phase. In other words, RE and network effects together accelerate compliance beyond what inspections alone can achieve.
Because this scenario incorporates behavioral theories, the simulation relies on the traditional approach to ABM to bridge data gaps, particularly regarding the effect of peer pressure and responsive enforcement. The blend of empirical behavioral phenomena and behavioral theories is reflected in the results, although achieving nearly 100% compliance is unrealistic (Figures 23–26). These findings suggest that the conceptualized peer pressure effects and response to enforcement in the model can lead to nearly complete compliance in approximately 400 inspection cycles with all inspection strategies except the AR strategy. This long time frame raises doubts about the plausibility of such significant improvements in compliance outcomes.
SIM-4: Share of non-compliant, unintentional violators over time.

SIM-4: Share of non-compliant, conscious violators over time.

SIM-4: Share of non-compliant, criminal violators over time.

The challenge remains to effectively incorporate theoretical and empirical elements into an ABM and validate it with real-world data. Nevertheless, these findings indicate that in a networked environment, effective enforcement plays a crucial role in rapidly spreading compliant behavior while serving as the primary means to counteract negative peer pressure (compare the results of SIM-4 to those of SIM-2). Once a critical mass of compliant inspectees is achieved, social pressure further enhances compliance.
6.5. Summary of results
Our TIP-ABM combines statistical inspection characteristics specific to the Dutch inland shipping industry with theoretical concepts related to peer pressure effects and RE. The recommended inspection strategy for each scenario is summarized in Table 6 and Figure 27. The results indicate that enforcement actions capable of inducing behavioral changes toward compliance are the most effective means to address the prevailing non-compliance in the inland shipping sector. Inspections alone prove insufficient to encourage compliance. SIM-3 and SIM-4, which involve responsive populations, demonstrate higher compliance rates compared to non-responsive populations in SIM-1 and SIM-2. Enforcement encompasses any action against a non-compliant inspectee that prevents them from continuing their violations, such as imposing substantial fines that disrupt operations. The model yields the best compliance outcomes when law-abiding behavior, spurred by RE, creates a critical mass of compliance that spreads through peer pressure.
Average compliance rate for the recommended inspection strategy for each scenario.

Summary of scenario results.

7. Discussion
Our study aims to employ a phenomenological approach to ABM by starting the modeling process with an understanding of macro-level phenomena informed by statistical data rather than behavioral theories. Using the inland shipping sector in the Netherlands as a case study, our model’s results prompt several reflections on the case and phenomenological ABM methodology.
The results indicate that inspections alone are insufficient for improving compliance. These findings sparked discussions within the ILT on strategies to bolster compliance in the inland shipping industry. The model outcomes suggest that the ILT could seek to influence peer pressure dynamics and administer enforcement interventions to deter and correct non-compliant behavior. In the modeled networked environment, inspectees observe and react to the compliance or non-compliance of their neighbors. Regulated entities may feel emboldened to engage in illicit behavior if they observe others violating regulations without facing significant consequences. If inspectees see their peers facing strict enforcement measures or adopting compliant behavior, they are more likely to follow suit either to avoid similar consequences or to align with prevailing social norms of compliance. These network effects create a feedback loop where the behavior of one inspectee influences the behavior of others, amplifying the spread of compliance throughout the network.
Inspectors are advised to pursue either an RbNC or an MRRbOS inspection strategies for non-responsive and responsive environments, respectively. Moreover, a full commitment to an RE strategy, where the severity of enforcement interventions is commensurate with the seriousness of the offense, is encouraged. The ILT should devote additional resources to explore and gather concrete data on peer pressure effects and RE in the inland shipping sector. Negative peer pressure, especially with a large initial share of non-compliant inspectees, facilitates the spread of non-compliant behavior that can only be effectively countered by RE. Further research should investigate how peer pressure shapes inspectees’ behavioral adaptions to evade inspections by gathering empirical data on this observed learning behavior. Additionally, further exploration should focus on analyzing and conceptualizing collected data into the TIP-ABM, along with testing additional inspection and enforcement strategies.
Although our model attempts to be rid of behavioral theories, these theories nonetheless played a pivotal role in the modeling process. Peer pressure dynamics and responsiveness are included in the model as strategic options, integrating the policies, professional practices, and regulatory frameworks of the ILT. A phenomenological approach to ABM enables the verification and optimization of ILT’s internalized theories which they inadvertently apply to their work. It forces ILT employees to articulate their theories explicitly so that they can be confronted with data. This empirical scrutiny provides a basis for dialogue that may refine or solidify their implicit theories, enriching the explainability of our model compared to traditional data-based models.
Nevertheless, a TIP-ABM remains valuable for inspectorates like the ILT. Statistical analysis of inspection data, coupled with its integration into the model, illuminates areas where knowledge gaps persist within the inland shipping sector. As Epstein, Reference Epstein2008 asserts, “without models … it is not always clear what data to collect.” In the study of social systems, theories inform data collection, which can subsequently be analyzed to confirm the existence of the theory (Epstein, Reference Epstein2008). In this study, the theory of responsive regulation guided our data collection efforts, which were then analyzed and incorporated into the model. Subsequently, the model’s results pinpoint areas requiring further validation and data collection, such as peer pressure effects and RE. Once data on these dynamics are collected, the model’s predictions can be compared to the real-world data to further validate the model beyond expert review and sensitivity analysis (see Supplementary Material). In addition, the ILT can conduct pilot tests of different inspection and enforcement strategies in the real world to evaluate their practical utility. Our approach, which integrates data and theory to develop a TIP approach to ABM, helps optimize the operations of an inspectorate where an iterative process between theory, data collection, and modeling maximizes the potential of data-based models for application in the inspection environment.
In short, despite the intention to avoid reliance on theories, a phenomenological approach remains adjacent to and implicitly incorporates them. The modeling process requires abstractions of reality to depict inspectee agents with state variables such as location, compliance history, and responsiveness to inspections. Selecting these state variables requires the modeler to choose relevant characteristics for the study which are often guided by behavioral theories on factors influencing behavioral changes. Consequently, even the most phenomenological state of the model is shaped by inspectors’ assumptions grounded in behavioral theories. Therefore, a TIP-ABM is never entirely detached from theories; rather, it highlights the importance of the iterative relationship between theory and data. While our approach involved integrating internalized theories as the second step in a three-step process, a deeper examination of the modeling process reveals the pervasive influence of behavioral theories across all three steps.
8. Conclusion
We show that it is possible to enrich an ABM with statistical insights from macro-level phenomena into a TIP-ABM. Our endeavor aimed to prioritize empirical data over behavioral literature, employing a three-step methodology. First, we identified macro-level empirical phenomena by collecting and analyzing data to unveil relationships between key variables. Second, we determined relevant behavioral theories. Finally, we conceptualized a TIP-ABM integrating both behavioral theories and empirical phenomena. However, we observed that behavioral theories permeated the entire modeling process beyond the confines of the second step alone. Notably, our pursuit of a TIP-ABM yielded valuable insights for the Dutch inspectorate, our case owner, as elaborated in the discussion.
Our main focus centered on the capacity of ABMs to address two key weaknesses inherent in data-driven approaches to risk-based law enforcement: explainability and generalizability. While ABMs offer a degree of explainability, our research relied heavily on professional judgments from the inspectorate, even in ostensibly phenomenological aspects of the modeling process. Inspectors had clear yet implicit ideas into which data and collection methods were relevant, informed by behavioral theories and professional expertise. Notably, inspectors paid particular attention to peer pressure mechanisms and responsive inspection strategies, which influenced our modeling exercise to become an iterative process between on-the-ground theories and data-derived phenomena. However, the explainability of the process remains a concern, given the reliance on tacit knowledge and the complex, iterative relationship between data and professional judgment. Despite these challenges, our approach holds promise for further refinement and validation within the inspectorate. While the ILT had extensive data and internalized theories, they lacked a framework for leveraging them to inform their strategies. Our model effectively illuminated implicit knowledge and data-derived phenomena, codifying ILT’s theories and statistical insights to make them more explainable (Nonaka and Von Krogh, Reference Nonaka and Von Krogh2009). The modeling process served as a collaboration tool connecting data scientists focused on empirical data and field inspectors relying on their professional judgments.
Two crucial considerations pertain to generalizability. Firstly, the model’s calibration to Inspectieview Binnenvaart data renders it highly specific to the Dutch inland shipping sector. Although the phenomenological parameters can be adjusted to accommodate other sectors, the risk of overfitting limits its applicability to alternative domains. Additionally, the model’s reliance on observed inland shipping inspection data may restrict its generalizability beyond the confines of this sector. Secondly, the model assumes the extrapolation of statistical relationships between inspections and compliance behavior beyond the empirical observations of the Inspectieview Binnenvaart dataset to simulate potential future scenarios. However, the possibility of overfitting the data raises concerns regarding the accuracy of extrapolations beyond the dataset’s duration.
In conclusion, our findings offer a nuanced perspective. A TIP approach to ABM encounters similar challenges as pure data-driven methodologies. Nevertheless, it merits further exploration for its potential to bridge the gap between data experts and field professionals, fostering a productive dialogue between these groups (Van der Voort et al., Reference Van der Voort, van Bulderen, Cunningham and Janssen2021). This approach offers greater explainability compared to purely data-driven approaches, albeit primarily to the case owner.
Supplementary material
The supplementary material for this article can be found at http://doi.org/10.1017/dap.2024.34.
Data availability statement
The data that supports the findings of this study are openly available at https://github.com/eunicekoid/Portfolio/tree/main/ABM%20Dutch%20Inland%20Shipping%20Law%20Enforcement
Acknowledgements
We extend our gratitude to the Innovation and Data Lab (ID Lab) at the Human Environment and Transport Inspectorate (ILT) in the Netherlands for their invaluable assistance. This paper is based on a master’s thesis completed by Eunice Koid under the supervision of Haiko van der Voort and Martijn Warnier. The thesis is available in the TU Delft repository.
Author contribution
Conceptualization: Koid, E. Methodology: Koid, E. Writing original draft: Koid, E. Writing review and editing: Koid, E.; van der Voort, H.G.; Warnier, M.E. All authors approved the final submitted draft.
Funding statement
None.
Competing interest
The authors declare that no competing interests exist.
Ethical standard
The research meets all ethical guidelines, including adherence to the legal requirements of the study’s country.


 Open access
Comments
No Comments have been published for this article.