
I. INTRODUCTION
It has been estimated by the U.S. Department of Energy that more than $ 150 billion economic loss is caused by power quality problems each year in the USA [1,2], and this number is expected to continue increasing as the power demand increases much faster than the power system capacity. In addition, power quality problems are main threats to normal functioning of system equipments and end-user's devices. Even small voltage variations caused by power quality problems (within one cycle, i.e. 1/60 s) are detrimental enough to crash servers, computers, life-support machines and other microprocessor-based devices. To mitigate these risks, modern smart grid systems distribute a large amount of phasor measurement units throughout the entire power system for power quality monitoring. The system so-called Wide Area Measurement System is designed to provide real-time situational awareness which is essential for safe and reliable smart grid operations [Reference Wang, Li and Lu3,Reference Khurana, Hadley, Lu and Frincke4]. However, the real-time measurement system only is insufficient to meet the power quality monitoring requirements. Advanced measurement data-processing techniques must be designed to detect power quality problems in a fast and reliable manner.
The power quality monitoring generally consists of three steps: detection, characterization, and classification. The detection step takes the measurement data as input and triggers alarm when power quality problems are detected. The characterization step analyzes and extracts features from power quality problems data. Finally, the classification process classifies power quality problems into predefined categories based on the features extracted in the characterization step. According to the classification result, corresponding amending operations are then taken to solve the problem and mitigate the loss. Our focus in this work is on the first step, power quality problem detection.
Based on the deviation magnitude, power quality problems are generally classified into two categories, namely power quality variations and power quality events [Reference Bollen5]. The power quality variation is characterized by small deviations from the nominal power line signal while the power quality event typically has large deviations with approximately million dollars damage per event. Major power quality events are voltage sags, swells, and transients. In this work, we mainly focus on the power quality events detection.
To meet the stringent timeliness requirement, we propose a novel detection scheme based on the change-point detection theory in this work. We first study the statistical properties of normal power line signals and signals of all power quality event types. Then, a detection scheme based on the Cumulative Sum (CUSUM) approach is developed by exploiting the statistical properties. Finally, a multi-sensor joint detection scheme is proposed to further improve the detection speed.
The rest of the paper is organized as follows. Section II briefly discusses the previous work of power quality monitoring. Section III presents the single-sensor detection scheme. The multi-sensor scheme is then discussed in Section IV. Section V provides experimental results and, finally, Section VI concludes this paper.
II. REVIEW OF PREVIOUS WORK
Root-mean-square (RMS) voltage is a most widely used approach for power quality event detections in power system. The detector keeps track of the RMS value of the voltage signal over a sliding window with size typically as 1 cycle or 0.5 cycle. The likelihood of the power quality event is then evaluated according to the deviations from the nominal RMS value.
Another type of approaches utilizes either high-pass or bandpass filters, like Short-time Fourier transform [Reference Lee and Dash6,Reference Dash, Panigrahi and Panda7] and Wavelet filters [Reference Poisson, Rioual and Meunier8,Reference Yang and Liao9]. Since the normal power signal waveform is only composed of harmonics of low-frequency components, high-frequency components usually indicates occurrence of power quality events, e.g. transients.
The third type of methods decomposes the power line waveform into a sum of damped sinusoids using super-resolution spectral analysis techniques (e.g., ESPRIT or MUSIC) [Reference Bollen10–Reference Dafis, Nwankpa and Petropulu12]. Power quality events are then detected by decomposing the measured signal and comparing with those decomposed from normal signals.
Note that a sliding window is required by all of the three types of methods above to segment the power line signal waveform into blocks before any transformation or decomposition. As a result, the time resolution of all these methods is restricted.
Without the sliding window, Tartakovsky and Polunchenko [Reference Tartakovsky and Polunchenko13] discussed a decentralized change-point detection scheme in distributed sensor network. The scheme so-called MBQCUSUM using the binary quantization technique is proven to be asymptotically optimal at the reference points and rather efficient elsewhere.
III. SINGLE-SENSOR DETECTION SCHEME
A) Problem formulation
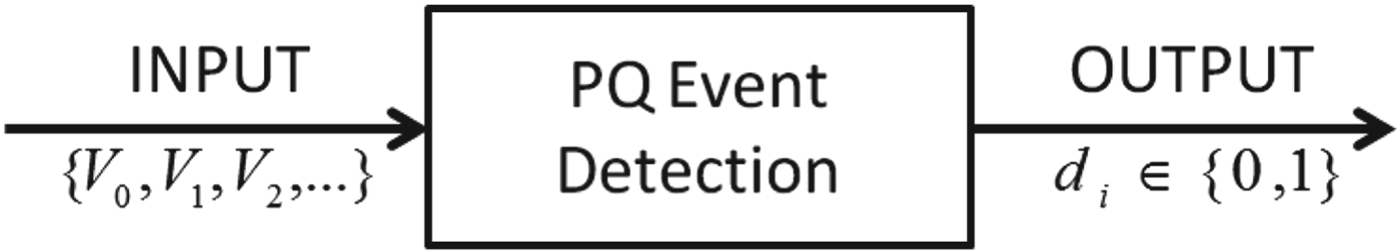
The single-sensor detection problem is to detect the power quality events as quickly as possible with only one sensor deployed in the target area. As shown in Fig. 1, given a sequence of power line sensor measurements {V i, i≥0}, where V i is either voltage measurement in volts or current measurement in ampere, the power quality event detection module outputs d i∈{0, 1} where 0 indicates the absence of power quality events while 1 indicates the detection of certain type of power quality event. For simplicity, we consider the single power quality event in our analysis.
Single-sensor power quality event detection.

Given event occurrence time t e and event detection time t d, the detection latency is then expressed as D=t d−t e, where t d≥t e. The primary goal of the single-sensor detection is to minimize the detection latency under constraints such as a given false alarm rate (FAR).
B) Proposed scheme
1. Overview
The proposed detection scheme is based on the change-point detection theory which provides optimal detection. In the scheme, we first model both of the pre-event (normal) and post-event power line signals. In the post-event signal modeling, we consider all types of power quality events, i.e. voltage sags, swells, transients and interruptions. By setting up these models, the probability density function (PDF) of both pre-event and post-event signals are derived. Finally, the CUSUM-based detection algorithm is proposed.
2. Signal modeling
According to the presence of the prior knowledge about the potential power quality event types, two power quality event modeling methods can be used: generic modeling and event-specific modeling. As the name suggests, generic modeling uses a single generic formula to model all types of power quality events by taking into account both additive and multiplicative distortion. In contrast, the event-specific model is proposed to further simplify the modeling of specific power quality events.
a. Generic modeling
• Pre-event signal
The kth sample of the pre-event signal can be modeled as
(1)where n[k] is the additive white Gaussian noise with zero-mean and variance $$y[k] = s_{{{\theta}_0}}[k] + n[k], t \leq t_e,$$$\sigma_{n}^{2}$, denoted by ${\cal N} (0,\sigma_{n}^{2})$, and
(2)is the pure power line waveform signal with T s being the sampling duration,$$s_{{\theta}_0}[k] = a_0 \cdot \sin \lpar 2 \pi f_0 T_s k + \phi_0 \rpar ,$$${{\theta}_{0}} \mathop{=}\limits^{\rm def} \lsqb a_{0}, f_{0}, \phi_{0} \rsqb ^{T}$, where a 0=1 is the signal amplitude gain, and f 0 and ϕ0 are the fundamental frequency and the initial phase of the power waveform, respectively.
$$y[k] = s_{{{\theta}_0}}[k] + n[k], t \leq t_e,$$$\sigma_{n}^{2}$, denoted by ${\cal N} (0,\sigma_{n}^{2})$, and
(2)is the pure power line waveform signal with T s being the sampling duration,$$s_{{\theta}_0}[k] = a_0 \cdot \sin \lpar 2 \pi f_0 T_s k + \phi_0 \rpar ,$$${{\theta}_{0}} \mathop{=}\limits^{\rm def} \lsqb a_{0}, f_{0}, \phi_{0} \rsqb ^{T}$, where a 0=1 is the signal amplitude gain, and f 0 and ϕ0 are the fundamental frequency and the initial phase of the power waveform, respectively.• Post-event signal
As a generic model, the kth sample of the post-event signal can be modeled as
(3)where$$y[k] = s_{{\theta}_1} [k] + n[k],\quad t \geq t_e,$$$s_{{\theta}_1} [k]$ consists of both additive and multiplicative distortion terms in an approach commonly employed in the literature of time-series analysis [Reference Adhikari and Agrawal14]. $s_{{\theta}_1} [k]$ has the following form:
(4)and$$s_{{\theta}_1}[k] = \underbrace{a_1\cdot \sin \lpar 2\pi f_1 T_s k + \phi_1 \rpar }_{\rm Multiplicative} + \underbrace{\xi_{\varphi} [k]}_{\rm Additive}$$$\theta_1 \mathop{=}\limits^{\rm def} \lsqb a_{1}, f_{1}, \phi_{1}, {\varphi}^T \rsqb ^T$.The above generic model can be used to model all types of power quality events with appropriate parameter adjustments. For instance, a voltage sags signal could be modeled as a sudden drop in the waveform amplitude gain with a 1<a 0, while setting
$f_{1} = f_{0}, \phi_{1} = \phi_{0}, \xi_{\varphi} [k] = 0$. In contrary, transient signal can be modeled with relatively large and fast-changing $\xi_{{\varphi}}[k]$.


b. Event-specific modeling
• Pre-event signal
Event-specific modeling adopts the same method of generic modeling for the pre-event signal, as shown in equation (1).
• Post-event signal
Different from the generic modeling, the post-event signal is modeled according to the specific type of the power quality event. We divide the three types of power quality events into two categories: sags/swells and transients.
For sags/swells, the voltage changes with possible phase deviation, but the frequency during the event keeps same. Therefore, the kth sample of the post-event signal is modeled as
(5)where e ss[k], sample from the difference of two sinusoidal signals with the same frequency but different phase, is uniformly distributed in [−b,+b] where b is an unknown parameter. The uniform distribution assumption was made by assuming the two sinusoidal signals are strongly correlated. e ss<0 indicates a voltage sag event, while e ss>0 indicates a voltage swell event.$$y[k] = s_{{\theta}_0} [k] + e_{ss} [k] + n[k], \quad t \geq t_e,$$

For transient, considering its damped oscillation during the event, the kth sample of the post-event signal is approximately modeled as
 $$y[k] = s_{{\theta}_0} [k] + e_{th} [k] + n[k], t \geq t_e,$$
where e th[k], is a normal distribution random variable with mean 0 and unknown variance σth2. Note that, the normal distribution is assumed by modeling the transient as sum of multiple sinusoidal signals [Reference Song, Sahinoglu and Guo15].
3. PDF derivation
With the above statistical models, we are able to derive the PDF of both pre-event and post-event signals for further analysis based on the change-point detection theory.
a. Pre-processing
To facilitate the PDF derivation, we first subtract the pure power line signal  $s_{{\theta}_0} [k]$ from the measured samples y[k]. After the one-step pre-processing, the output signal is derived as
 $$z[k] = y[k]- s_{{\theta}_0} [k],\quad \hbox{for all} t.$$
b. PDF derivation of generic modeling
After pre-processing, the pre-event signal becomes
 $$z[k] = n[k].$$
Therefore, the PDF of the pre-event signal can be derived as
 $$p_{{\theta}_0}(z) = {1 \over \sqrt{2\pi\sigma_n^2}} \exp^{-{z^2}/{2\sigma_n^2}}.$$
Similarly, the post-event signal becomes
 $$z[k] = x[k] + w[k],$$
where
 $$x[k] = a_1 \cdot \sin \lpar 2\pi f_1 T_s k + \phi_1 \rpar,$$
 $$w[k] = \xi_{\varphi} [k] - s_{{\theta}_0} [k] + n[k].$$
By invoking the central limit theorem, the PDF of w can be approximated as N(0,σw2), where 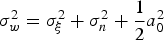 $\sigma_{w}^{2} = \sigma_{\xi}^{2} + \sigma_{n}^{2} + {1 \over 2} a_{0}^{2}$. Further, a first-order approximation of the PDF of x modeled as U(−a 1, a 1) is employed in the sequel to keep the following derivation analytically tractable. Then, it is straightforward to derive the post-event PDF as
 $$p_{{\theta}_1} (z) = {1 \over 4\vert a_1\vert} \left[\hbox{erf} \left(z + \vert a_1 \vert \sqrt{2} \cdot \sigma_w \right) - \hbox{erf} \left({z - \vert a_1 \vert \over \sqrt{2} \cdot \sigma_w} \right) \right],$$
where a 1 and σw are both unknown parameters.
c. PDF derivation of event-specific modeling
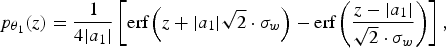
Similar to the generic modeling approach discussed above, the pre-event PDF of the event-specific modeling can be derived as equation (9). For the post-event signal, different types of power quality events have different PDFs.
For sags/swells, the post-event signal after pre-processing is written as
 $$z[k] = e_{ss}[k] + n[k].$$
It can be shown that the PDF of z[k] can be derived as
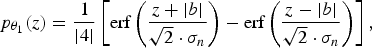 $$p_{{\theta}_1} (z) = {1 \over \vert 4 \vert} \left[\hbox{erf} \left({z + \vert b \vert \over \sqrt{2} \cdot \sigma_n} \right) - \hbox{erf} \left({z - \vert b \vert \over \sqrt{2} \cdot \sigma_n} \right) \right],$$
where b indicates the value range of the uniformly distributed e ss as shown in equation (5).
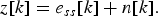
For transients, the post-event signal after pre-processing is expressed as
 $$z[k] = e_{th}[k] + n[k].$$
The PDF of z[k] can then be derived as
 $$p_{{\theta}_1} (z) = {1 \over \sqrt{2\pi (\sigma_n^2 + \sigma_{th}^2)}} \exp^{-[{z^2}/{2 (\sigma_n^2 + \sigma_{th}^2)]}},$$
where σth is an unknown parameter.
4. Detection algorithm
The proposed detection algorithm is based on the CUSUM scheme [Reference Page16,Reference Basseville and Nikiforov17]. The basic CUSUM algorithm first calculates the log-likelihood ratio of each sample as
 $$s[k] = \ln {p_{{\theta}_1}(z[k]) \over p_{{\theta}_0}(z[k])}.$$
Due to the existence of the unknown parameters in the post-event model, we calculate the weighted sum of the log-likelihood ratios considering all possibilities. We then extend equation (18) into the following form:
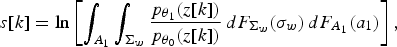 $$s[k] = \ln \left[\int_{A_1} \int_{\Sigma_w} {p_{{\theta}_1}(z[k]) \over p_{{\theta}_0}(z[k])}\,dF_{\Sigma_w} \lpar \sigma_w \rpar \, dF_{A_1}\lpar a_1 \rpar \right],$$
where  $F_{\ast}(\ast)$ indicates the cumulative distribution function of the unknown parameter. Three different uncertainty models (i.e. Guassian, Gamma, and Inverse-Gamma) of the unknown parameters are used [Reference Morelli and Moretti18].
With accurate modeling and parameter estimation,  $p_{{\theta}_1}(z[k])$ is generally larger than $p_{{\theta}_0}(z[k])$ during pre-event phase while smaller than $p_{{\theta}_{0}}(z[k])$ during post-event phase. As a result, s[k] is prone to be negative during pre-event phase while more likely to be positive during post-event phase. Then, we calculate the cumulative sum of the log-likelihood ratio as
 $$S[k] = \displaystyle{\sum}_{i=1}^k s[i].$$
Finally, according to the CUMSUM algorithm from the quickest detection theory [Reference Basseville and Nikiforov17], the stopping time can be found as
 $$t_d = \min \{k: S[k] - \min_{1 \leq j \lt k} \{ S[j]\} \gt h\},$$
where h is the predefined threshold.
IV. MULTI-SENSOR JOINT DETECTION SCHEME
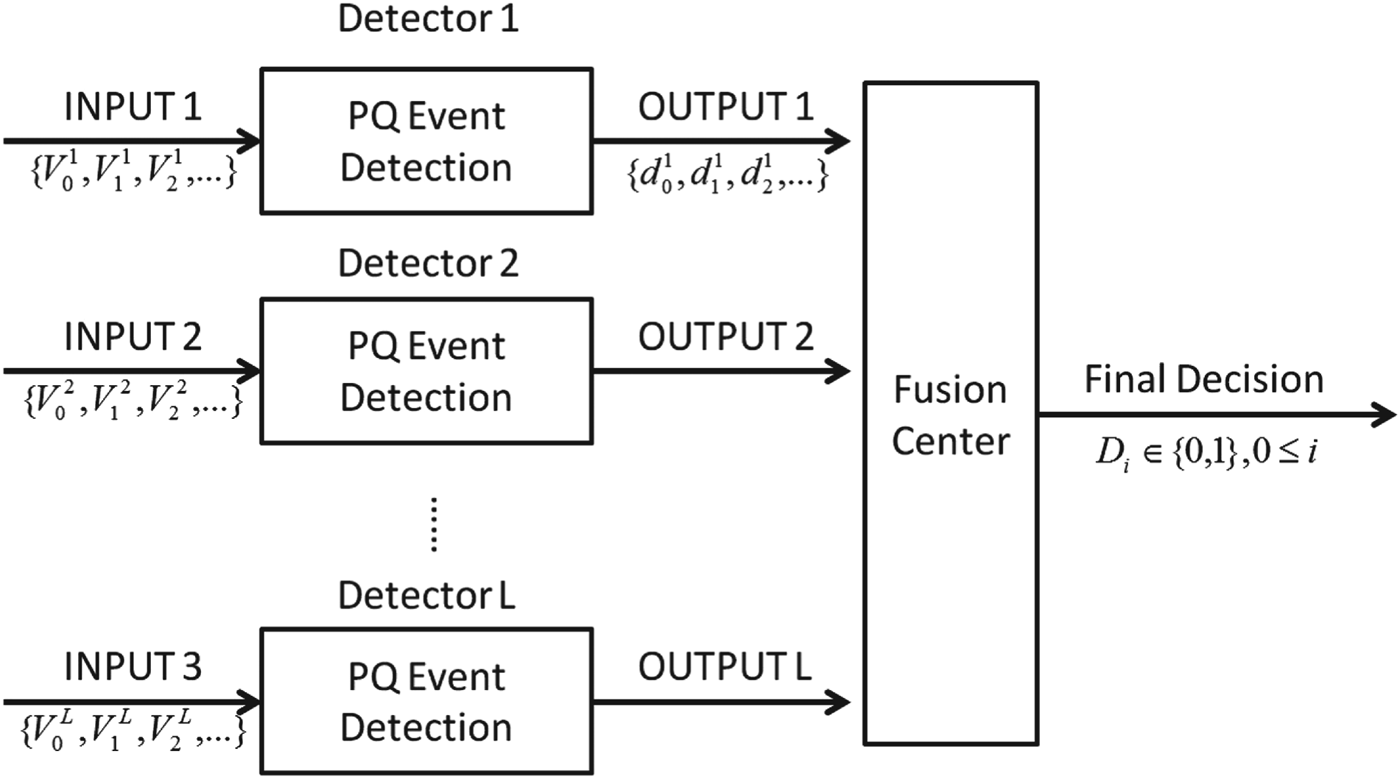
A) Problem formulation
In multi-sensor scenario, multiple sensors within the target geographical area are involved for the joint detection. As shown in Fig. 2, each detector takes its corresponding sensor measurements  $\{V_{0}^{l}, V_{1}^{l}, V_{2}^{l}, \dots \}, 1 \leq l \leq L$ as input sequence and outputs its processing result $d^{l}, 1 \leq l \leq L$. These intermediate processing results are then sent to the fusion center through independent communication channel. Finally, the fusion center makes the final detection decision, D∈{0, 1}, based upon the local processing results.
Multi-sensor joint detection.
B) Proposed scheme
Generally, there are two ways to handle sensors' measurements: one is to directly send the original measurements to the fusion center for central processing; the other way is to send the compressed measurements or local results to the fusion center for further processing. The latter one is usually more practical due to the communication bandwidth constraints.
In our proposed multi-sensor scheme, each remote detector outputs its local decision  $d_{i}^{l} \in \{0,1\}$ made by the single-sensor detection scheme discussed in Section III. On the fusion center side, majority voting is adopted for the joint decision making. Specifically, given a sequence of local decisions from multiple sensors in the target geographic area $d_{i}^{l}, i \geq 0, 1 \leq l \leq L$, where $d_{i}^{l} \in \{0,1\}$ and L indicates the number of sensors involved. The final decision is made as
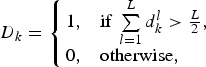 $$D_k = \left\{\matrix{1, & \hbox{if } \sum\limits_{l=1}^{L}d_k^l \gt {L \over 2}, \hfill \cr 0, & \hbox{otherwise}, \hfill} \right.$$
Suppose the FAR of the single-sensor detection scheme is predefined as α, the FAR of the multi-sensor scheme can be derived as
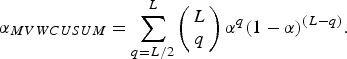 $$\alpha_{MVWCUSUM} = \sum_{q = L/2}^{L} \left(\matrix{L \cr q} \right) \alpha^q (1 - \alpha)^{(L-q)}.$$
Fig. 3 shows the relationship between αMVWCUSUM and α. Inspection of Fig. 3 reveals that the FAR is significantly improved when α is smaller than 0.5. In addition, as more sensors are involved, better FAR improvement can be achieved by the multi-sensor detection scheme. Since less time samples are required, such a multi-sensor scheme can effectively reduce the detection latency. According to Wald's inequality [Reference Wald19], we have the relationship between the predefined FAR α and the threshold h as
 $$e^{-h} = \alpha.$$
Then, we can choose
 $$h = -\ln \alpha.$$
In order to achieve the targeted FAR for various signal models and power events, Monte Carlo simulation is performed to determine the optimal threshold for a given FAR.
FAR improvement with multi-sensors.
V. EXPERIMENTAL EVALUATION
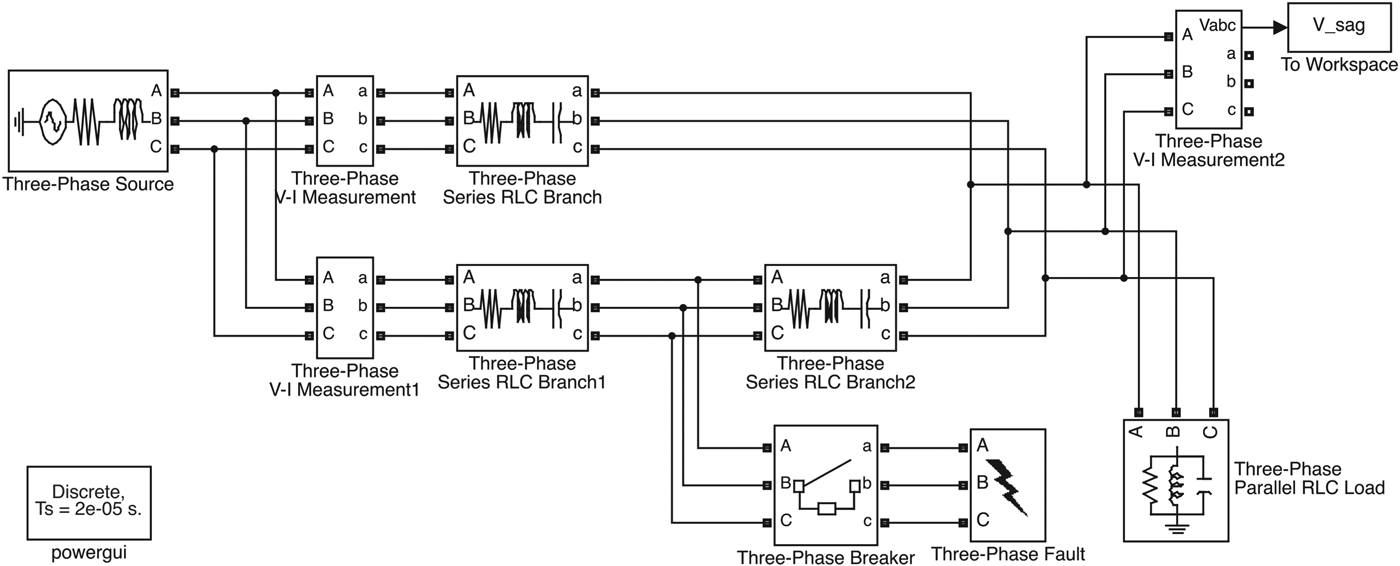
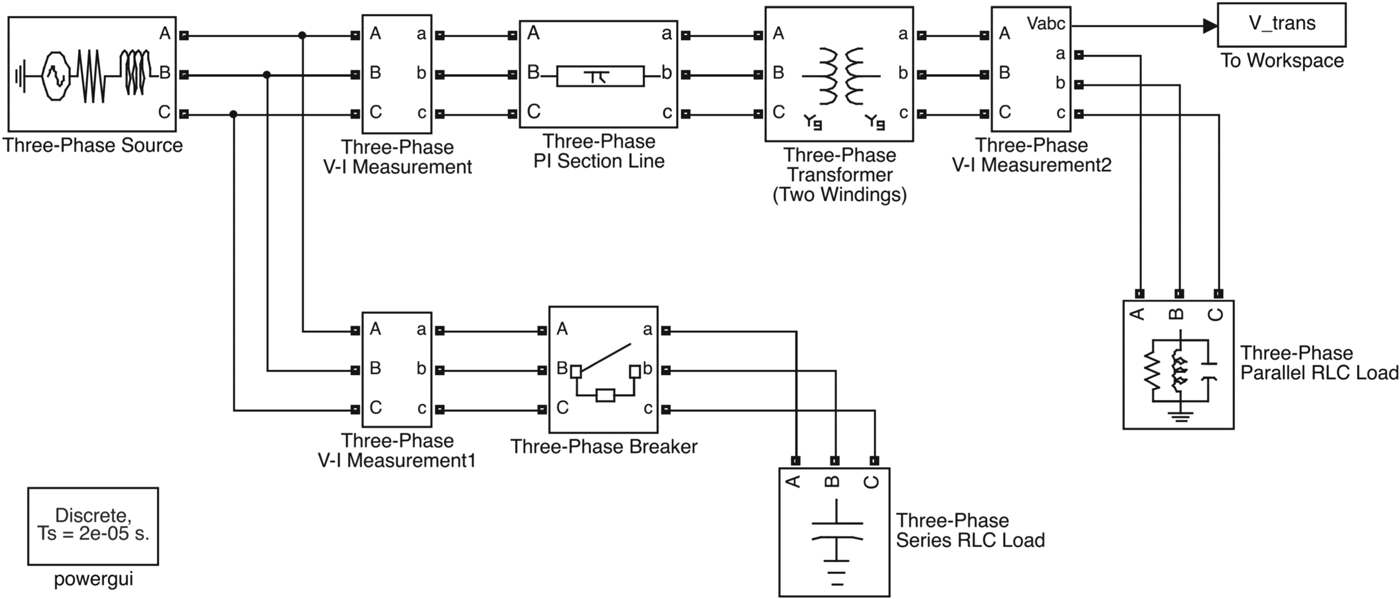
We use Matlab toolbox SimPowerSystems to model and simulate electrical power systems for power quality event signal generation. For example, Figs. 4 and 5 are power system models for voltage sags and voltage transient, respectively. As shown in Fig. 4, the voltage sag event is triggered by the fault on one of the transmission lines. The voltage transient event, shown in Fig. 5, is triggered by the connection of large capacitor banks in order to improve the system power factor. Fig. 6 shows the generated power quality event signals. In this particular example, voltage sag event happens around 0.06 s and lasts until 0.15 s, while transient event occurs at 0.06 s and ends soon.
SimPowerSystem model for voltage sag event.
SimPowerSystem model for voltage transient event.
3-Phase power quality event generated from SimPowerSystems models. (a) Voltage Sag. (b) Transient.
To compare the performance, we define the following averaged mean squared error (MMSE) of the event detection as the performance metric:
 $$MMSE = E[E[(T_e - O_e)^2])],$$
where O e indicates the occurrence time of the power quality event and T e is the detected stopping time.
Fig. 7(a) shows the short-time Fourier transform (STFT) of the transient event signal. The appearance and disappearance of high-frequency components indicates the starting and ending times of the transient event, respectively. Fig. 7(b) shows the analysis result of the MUSIC method. The deformed spectrum indicates the occurrence of the power quality event. Please note, Figs 7(a) and 7(b) shows results of STFT and MUSIC on the pure transient event signal, noise distortion is not included. Due to the periodicity of the sinusoidal power signal, the window size of STFT and MUSIC must be a multiple of the cycle and the sliding step must be a multiple of half cycle to output a steady result during the pre-event phase. Limited by the sliding window effect, both of the STFT and MUSIC method are restricted by a fixed detection resolution (0.01 s). Therefore, neither of them provides quick detection for smart grid system.
STFT and MUSIC results. (a) STFT result on transients event. (b) MUSIC result on transients event.
Fig. 8(a) shows the detection result of the sample-by-sample RMS method on the transient event signal. The detection result is expressed in terms of detection metric derived from the signal amplitude according to various detection methods. The length of the sliding window is set to be a cycle, i.e. 1/60 s. The prominent amplitude deviation around 0.06 s indicates the incidence of the power quality event. Fig. 8(b) shows the detection results of the proposed scheme using generic modeling and event-specific modeling respectively. The turning points shown in Fig. 8(b) indicates the occurrence of the power quality event. To further compare the performance, we plot the averaged detection latency under different signal to noise ratio (SNR). The FARs of both schemes are predefined as  $\alpha = 0.17\%$. As shown in Fig. 8(c), the proposed scheme is able to detect the power quality event faster under the fixed FAR.
RMS versus WCUSUM. (a) RMS-based detection in the time domain. (b) WCUSUM-based detection with various modeling methods in the time domain. (c) Detection latency comparison of various detection methods.
Fig. 9 compares the averaged detection latency under different noise levels. For a larger SNR, the event-specific modeling slightly outperforms the generic modeling in terms of the detection latency. In addition, with one unknown parameter, the event-specific modeling is more computationally efficient than that of the generic modeling.
Detection results of different modeling methods.
Fig. 10 shows the detection results under different uncertainty models. The detection curves of an example event signal shown in Fig. 10(a) present similar performance. Fig. 10(b) further proves the observation. With a large noise level, there is not much performance difference among different uncertainty models. When the noise level increases, however, uniform model and Gaussian model offer superior robustness.
Detection results under different uncertainty models. (a) Detection curves. (b) Detection latency.
Similar to the single-sensor data generation, we use the SimPowerSystem for multi-sensor power quality event data generation. We place multiple sensors along the transmission line in different event models. For example, a generated three-sensor voltage sag signals are shown in Fig. 11. The distance between two sensors is 150 km and sensor VM2 is the closest one to the actual event occurrence location.
Sag signals generated from multi-sensor model.
The MBQCUSUM scheme and the proposed MVWCUSUM scheme are applied to the above multi-sensor power quality signals for event detection. We compare the detection performance of the two schemes in terms of detection delay and FAR with fixed alarm threshold. We can see from Fig. 12(a) that the MBQCUSUM scheme can achieve slightly smaller detection delay (i.e. hundreds of milliseconds) than the MVWCUSUM scheme. According to Fig. 12(b), however, the proposed MVWCUSUM scheme is more robust compared with the MBQCUSUM scheme as the noise level increases.
Performance comparison of BQCUSUM and MVWCUSUM. (a) Detection latency. (b) FAR.
VI. CONCLUSION AND FUTURE WORK
We propose a power quality event detection scheme for power quality monitoring in Smart Grid. Based on the change-point detection theory, we exploit both instantaneous information (real-time power line signal samples) and historical statistics of power line signals to detect the occurrence of power quality event in a quick and reliable manner. We also present a multi-sensor joint detection scheme to further improve the detection performance. We compared the proposed scheme with a group of conventional schemes and shows that our scheme outperforms conventional schemes in detection latency, reliability and robustness. In the future work, we plan to have a deeper analysis of the theoretical properties of the proposed scheme.
ACKNOWLEDGEMENT
The research for this paper was financially supported by the Media Communications Lab of the University of Southern California.
Xingze He received the B.S. and M.S. degrees in the Department of Communication and Information System at Xi'an Jiaotong University, Xi'an, in 2007 and 2009, respectively. He is a Ph.D. candidate in Ming Hsieh Department of Electrical Engineering at the University of Southern California (USC). His current research interest is in the area of Smart Grids, including power quality problem detection, public key cryptography, and homomorphic encryption.
Man-On Pun received the B.Eng. (Hon.) in Electronic Engineering from the Chinese University of Hong Kong in 1996, the M.Eng. degree in Computer Science from University of Tsukuba, Japan in 1999 and the Ph.D. degree in Electrical Engineering from the University of Southern California (USC) in 2006, respectively. He joined Huawei Technologies in Bridgewater, NJ in 2011. Prior to Huawei, he held research positions at Mitsubishi Electric Research Labs (MERL), Cambridge, MA and Princeton University. Dr. Pun received many awards including three best paper awards from Infocom 2009, ICC 2008, and VTC-Fall 2006. He served as an Associate Editor for the IEEE Transactions on Wireless Communications in 2010–2014.
C.C. Jay Kuo received the B.S. degree from the National Taiwan University, Taipei, in 1980 and the M.S. and Ph.D. degrees from the Massachusetts Institute of Technology, Cambridge, in 1985 and 1987, respectively, all in Electrical Engineering. He is the Director of the Signal and Image Processing Institute (SIPI) and Professor of Electrical Engineering, Computer Science and Mathematics at the University of Southern California (USC). His research interests are in the areas of digital image/video analysis and modeling, multimedia data compression, communication and networking, and multimedia database management. Dr. Kuo has guided 108 students to their Ph.D. degrees and supervised 23 postdoctoral research fellows. He is a co-author of about 200 journal papers, 800 conference papers, and 10 books. He is a Fellow of AAAS, IEEE, and SPIE. He is the Editor-in-Chief for the Journal of Visual Communication and Image Representation, and Editor for 10 other international journals. Dr. Kuo received the National Science Foundation Young Investigator Award (NYI) and Presidential Faculty Fellow (PFF) Award in 1992 and 1993, respectively. He was an IEEE Signal Processing Society Distinguished Lecturer in 2006, the recipient of the Electronic Imaging Scientist of the Year Award in 2010 and the holder of the 2010–2011 Fulbright-Nokia Distinguished Chair in Information and Communications Technologies.


 Open access