


I. Introduction
Venture capital (VC) funding is considered the lifeblood of entrepreneurial endeavors. VC-backed startups account for an outsized share of innovation and almost half of all U.S. IPOs.Footnote 1 However, the venture capital market is characterized by severe information asymmetry, and many startup founders struggle to obtain financing. In this article, we study the effects of professional networks created by university attendance on the venture capital market.
We start by documenting the striking fact that one in three deals in the venture capital market involve a startup founder and a VC partner with a shared alma mater. We show that this is driven by venture capital investors tilting their portfolios toward startups from their alma mater, rather than by factors such as colocation or top schools’ tendency to produce both entrepreneurs and VC investors. We then conduct several cross-sectional analyses and examine ex post outcomes to shed light on whether the tilt in portfolios reflects an information advantage, or alternatively, investors’ favoritism toward startups from their alma mater. Our findings throughout demonstrate that alumni networks are a major force shaping venture capital investment and the U.S. entrepreneurial landscape.
Historically, empirical examination of the influence of education networks on early-stage financing has been impeded by two main factors: data limitations and identification challenges. We circumvent the traditional data limitations by using expansive new data from PitchBook on startup founders and VC partners, including their educational backgrounds.Footnote 2 We supplement these data with measures of education quality based on standardized test scores and early-career pay of alumni. Combined, our data allow us to credibly identify shared university alumni status between founders and investors, while controlling for school quality. Throughout the paper, we take several approaches to mitigate identification concerns as we examine the effect of alumni connections on the extensive margin of deal selection, on the intensive margin of deal size, and on postfunding startup outcomes. We utilize carefully constructed proxies for the set of startups that VCs consider, as well as plausibly exogenous departures of VC partners from their investment firms, to isolate the effect of alumni networks.
Our first set of tests examines the extensive margin of venture capital investment (i.e., deal selection). Because investors see many more deals than they take, we start by establishing a proxy for the set of deals that VCs consider. We utilize the broad coverage of PitchBook data, as well as the fact that VCs tend to consider deals from certain industries and geographies (Gompers, Gornall, Kaplan, and Strebulaev (Reference Gompers, Gornall, Kaplan and Strebulaev2020)), to construct VCs’ consideration sets. Specifically, we define a VC’s consideration set (i.e., set of counterfactual investments) as any deals that occurred in the same state–industry–year–deal stage as one of the VC’s actual deals. We contend that these counterfactual startup investments were the most likely to have been considered by the focal VC, given the VC’s investment patterns, and the fact that other investors deemed these startups worthy of funding.
Our first extensive margin test is then a simple linear probability model examining whether a VC investor’s choice between the focal deal and counterfactuals is influenced by the presence or absence of a shared alma mater with founders. We find that it is: the effect of same-alma-mater is to raise deal likelihood by 0.22 percentage points, which corresponds to roughly 10 percent relative to the 2-percent average probability of investment in this panel. While this estimate in itself is not necessarily a causal effect, the cross-sectional variation in the estimated effect is much more consistent with an explanation rooted in human connections, compared to explanations based on omitted variables. Specifically, the effects of alumni connections on investment are stronger when the public signal of founder quality is weaker (when founders attended less prestigious universities), when there is overlap in the years the investor and founder attended the same university, and when founders and investors attended the same school within the university (especially the same MBA program).
Next, we implement an identification strategy based on VC partner hiring and departure events in order to further isolate the effect of alumni connections on venture capital investment. We test whether VC firms increase (decrease) their investment in startups from a newly hired (departed) partner’s alma mater. To conduct these tests, we match treated VC firms (experiencing a hiring or departure) to control VC firms that are in the same state and have similar investment patterns. We then employ a stacked difference-in-differences design around partner hiring/departure events. Intuitively, these tests compare treated VC firms’ likelihood of investing in startups from a certain partner’s alma mater to their likelihood of investing in startups from other universities, all relative to how similar control VC firms are investing. We find strong evidence that alumni networks matter: VCs’ likelihood of investing in startups from a departing partner’s alma mater decreases by 2.8 percentage points postdeparture, which represents 68 percent of the mean in this setting. This reduction in investment persists for at least 3 years postdeparture, suggesting that the knowledge and relationships that partners bring from their alma mater networks are not fully transferred to remaining partners. This finding is consistent with Ewens and Rhodes-Kropf (Reference Ewens and Rhodes-Kropf2015) who document that partner human capital is more important than VC firm organizational capital for explaining VC performance.
The identifying assumption this approach makes is that partner departures are uncorrelated with time-series variation in the number of startups from the partner’s alma mater that merit investment by the VC firm. While prior work suggests that many partner departures are driven by idiosyncratic factors (Ivashina and Lerner (Reference Ivashina and Lerner2019)), one might still be concerned that departures could be correlated with omitted variables. For example, departing partners and founders from their alma mater could share unobserved characteristics, such as insights acquired during their time at university that influence both departures and investments. We take two steps to help mitigate such concerns. First, we document parallel investment trends between treated and control VC firms prior to departures. Second, we study a subsample where the departures are more likely to be idiosyncratic to the partner and hence exogenous in our setting. To do so, we hand-collect information on each VC partner departure and classify them as either exogenous (cases where the partner died, retired, or left the VC industry) versus endogenous (cases where the partner moved within the VC industry).Footnote 3 We confirm that our results hold in the exogenous subsample (and the endogenous one), helping to mitigate concerns about omitted variables.
Our final extensive margin analysis takes advantage of the broad coverage of PitchBook data, which includes even startups that do not receive VC funding. With this broad sample of startups, we run a linear probability model where the dependent variable is an indicator for whether the startup gains funding within its first 2 years. We explain this probability with the proportion of deals in the focal startup’s sector and year of founding that were funded by VCs that attended the same university as the focal startup’s founder. We find strong evidence of a positive relationship between VC partners from an alma mater being active in a sector, and startup founders from that alma mater obtaining funding. We further document that this relationship weakened slightly during the COVID-19 pandemic when there was a reduction in networking events and in-person interactions between university alumni. Overall, this series of results provides strong evidence that alumni networks play a significant role in shaping the extensive margin of venture capital investment.
Our second set of tests studies whether alumni networks influence the intensive margin of investment, in terms of the quantity of funding raised in VC deals. Access to sufficient funding is critical for early-stage startups’ success, and here, too, we find that alumni networks matter. When an investor and founder share an alma mater, the investment amount is 18 percent larger on average. Moreover, the cross-sectional variation in the effect helps mitigate omitted variable concerns: alumni connections have the largest effect on funding when the investor and founder attended their shared alma mater at the same time and studied at the same school within the university. These results hold while controlling for a rich set of startup characteristics and conducting the analysis at various levels, some of which even allow the inclusion of founder-university level fixed effects. The robust positive effect of alumni connections on funding amounts throughout the analysis provides evidence that connections play a critical role in startups’ fundraising success.
Although our results up to this point document a positive effect of alumni network connections on funding likelihood and amount, the efficiency of such relationships is still unclear. If alumni networks help resolve information asymmetry between investors and founders, then connections may improve investment decisions. On the other hand, if the investment patterns we document are driven by favoritism or homophily (a “taste” for founders from the same alma mater), then investment outcomes may be worse.Footnote 4 Our third set of tests explores this tension by examining whether connected investments perform better or worse than nonconnected investments.
We start by testing for differences in connected versus nonconnected startups’ performance within a given investor’s portfolio. We measure startups’ performance based on whether they conduct an IPO postfunding (e.g., Hochberg, Ljungqvist, and Lu (Reference Hochberg, Ljungqvist and Lu2007), Gompers, Mukharlyamov, and Xuan (Reference Gompers, Mukharlyamov and Xuan2016), and Farre-Mensa, Hegde, and Ljungqvist (Reference Farre-Mensa, Hegde and Ljungqvist2020)). We find strong evidence that connected startups outperform their nonconnected counterparts: they are 2.6 percentage points (over 40 percent of the mean) more likely to IPO postfunding. These results hold even while controlling for investor fixed effects and a large set of startup characteristics.
The superior performance of connected investments points toward a mechanism grounded in information advantages rather than favoritism. Yet, such advantages could manifest through either superior ex ante deal selection or through superior ex post monitoring or advising of startups. We delve into this question by examining the performance of connected investments where the relevant VC partner departs the venture capital firm postinvestment (when monitoring would take place). We do not find any significant reduction in performance in such cases compared to cases where the connected partner remains in place. Together, our findings provide evidence that alumni connections help venture capital investors make more informed decisions during the deal selection process.
Our final set of results illustrates the potential distributional consequences of differential access to alumni networks. First, we provide a striking fact: The percentage of deals involving a same-alma-mater investor is over twice as high when the founders are from universities that consider family legacy in admissions. This pattern holds even after conditioning on university academic quality and deal characteristics. Then, we document that legacy schools have fewer students who come from underrepresented minority groups, who are first-generation college students, or who come from families of lower socioeconomic status. Hence, even absent favoritism in VC investment, differential access to valuable alumni networks is an important factor affecting equality of opportunity in entrepreneurship.
Our paper makes several important contributions to the literature. We first add to studies on the determinants of VC financing.Footnote 5 A common thread running through this literature is that resolving information frictions is paramount (see Da Rin, Hellmann, and Puri (Reference Da Rin, Hellmann and Puri2013) for a review). Bernstein, Korteweg, and Laws (Reference Bernstein, Korteweg and Laws2017) provide evidence that information about founding teams is perhaps the most important factor in attracting VC investors. However, the ways in which specific founder attributes influence VC investors’ decision-making remain unclear. We offer the first thorough exploration of how founders’ college alma mater, and their access to alumni networks, influence venture capital financing.Footnote 6
We also contribute to the literature on the effects of education networks in financial markets more broadly. Studies show that school connections improve the performance of mutual fund managers’ investments (Cohen, Frazzini, and Malloy (Reference Cohen, Frazzini and Malloy2008)), sell-side analysts’ stock recommendations (Cohen, Frazzini, and Malloy (Reference Cohen, Frazzini and Malloy2010)), and banks’ loans (Engelberg, Gao, and Parsons (Reference Engelberg, Gao and Parsons2012)). Connections also influence firms’ internal capital markets (Duchin and Sosyura (Reference Duchin and Sosyura2013)). However, the influence of education networks on VC investments is neither well-understood nor easily predicted, for several reasons. First, the most related study in the VC literature, which examines connections between investors in a VC syndicate (rather than between founders and investors), shows that these connections lead to worse decision-making and hurt VC investors’ performance (Gompers et al. (Reference Gompers, Mukharlyamov and Xuan2016)). Second, given the difficulty of obtaining early-stage funding and its importance for startup outcomes (Kerr, Lerner, and Schoar (Reference Kerr, Lerner and Schoar2014)), VC investors may be more likely to derive private utility from investing in companies from their alma mater than in other settings, such as the stock market. Indeed, any favoritism exhibited toward connected startups could outweigh informational advantages and lead to worse performance and distortions in the allocation of capital. We contribute to this literature by providing the first direct evidence that alumni networks affect the extensive and intensive margins of VC investment, and that ultimately, alumni-connected investments outperform nonconnected ones. Our findings show that alumni networks play a major role in shaping venture capital investment and access to entrepreneurship in the United States.
II. Data and Methodology
A. Sample Construction
We construct our main sample using data from PitchBook and the Department of Education’s College Scorecard. PitchBook is the industry-standard for data on VC-backed companies (see, e.g., Brown, Kenyon, and Robinson (Reference Brown, Kenyon and Robinson2020), Retterath and Braun (Reference Retterath and Braun2020), Gompers, Gornall, Kaplan, and Strebulaev (Reference Gompers, Gornall, Kaplan and Strebulaev2021), and Ewens, Gorbenko, and Korteweg (Reference Ewens, Gorbenko and Korteweg2022)).
The College Scorecard data include information on the characteristics of U.S. institutions of higher education, such as enrollment, location, and average scholastic assessment test (SAT) score of students admitted.Footnote 7
We restrict our tests to strictly VC rounds of financing. These are defined (in PitchBook) as “early-stage VC,” “later-stage VC,” or “Seed Round.” We also restrict our investor types to PitchBook labels of “Venture Capital,” “PE/Buyout,” “Growth/Expansion,” “Corporate Venture Capital,” “Family Office,” “Other Private Equity,” or “Not-For-Profit Venture Capital.” Our primary unit of observation for the analysis is at the startup-investor deal level, where a deal is a round of financing for the startup, and investors are lead investors (which PitchBook defines as the investor(s) making the largest investment in the round—85 percent of deals have a single lead). When appropriate, in later analyses, we collapse the data and run tests at less granular levels, such as the deal level.
From PitchBook, we also collect information on the founding team and on partners working for the lead investor. We identify founding team members by keeping company employees with the following titles: Founders, CEO (Chief Executive Officer), CFO (Chief Financial Officer), CTO (Chief Technology Officer), CMO (Chief Marketing Officer), COO (Chief Operating Officer), President, and Owner. We only keep people with these titles who started working for the company before the year the funding round was closed and were still working for the company in the year the round was closed. When employment start and end dates are absent from PitchBook data, we supplement this information using LinkedIn. We call this set of individuals “founding team” or “founders,” although this can include people who joined the company in the early years after its founding.
We collect extensive data on the education history of founders, the funding rounds, and whether the company exited via an initial public offering (IPO) or an acquisition as of June 2021. We then collect information on the education history of the partners working for the lead investor in each funding round.Footnote 8 Because our data on the quality of education institutions is for U.S. colleges and universities, we focus on deals involving U.S.-based startups and investors.
There is no common identifier between College Scorecard and PitchBook. Therefore, we perform a fuzzy name match, which we hand check, between the university attended by the founders and investors in PitchBook and the university name in the College Scorecard database. We match the 485 largest U.S. universities in the PitchBook data to College Scorecard. This results in our sample covering over 90 percent of all the deals in PitchBook (for which we have data on the education history of founders and at least one partner employed by the lead investor at the time of the deal). Hence, our final sample comprises the set of deals in PitchBook from 2000 to 2020 where either the founders of the portfolio company or the partners working for the lead venture capital firm attended one of the 485 largest U.S. universities.
B. Summary Statistics
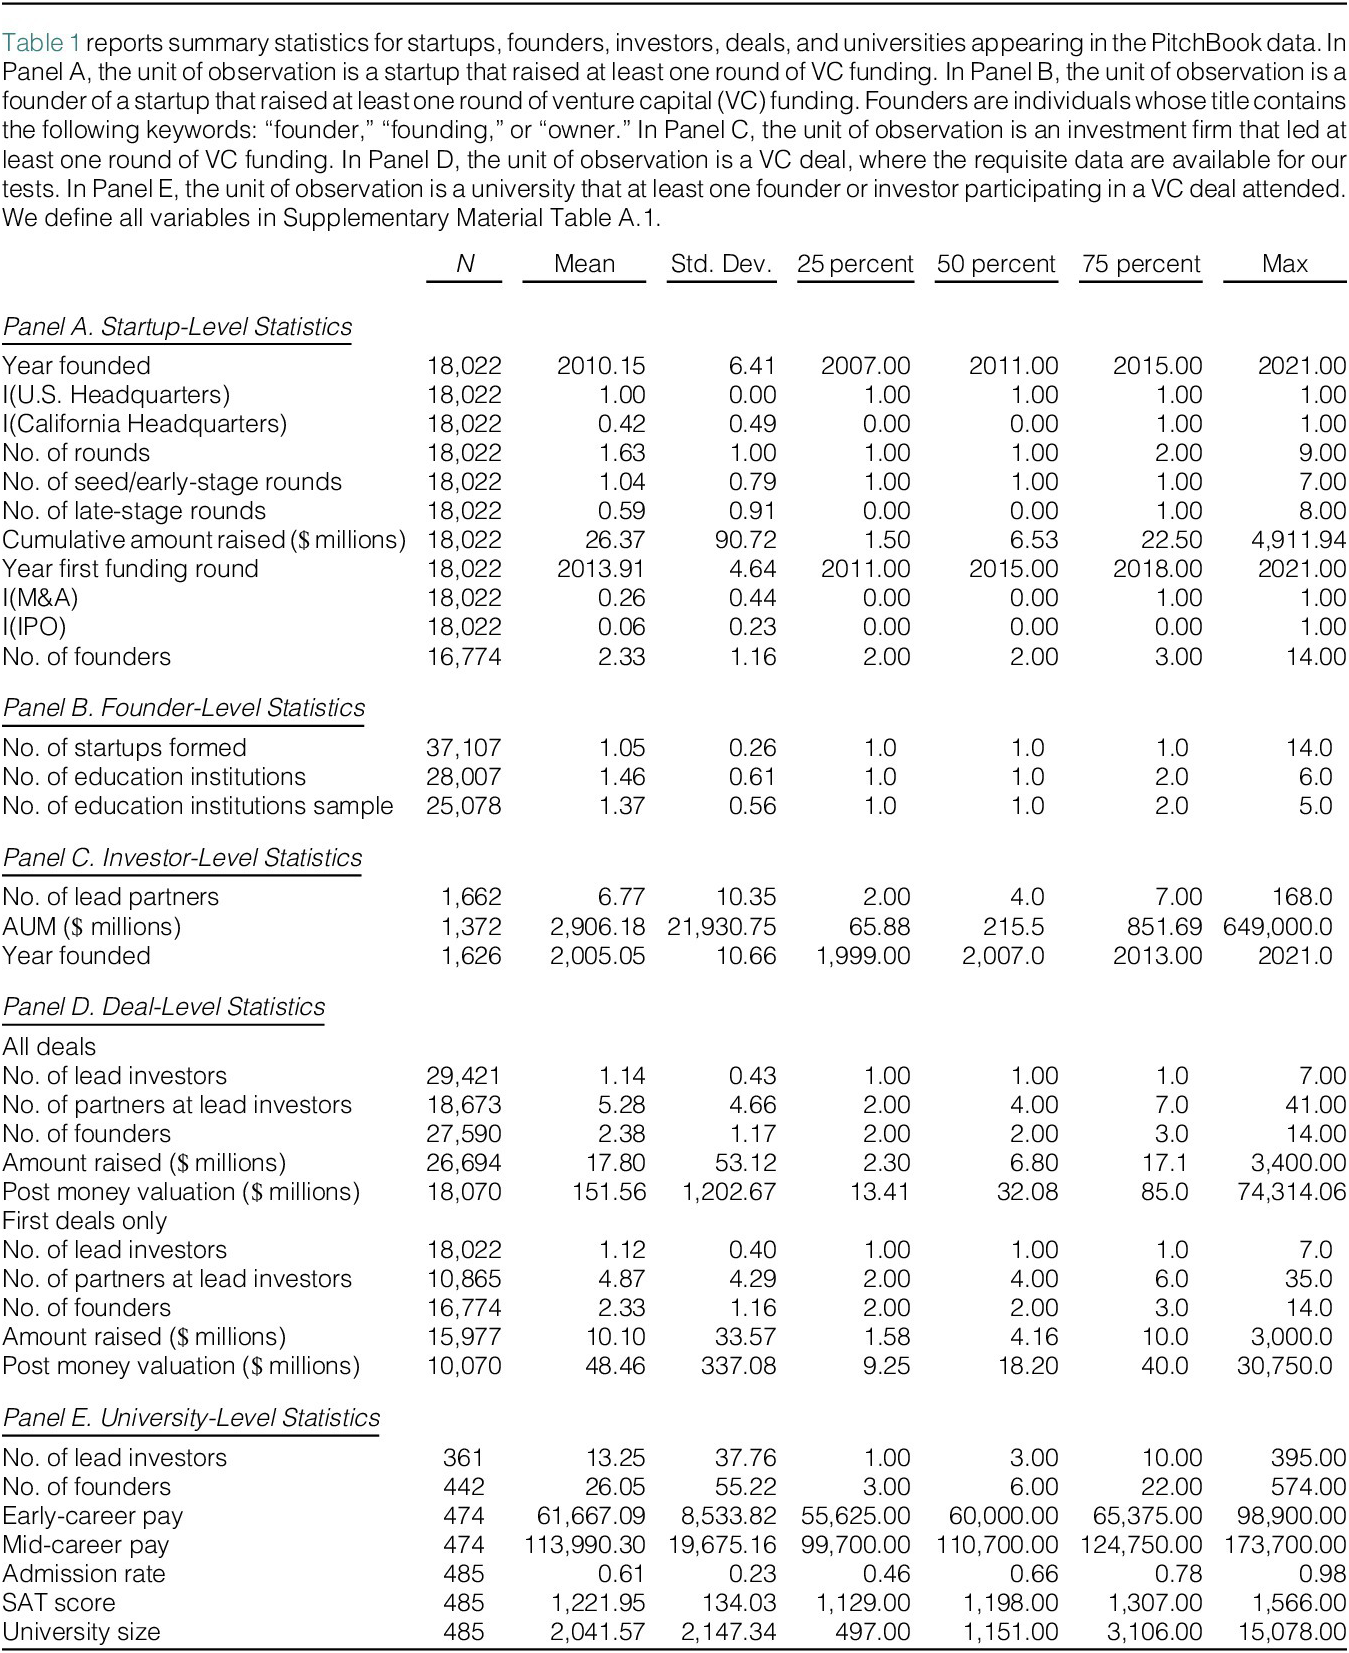
Table 1 presents descriptive statistics of our sample at five different levels: startups, founders, investors, deals, and universities.Footnote 9 The startup-level statistics parallel those documented in extant work. The average startup in our sample has 1.63 rounds, skewed early, with nearly two-thirds being seed rounds instead of later rounds. They raise an average of $26 million in cumulative funding across all their recorded equity deals. The companies also average 2.33 founders. Finally, VC-backed startups in our sample average a 6-percent IPO exit rate and a 26-percent M&A exit rate. See Ewens and Marx (Reference Ewens and Marx2018) and Puri and Zarutskie (Reference Puri and Zarutskie2012) for similar statistics on exits by VC-backed companies.Footnote 10

Moving to founder-level statistics, we see that the average founder attended 1.46 higher educational institutions and founded 1.05 startups. Our investor-level statistics show that the average VC firm had around 7 unique lead partners tied to deals, was founded around 2005, and had an average and median AUM of $2.9 billion and $215 million, respectively.
At the deal level, we provide summary statistics for all deals in our sample, as well as for the first deal for a startup. Since we focus some of our analysis on first deals (see Supplementary Material Table A.2), it is reassuring that the number of lead investors, partners at lead investors, and founders, are all similar across the two groups. Moreover, as expected, both the amount raised and the postmoney valuations are higher on average across all deals than for first deals.
Finally, our university-level statistics show that there is wide variation across schools in the number of lead investors and founders they produce. The statistics also document significant variation in university admission rates, SAT scores, and enrollment size. Hence, we control for this variation in our empirical specifications and use fixed effects where possible.
C. Descriptive Evidence of Alumni Networks’ Importance
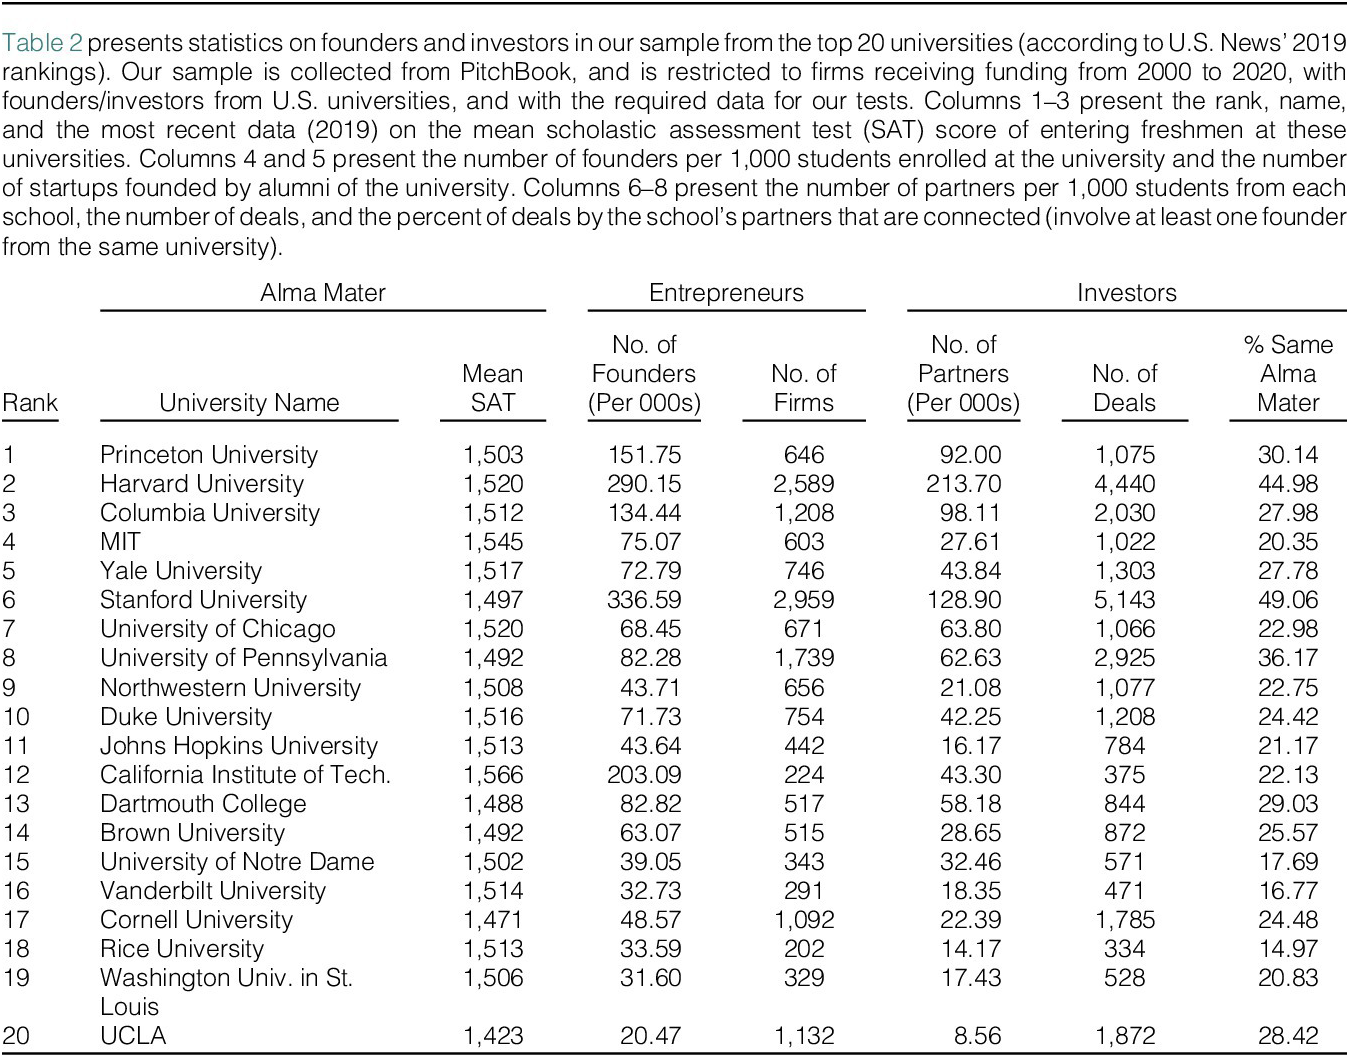
We start by providing simple descriptive evidence on the importance of alumni networks in venture capital financing. We first examine the prevalence of entrepreneurs and founders from each of the top 20 U.S. universities and tabulate the investor–founder pairing rates at each school. We then document that the same alma mater match rates between investors and founders far exceed random matching when we examine all universities in the data.
Table 2 presents statistics on the entrepreneurs and venture capital partners in our sample from the top 20 universities (according to U.S. News 2021 rankings of the best U.S. bachelor’s degree-granting institutions). Columns 1, 2, and 3 present the rank, name, and recent data (2019) on the mean SAT score of accepted freshmen at these universities. Columns 4 and 5 present the number of founders per 1,000 students enrolled at the university and the number of startups founded by alumni of the university. Columns 6, 7, and 8 present the number of investors per 1,000 students from each school, the number of deals, and the percentage of deals that are connected.

From Table 2, we see that the same alma mater match rate is high: VC partners with degrees from top universities tend to invest in startups from their alma mater 20%–40% of the time. Nevertheless, there is also substantial variation in the number of deals involving startups and investors from the same alma mater, even among schools of similar prestige. While 45 percent of the deals with investors from Harvard involve at least one founder from Harvard, only 20 percent of the deals with investors from MIT also involve a founder from MIT.
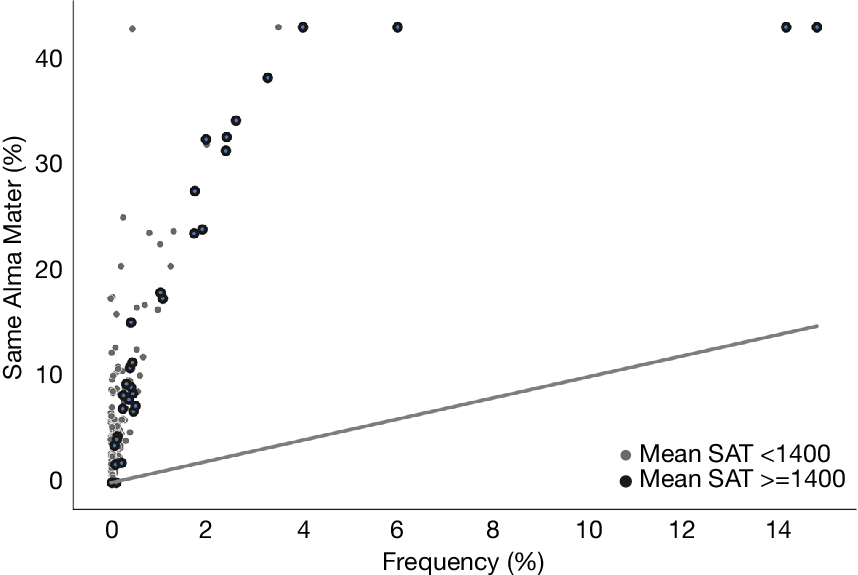
Next, we show that the high rate of matching between founders and investors from the same alma mater holds across the full set of universities in the data. Figure 1 presents a scatter plot of the chances that deals involve an investor from the founders’ (same) alma mater against the proportion of all investors that are from the founders’ alma maters. The solid line represents the 45-degree line, which we would expect the data points to cluster along if founder–investor matching were random. Instead, the figure shows that founders are much more likely to pair with investors from their same alma mater. This result holds for highly selective universities with average SAT scores over 1,400, and appears even slightly stronger for universities with lower average SAT scores.
Figure 1 presents a binned scatter plot of the fraction of deals by founders from a given university that involve a same-alma-mater investor, against the fraction of all venture capital (VC) partners that attended that university. The solid line represents the 45-degree line. Note that if ties were formed at random, we would expect Same Alma Mater to equal Frequency, as the likelihood that a founder draws a partner from their alma mater would equal the frequency of partners from their alma mater in the data. To show most data points, we winsorize Same Alma Mater at 43 percent, which is its 99th percentile value. The darker dots represent universities with an average scholastic assessment test (SAT) score of entering freshmen greater than 1,400, while the grey dots represent universities with SAT scores under 1,400.

III. Empirical Results
A. Alumni Networks and the Extensive Margin of VC Investment
In this section, we test whether alumni network connections influence deal selection (i.e., the extensive margin of venture capital funding). We start by examining whether investors tilt their portfolios toward startups from their alma mater, by comparing their actual investments to counterfactual investments they may have considered. We then explore cross-sectional variation in the effects. Finally, we use two separate event-based identification strategies to further isolate the effect of alumni connections on funding decisions. Our first approach studies changes in investment around VC partner hiring and departure events. Our second approach examines the effect of founders’ potential ties to VC partners on their receipt of VC funding, and how this changed during the COVID-19 pandemic (which limited interactions between university alumni).
1. Investors’ School Ties and Deal Selection
Our first test examines whether investors tilt their portfolios toward startups from their alma mater. This type of analysis is typically challenging because researchers only observe actual investments and do not directly observe the full set of startups that investors considered. To circumvent this issue, we use data on PitchBook deals consummated in the same industry, state, year, and stage as a focal investment, but with a different investor, as stand-ins for the counterfactual investments the focal investor could have made.
We first construct the data set containing both actual investments and investors’ potential/considered deals, then we compute connection measures for both the actual and potential deals. For example, in 2010, True Ventures (a venture capital firm) led a seed round for Duo Security, a Michigan-based startup operating in the Information Technology sector. To create the data for this extensive margin test, we need a set of counterfactuals comprised other Michigan-based startups operating in the Information Technology sector that also received seed financing in 2010, but whose deals True Ventures did not lead. These were GamerSaloon and Local Orbit. So, we view the general partners at True Ventures as deciding between investing in Duo Security or these other two companies. Consequently, in our test data, True Ventures will get three observations (one actual and two counterfactual). We then test whether True Ventures’ decision to invest in Duo instead of GamerSaloon or Local Orbit is influenced by the absence or presence of alumni ties between the partners at True Ventures and the founding teams at Duo, GamerSaloon, and Local Orbit (respectively).
Our extensive margin test is then a linear probability model explaining whether the deal is actually done, with the key independent variable being Same Alma Mater, an indicator equal to 1 if any of the VC partners share an alma mater with any of the founders. From VCs’ perspective, the test evaluates whether they tilt their portfolios toward startups from their alma mater, relative to similar startups they could have invested in. Before formally implementing this test, we first provide graphical evidence that actual deals are more likely to exhibit connections than counterfactuals, then we provide summary statistics for the actual versus counterfactual deals and discuss the controls we will use.
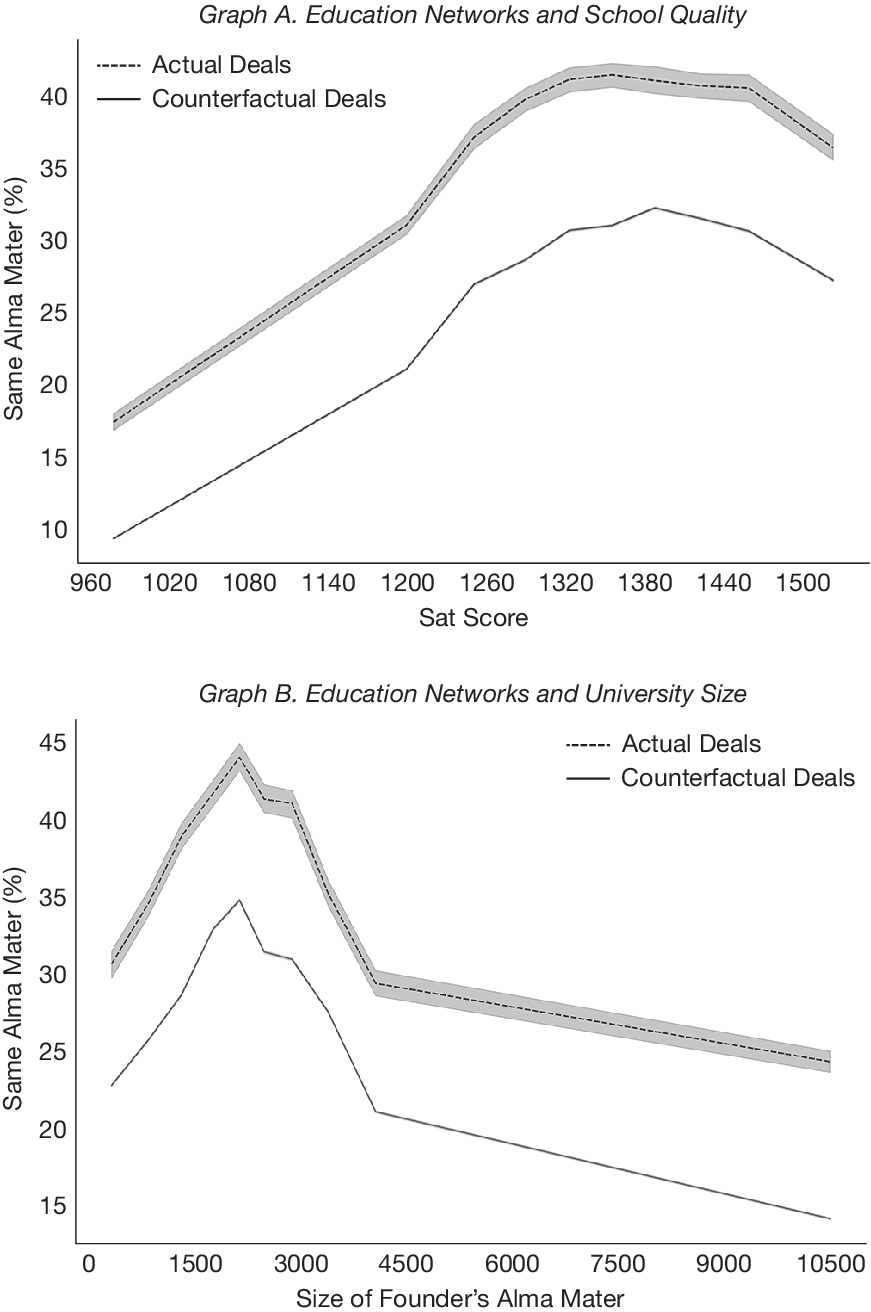
Figure 2 presents binned scatter plots of the fraction of deals that include alumni investors, against the average SAT score of founders’ alma maters (Graph A) and against the average size of founders’ alma maters (Graph B). The plots document the relationship for both the actual deals and the counterfactual deals. The results show that real deals are much more likely to include an alumni investor than counterfactual deals, and that this holds throughout the distribution of founder university quality and size.Footnote 11
Figure 2 presents a binned scatter plot describing the probability that a deal involves an investment firm where at least one partner attended the same university as one of the startup’s founders (Same Alma Mater). In Graph A, deals are sorted into decile bins along the horizontal axis based on the most recent data on the average scholastic assessment test (SAT) score of entering freshmen at the founders’ alma mater (averaged for startups with multiple founders). In Graph B, deals are sorted into decile bins along the horizontal axis based on the most recent data on the number of graduating students from the founders’ alma mater (averaged for startups with multiple founders). Actual Deals shows the actual fraction of deals with university connections between investors and founders. Counterfactual Deals shows the number of university connections among founders and investors where, in addition to the actual deal, investors are also assigned all active deals in the same industry, year, state, and investment stage as the deal that they were actually involved in. The bands around each line represent 95 percent confidence intervals.

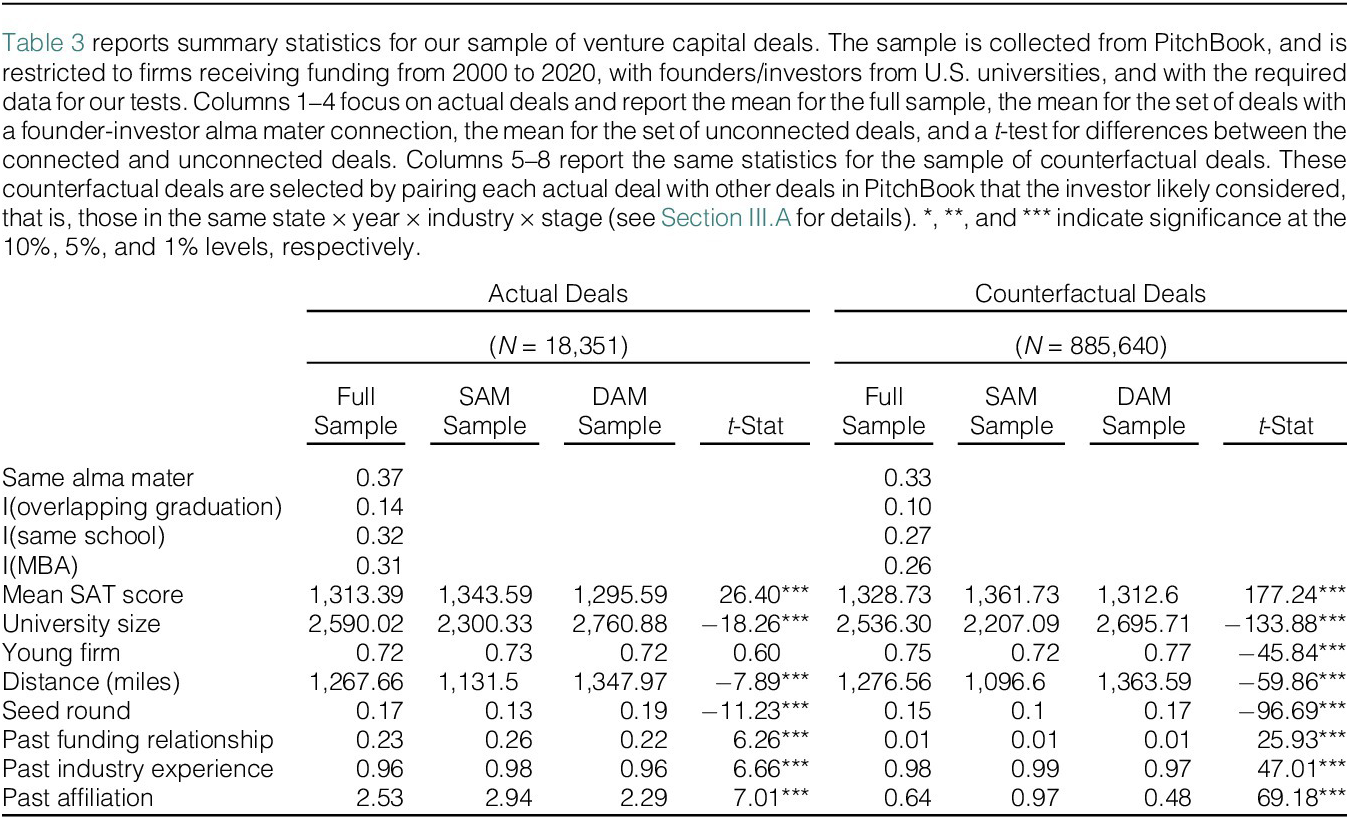
Columns 1–4 of Table 3 present summary statistics for actual deals. A unit of observation in this table is a startup–lead investor–deal pairing. Because 85 percent of deals have a single lead investor, this data set is similar to a deal-level data set. The first row of column 1 shows that 37 percent of deals feature a Same Alma Mater connection. Further statistics in column 1 show that 14 percent of the sample (or roughly a third of the alumni connections) had a founder and investor at the same university overlap for at least 1 year. It is also common for alumni connections to be within the same school (e.g., Columbia Business School rather than Columbia University), and to occur within MBA programs. We explore the incremental effects of these tighter connections in our tests.

Table 3 also reports firm and deal characteristics that are well-known determinants of early-stage financing and serve as controls in our tests. (See, e.g., Bengtsson and Hsu (Reference Bengtsson and Hsu2010), Tian (Reference Tian2011), Howell (Reference Howell2017), and Ewens and Townsend (Reference Ewens and Townsend2020)).
Mean SAT Score is the average SAT score of entering freshmen at the university attended by the founder of the portfolio company (averaged for companies with multiple founders), in the year preceding the investment.
University Size is the class size of graduating students from the founders’ alma mater in the year preceding the deal.
Young Firm is an indicator for the firm being formed less than 5 years prior to the deal date. By design, our sample is largely composed of young firms (72 percent).
Distance is the average distance (in miles) between the portfolio company and the lead investor’s location. Several studies document the importance of distance in early-stage financing (e.g., Sorenson and Stuart (Reference Sorenson and Stuart2001), Chen, Gompers, Kovner, and Lerner (Reference Chen, Gompers, Kovner and Lerner2010), and Tian (Reference Tian2011)).
Seed Round indicates the deal is the first recorded venture capital funding round for the company in PitchBook.
Past Funding Relationship is an indicator for an investor having already invested in the company in an earlier round.
Past Industry Experience is an indicator of when the lead investor in the deal has previously invested in a portfolio company in the same industry sector. PitchBook classifies industries into seven main sectors comprising: Business Products and Services, Consumer Products and Services, Energy, Financial Services, Healthcare, Information Technology, and Materials and Resources.
Past Affiliation captures how often the lead investor in the current round has collaborated with other lead investors that previously funded the startup (see Supplementary Material Appendix C for construction details). Crucially, past affiliation captures whether there is an established relationship between the new and former investors in a startup.
Columns 1–4 present statistics for the full sample, the sample of connected (same alma mater) deals, the sample of unconnected deals, and the difference between connected and unconnected deals. The statistics show that connected deals tend to come from slightly higher SAT score schools and are closer to investors geographically. Columns 5–8 present a similar set of summary statistics for the counterfactual deals. Comparing the sample averages in column 1 to those in column 5 shows that the actual deals are similar to the counterfactual deals on each dimension, except in terms of Past Funding Relationship and Past Affiliation (which is largely by construction given the persistence in VC–startup relationships). Overall, these statistics provide support for using this set of startups as the counterfactual investments VCs may have considered.
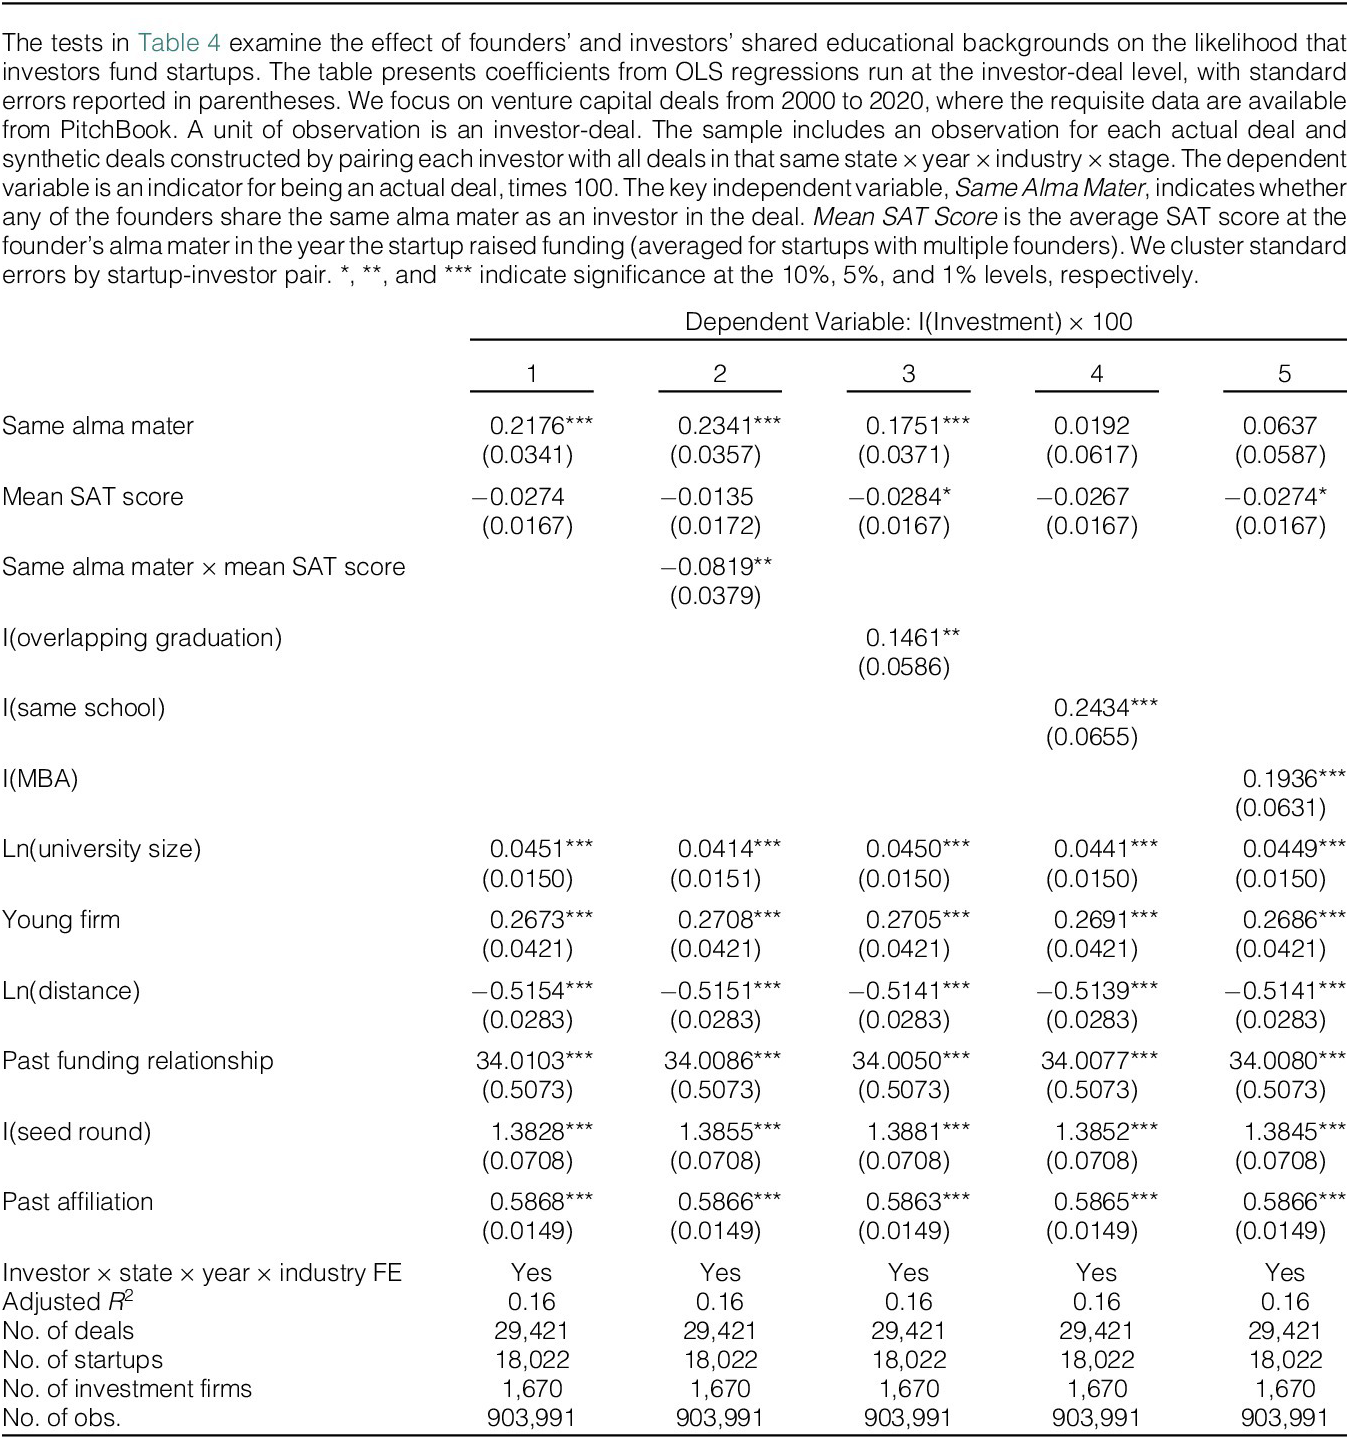
At this point, we implement our extensive margin test for the effect of alumni network connections on deal selection. Table 4 presents the results. Column 1 shows that a shared alma mater between investor and founder increases the likelihood of investment by 0.22 percentage points. Given the mean probability of investment of 2.03 percent, a shared alma mater corresponds to an approximately 10 percent higher likelihood of an investor deciding to fund a startup.

The regression controls for startup firm and deal characteristics, as well as investor–state–year–industry fixed effects. These high-dimensional fixed effects control for many potential confounders at both the investor and startup firm level. For instance, the fixed effects control for factors such as investor size, location, and specialization, as well as startup firms’ state–year–industry. Importantly, the fixed effects ensure that our tests only draw inference from within investors considering similar investment opportunities.
Next, we examine cross-sectional variation in the effect of alumni network connections on investment. In the specification in column 2, we interact Same Alma Mater with Mean SAT Score. The coefficient on the interaction term is negative, showing that when SAT scores of the founder’s university are higher, alumni connections with investors matter less. A 1-standard-deviation increase in the average SAT score of founders’ alma mater decreases the effect of Same Alma Mater on the likelihood of investment by 0.08 percentage points. Assuming university academic quality provides a public signal about founder or startup quality, the smaller effect of alumni connections when the public signal is strong implies partial substitution. Put differently, the finding that connections matter less when founders have strong public signals of their quality suggests that alumni connections’ effect likely stems from their ability to resolve information asymmetries about founder quality.
Columns 3–5 present tests that examine the effects of tighter measures of alumni connections between founders and VC investors. Column 3 shows that the effect of connections nearly doubles when there is time overlap between when the investor and founder attended the same university. Columns 4 and 5 show that the results are largely driven by cases where founders and investors attended the same school within the university, or cases where both graduated with an MBA from the same university, respectively. Importantly, this cross-sectional variation in the effect of alumni connections on investment lines up with an explanation rooted in human connections, but it does not line up with explanations based on omitted variables such as founder/investor quality.
We report the results of several additional tests in the Supplementary Material Table A.2, which documents even stronger effects of alumni connections if we restrict the sample to first deals only, where there is greater information asymmetry about founders and startups. We also document that the results are robust to using measures of school quality based on graduated students’ incomes rather than incoming students’ SAT scores (Supplementary Material Table A.3), or to using continuous measures of alumni connections based on the fraction of founder–investor pairs that attended the same university rather than an indicator variable (see Supplementary Material Table A.4, and Supplementary Material Appendix B for details on variable construction). Finally, we document that our main finding that alumni connections facilitate VC investment is not limited to the (already extensive) PitchBook universe. In Supplementary Material Appendix D, we discuss how we replicate our main result from Table 4 using a sample of startups constructed from LinkedIn data (see Supplementary Material Table A.5).
Overall, the results thus far provide evidence that alumni networks influence the extensive margin of VC investment. The cross-sectional variation in the effect also suggests a mechanism rooted in human connections, rather than an omitted variable explanation. We now turn to two event-based identification strategies to further pin down the alumni network effects documented above.
2. Evidence from VC Partner Moves
Our first identification strategy exploits VC partner hiring and departure events in order to isolate the effect of alumni networks on VC investment. We test whether VC firms increase (decrease) their investment in startups from a newly hired (departed) partner’s alma mater. The identifying assumption is that partner arrivals and/or departures are uncorrelated with time-series variation in the number of viable startups seeking funding from their alma mater. Existing research supports this notion by highlighting that partner moves are typically driven by idiosyncratic factors and partners’ career concerns (Ivashina and Lerner (Reference Ivashina and Lerner2019)).
To conduct our tests, we build an investor-alma mater-year panel covering 2000–2020, where each investor-year has observations for all 485 universities in our sample. The dependent variable is an indicator (multiplied by 100) for whether the VC firm invested in a startup from the given university that year.Footnote 12 We then construct independent variables to implement difference-in-differences tests around partner hiring and departure events. Treated equals 1 if a partner from the VC-alma mater pair is hired (departs) the VC firm during the sample. Post equals 1 after the hiring (departure) event. The interaction term, Treated X Post, is the key object of interest.
We employ a stacked difference-in-differences design following Cengiz, Dube, Lindner, and Zipperer (Reference Cengiz, Dube, Lindner and Zipperer2019) to address potential biases from treatment effect heterogeneity in staggered adoption settings. Recent econometric work has demonstrated that standard two-way fixed effects estimators can produce biased estimates when treatment timing varies across units and treatment effects are heterogeneous (Goodman-Bacon (Reference Goodman-Bacon2021), Baker, Larcker, and Wang (Reference Baker, Larcker and Wang2022)). The stacked approach circumvents these issues by constructing separate data sets for each treatment cohort and their corresponding controls, ensuring that treated units are never compared to already-treated units that could contaminate the estimated treatment effects.
In our implementation, we exploit variation in the timing of partner hiring and departure events across VC firms. For each partner movement event, we construct a cohort-specific data set containing the treated VC firm and a carefully selected set of control firms. The control firm selection follows a multistep matching procedure informed by the institutional features of venture capital markets documented in Gompers et al. (Reference Gompers, Gornall, Kaplan and Strebulaev2020). First, we identify all VC firms operating in the same state as the treated firm, recognizing that venture capital markets exhibit strong geographic clustering. Second, we restrict to firms investing in similar deal stages (e.g., seed, Series A, or later-stage), as investment strategies and evaluation criteria differ markedly across the venture lifecycle. Third, we require control firms to have made their first investment in the same year as the treated firm, ensuring similar organizational maturity and market entry conditions.
Within this set of potential controls, we further refine the match by selecting firms with the most similar cumulative deal count in the year prior to treatment. This step is crucial because firm size and investment frequency strongly predict future investment patterns. The matching procedure thus ensures that control firms represent credible counterfactuals; they operate in similar geographic markets, pursue comparable investment strategies, entered the market under similar conditions, and exhibit similar levels of investment activity. To prevent contamination from overlapping treatment effects, we exclude from the control group any firms that experience their own partner movement within 3 years on either side of the focal event.
After constructing these cohort-specific data sets, we stack them and estimate:
 $$ {Y}_{\mathrm{ifct}}=\unicode{x03B2} \cdot {Treated}_{ifc}\times {\mathrm{Post}}_{ct}+{\unicode{x03B1}}_{ifc}+{\unicode{x03BB}}_{tc}+{\unicode{x025B}}_{ifct,} $$
where $ {Y}_{\mathrm{ifct}} $
indicates whether investor
$ {Y}_{\mathrm{ifct}} $
indicates whether investor $ i $
made an investment in a founder from the university
$ i $
made an investment in a founder from the university $ f $
in year
$ f $
in year $ t $
within event-cohort
$ t $
within event-cohort $ c $
. The coefficient
$ c $
. The coefficient $ \unicode{x03B2} $
captures the change in investment probability following partner movements. We include investor-by-university-by-cohort fixed effects (
$ \unicode{x03B2} $
captures the change in investment probability following partner movements. We include investor-by-university-by-cohort fixed effects ( $ {\alpha}_{\mathrm{ifc}} $
) to absorb time-invariant differences in investment propensities across investor-university pairs within each cohort. Note that the
$ {\alpha}_{\mathrm{ifc}} $
) to absorb time-invariant differences in investment propensities across investor-university pairs within each cohort. Note that the $ {\alpha}_{\mathrm{ifc}} $
subsumes the treatment dummy. Year-by-cohort fixed effects,
$ {\alpha}_{\mathrm{ifc}} $
subsumes the treatment dummy. Year-by-cohort fixed effects, $ {\unicode{x03BB}}_{\mathrm{tc}} $
, control for cohort-specific time trends.
$ {\unicode{x03BB}}_{\mathrm{tc}} $
, control for cohort-specific time trends.
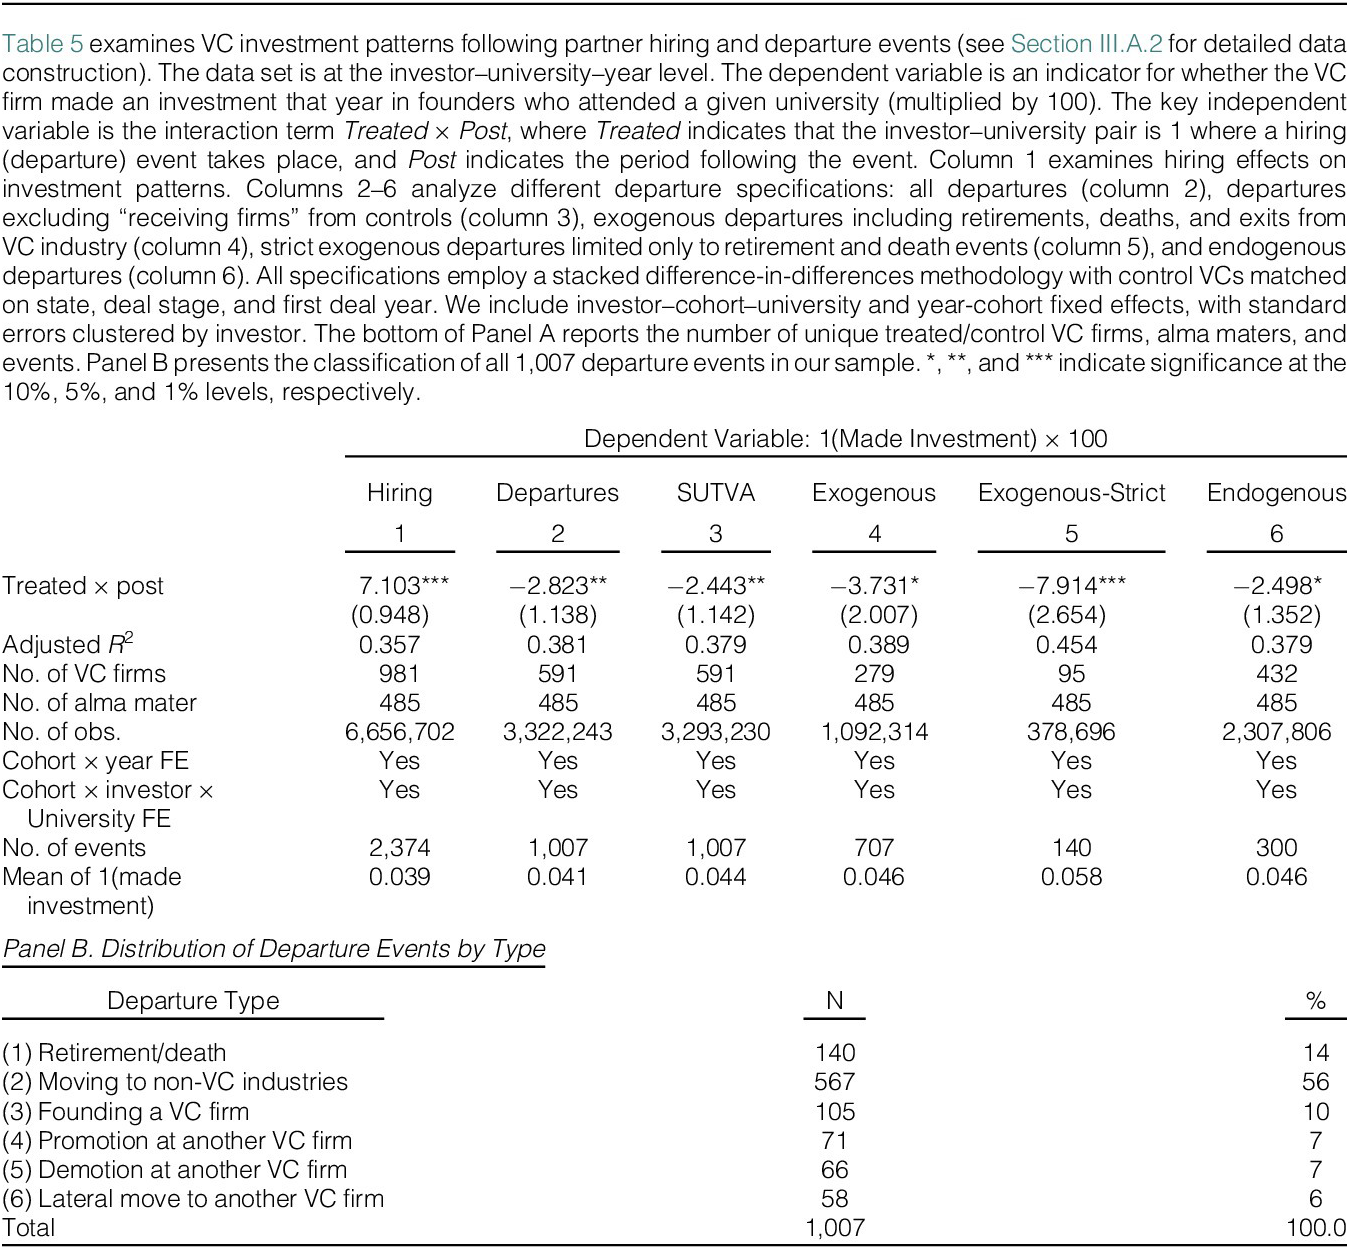
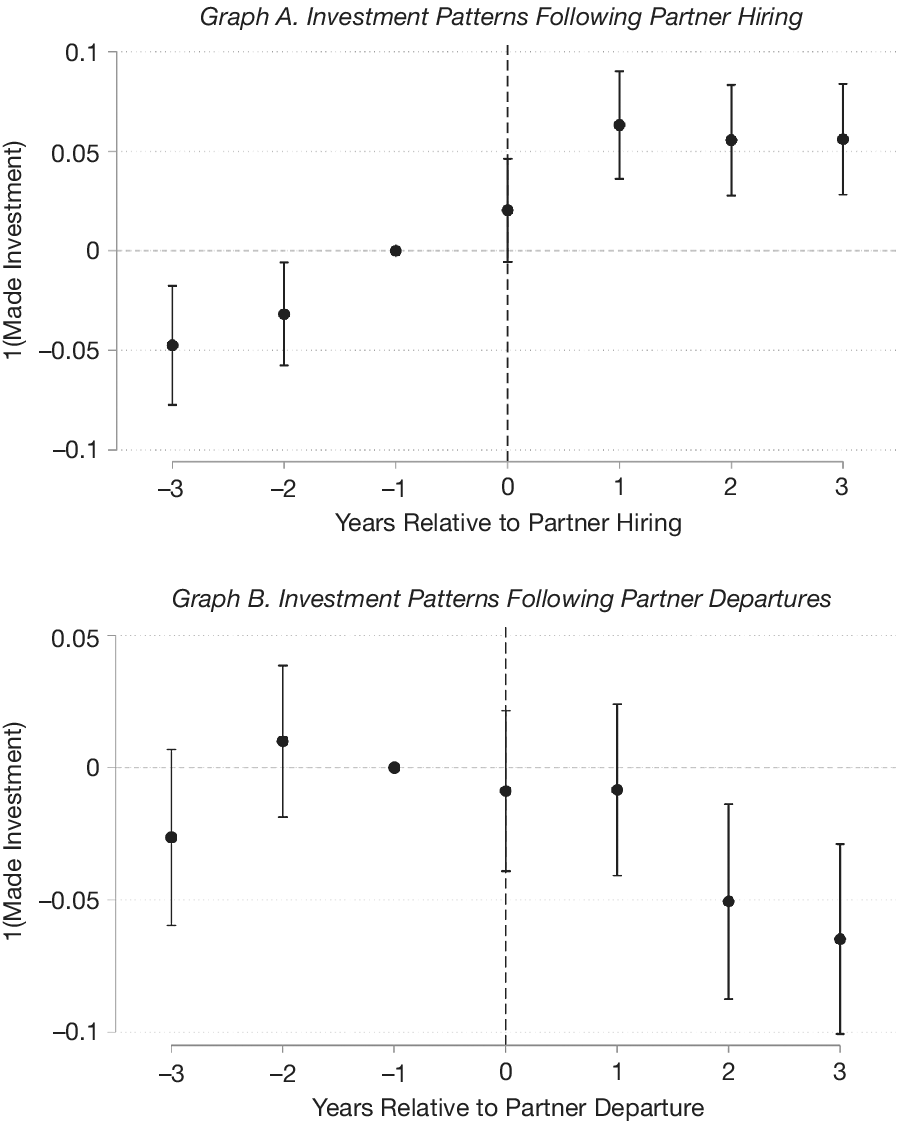
Table 5 presents the results. Column 1 examines the effect of partner hiring on investment patterns. Following the arrival of a new partner, VC firms increase their investments in startups founded by alumni from that partner’s alma mater by 7.2 percentage points. Graph A of Figure 3 presents event-study estimates for each year from −3 to +3 surrounding the partner hiring event. The pre-period exhibits an upward trend, with investments in founders from the given universities already increasing before the partner hire. This pattern suggests that firms may hire partners that graduated from universities where they are already developing stronger investment relationships. While the subsequent increase in investment indicates an effect of the partner addition, the pre-existing positive trend implies that some portion of the 7.2 percentage point estimate may reflect the continuation of organic relationship development rather than the direct effect of the hiring event.

Figure 3 presents event study analyses examining how venture capital (VC) firms’ investment patterns change around partner hiring and departure events. Both panels show stacked differences-in-differences estimates with investor–cohort–university and year–cohort fixed effects, using matched control firms based on deal timing, investor type, headquarters location, and cumulative deal count. The dependent variable is an indicator for whether the firm made an investment in a startup founder from a specific university in a given year. Graph A examines investment patterns around partner hiring events, where treatment occurs when a VC firm hires a partner from a particular university. Graph B analyzes investment patterns around partner departure events, where treatment occurs when a partner leaves the firm. The departure analysis excludes receiving firms from the control group to address potential SUTVA (Stable Unit Treatment Value Assumption) violations. Event time −1 is omitted as the reference category. The vertical dashed line indicates the treatment year (hiring or departure). Error bars represent 95 percent confidence intervals with standard errors clustered by investor firm. Sample period covers 2005–2018 treatment cohorts with a 3-year window around each event.

Columns 2–6 of Table 5 analyze departure events. Column 2 shows that when a partner departs, the VC firm’s likelihood of investment in their alma mater’s founders decreases by 2.8 percentage points. This effect is economically important, representing a decrease of 68 percent relative to the average likelihood of investment (which is reported in the bottom row of Table 5). Graph B of Figure 3 presents event-study estimates for partner departures. In contrast to the hiring analysis, there is no discernible pre-trend in alma mater investments at treated versus control VC firms leading up to partner departures, providing support for the parallel trends assumption. The decline following departure persists over time, with investments remaining lower even 3 years after the partner’s exit. This pattern indicates that the knowledge and relationships that partners bring from their alma mater networks are not fully transferred to remaining partners, resulting in a persistent loss of deal flow from those universities. We view this result as consistent with Ewens and Rhodes-Kropf (Reference Ewens and Rhodes-Kropf2015) who find that partner human capital is several times more important than VC firm organizational capital for explaining VC performance.
Although the parallel trends leading up to partner departures are encouraging, it is important to acknowledge that departures are not randomly assigned, and to address any related concerns. The remaining tests in Table 5 work to address two potential concerns with the difference-in-differences framework. First, we address the possibility of violations of the Stable Unit Treatment Value Assumption (SUTVA) that could arise from departing partners going to work for other VC firms, such as those in the control group. Second, we address concerns about partner departures potentially being correlated with omitted variables. For example, departing partners and their alma mater’s founders might share unobserved characteristics such as family legacies or insights acquired during their time at university that influence both departures and investments. To help mitigate such concerns, we study two subsamples where the departures are more likely to be idiosyncratic to the partner and hence are more likely to be exogenous in our setting.
Column 3 addresses potential SUTVA violations by excluding from the control group any VC firms that hired a departing partner from another firm. This adjustment ensures that our control firms are not themselves experiencing positive treatment effects from receiving experienced partners. The results remain virtually unchanged ( $ -2.4 $
pp), indicating that SUTVA violations do not drive our findings.
$ -2.4 $
pp), indicating that SUTVA violations do not drive our findings.
Next, we classify VC partner departures based on the reason for exit. We start with every partner at the lead investor firms from Table 4, recording when they were last involved in a deal for the firm either as a lead partner or board member on a startup board following an investment. Since first involvement dates do not necessarily correspond to hiring dates, we match partners to their LinkedIn profiles (using URLs provided by PitchBook) and track their complete employment history at these firms. We capture both their earliest start date and latest end date, with the latter determined as the maximum of either the LinkedIn end date or their last involvement with a portfolio company according to PitchBook. When LinkedIn data has gaps, we supplement our search using the Wayback Machine to examine archived firm websites for missing dates. We identify departures as instances where a partner’s end year occurred before 2020 (our sample period end). For these 1,297 partner departures, we manually research each exit’s circumstances through LinkedIn, firm websites, and news articles to determine where partners went after leaving. This allows us to classify departures into six categories: two “exogenous” categories where partners left VC entirely (retirement/death or moving to non-VC industries), and four “endogenous” categories where they remained in venture capital (founding their own fund, promotion at another firm, demotion at another firm, or lateral move).Footnote 13 When LinkedIn shows no subsequent position or our searches yield no results, we search for press releases about retirements or deaths within 2 years of departure. Table 5, Panel B, presents the breakdown by type for the 1,007 departure events we are able to classify and include in the analysis.
In column 4 of Table 5, Panel A, we restrict the analysis to the exogenous departure events. The effect increases slightly in magnitude to $ -3.7 $
percentage points, suggesting that endogenous selection into departure, if anything, attenuates our estimates. Column 5 further restricts the analysis to deaths and retirements, perhaps representing the cleanest (albeit small) sample of exogenous departures. Here, we observe an even stronger effect of partner departures of
$ -3.7 $
percentage points, suggesting that endogenous selection into departure, if anything, attenuates our estimates. Column 5 further restricts the analysis to deaths and retirements, perhaps representing the cleanest (albeit small) sample of exogenous departures. Here, we observe an even stronger effect of partner departures of $ -7.9 $
percentage points. Finally, in column 6, we examine the set of endogenous departures—cases where partners started their own VC firm or moved to other VC firms through promotions, demotions, or lateral transfers. The effect (
$ -7.9 $
percentage points. Finally, in column 6, we examine the set of endogenous departures—cases where partners started their own VC firm or moved to other VC firms through promotions, demotions, or lateral transfers. The effect ( $ -2.5 $
pp) is similar to our baseline estimate. Overall, the tests in Table 5 provide consistent evidence that alumni network connections influence VC investment.
$ -2.5 $
pp) is similar to our baseline estimate. Overall, the tests in Table 5 provide consistent evidence that alumni network connections influence VC investment.
3. Evidence Including Unfunded Startups, as well as the COVID-19 Pandemic Effect
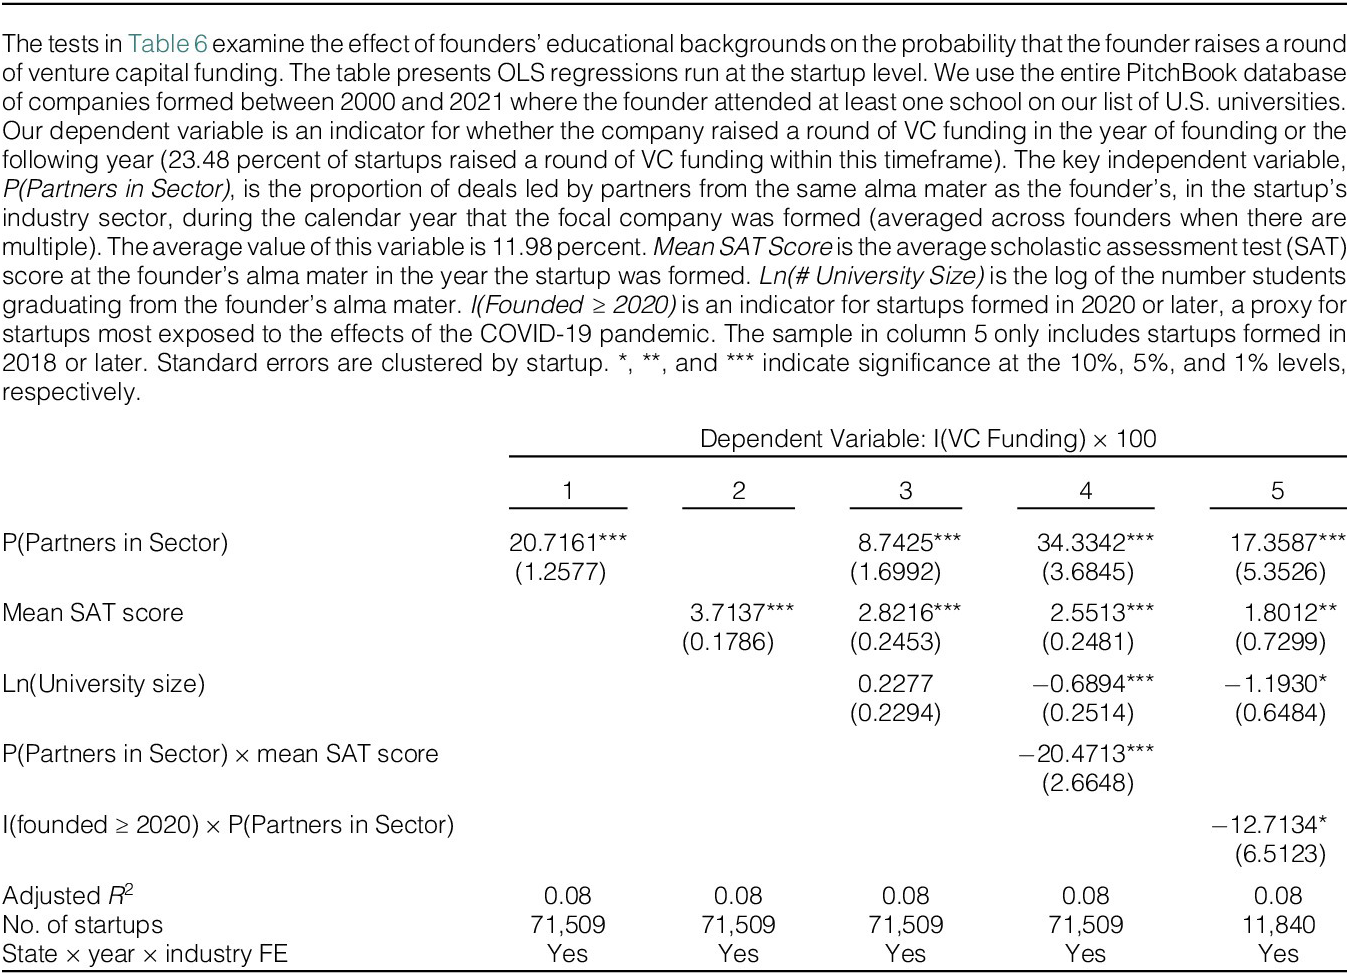
Our next set of tests estimates the effect of founders’ alumni networks on their overall access to VC funding, and how this effect varies in the cross section and time series. These tests use the entire PitchBook database of startups (even those not receiving funding), and are conducted at the startup level. We examine whether having many VC partners from the founders’ alma maters being active in the startup sector (i.e., a strong alumni network), increases the startup’s chances of receiving funding. We also implement a second identification strategy that uses the COVID-19 pandemic as a negative shock to the strength of alumni networks due to the reduction in in-person interactions between university alumni.
Our analysis proceeds as follows: We first recognize that most startups need their first round of funding within 2 years of founding, or else they run out of “friends-and-family” funding. Thus, we set the dependent variable equal to 100 if they receive funding in the year of or the year following founding, and 0 otherwise. Then, we construct a measure of potential alumni-connected VC investors who might provide capital to the focal startup. We create a variable, P(Partners in Sector), that equals the proportion of deals in the focal startup’s industry sector—during the year of focal startup founding—that were led by partners from the focal founder’s alma mater.Footnote 14 This variable still recognizes that VC investors tend to specialize in a sector, but can now be constructed to measure potential alumni connections even for startups not receiving funding. Given the preceding results, we expect this variable to have a positive effect on startups’ likelihood of receiving VC funding.
Table 6 presents our regression results. Column 1 shows that the likelihood that a startup receives VC funding is indeed increasing in P(Partners in Sector). Although these tests include state–year–industry fixed effects, the correlation documented here may still reflect difficult-to-observe differences in startup quality that correlate with founders’ alma maters (i.e., alumni networks). Therefore, we control directly for school quality using Mean SAT Score. Columns 2 and 3 show that while school quality correlates with VC funding, the alumni networks effect is distinct from both school quality and school size effects, and remains large. We also note that the results in column 4, where we interact P(Partners in Sector) with Mean SAT Score, show that alumni networks have the largest impact on access to VC funding for founders from schools with lower SAT Scores. This finding is consistent with earlier tests conducted from the investors’ perspective.

Lastly, we turn to column 5 of Table 6. Here, we focus on startups founded immediately prior to and during the COVID-19 pandemic, limiting the sample to those founded between 2018 and 2021. We then implement a difference-in-differences test, where we interact P(Partners in Sector) with an indicator for the startup being founded in 2020 or later. The results show that the positive effect of alumni networks on startups’ chances of receiving VC funding declined by roughly two-thirds during the pandemic. These results are consistent with in-person interactions and university alumni gatherings contributing to the positive effect of alumni networks on startups’ access to VC funding.
B. School Connections and Investment Size
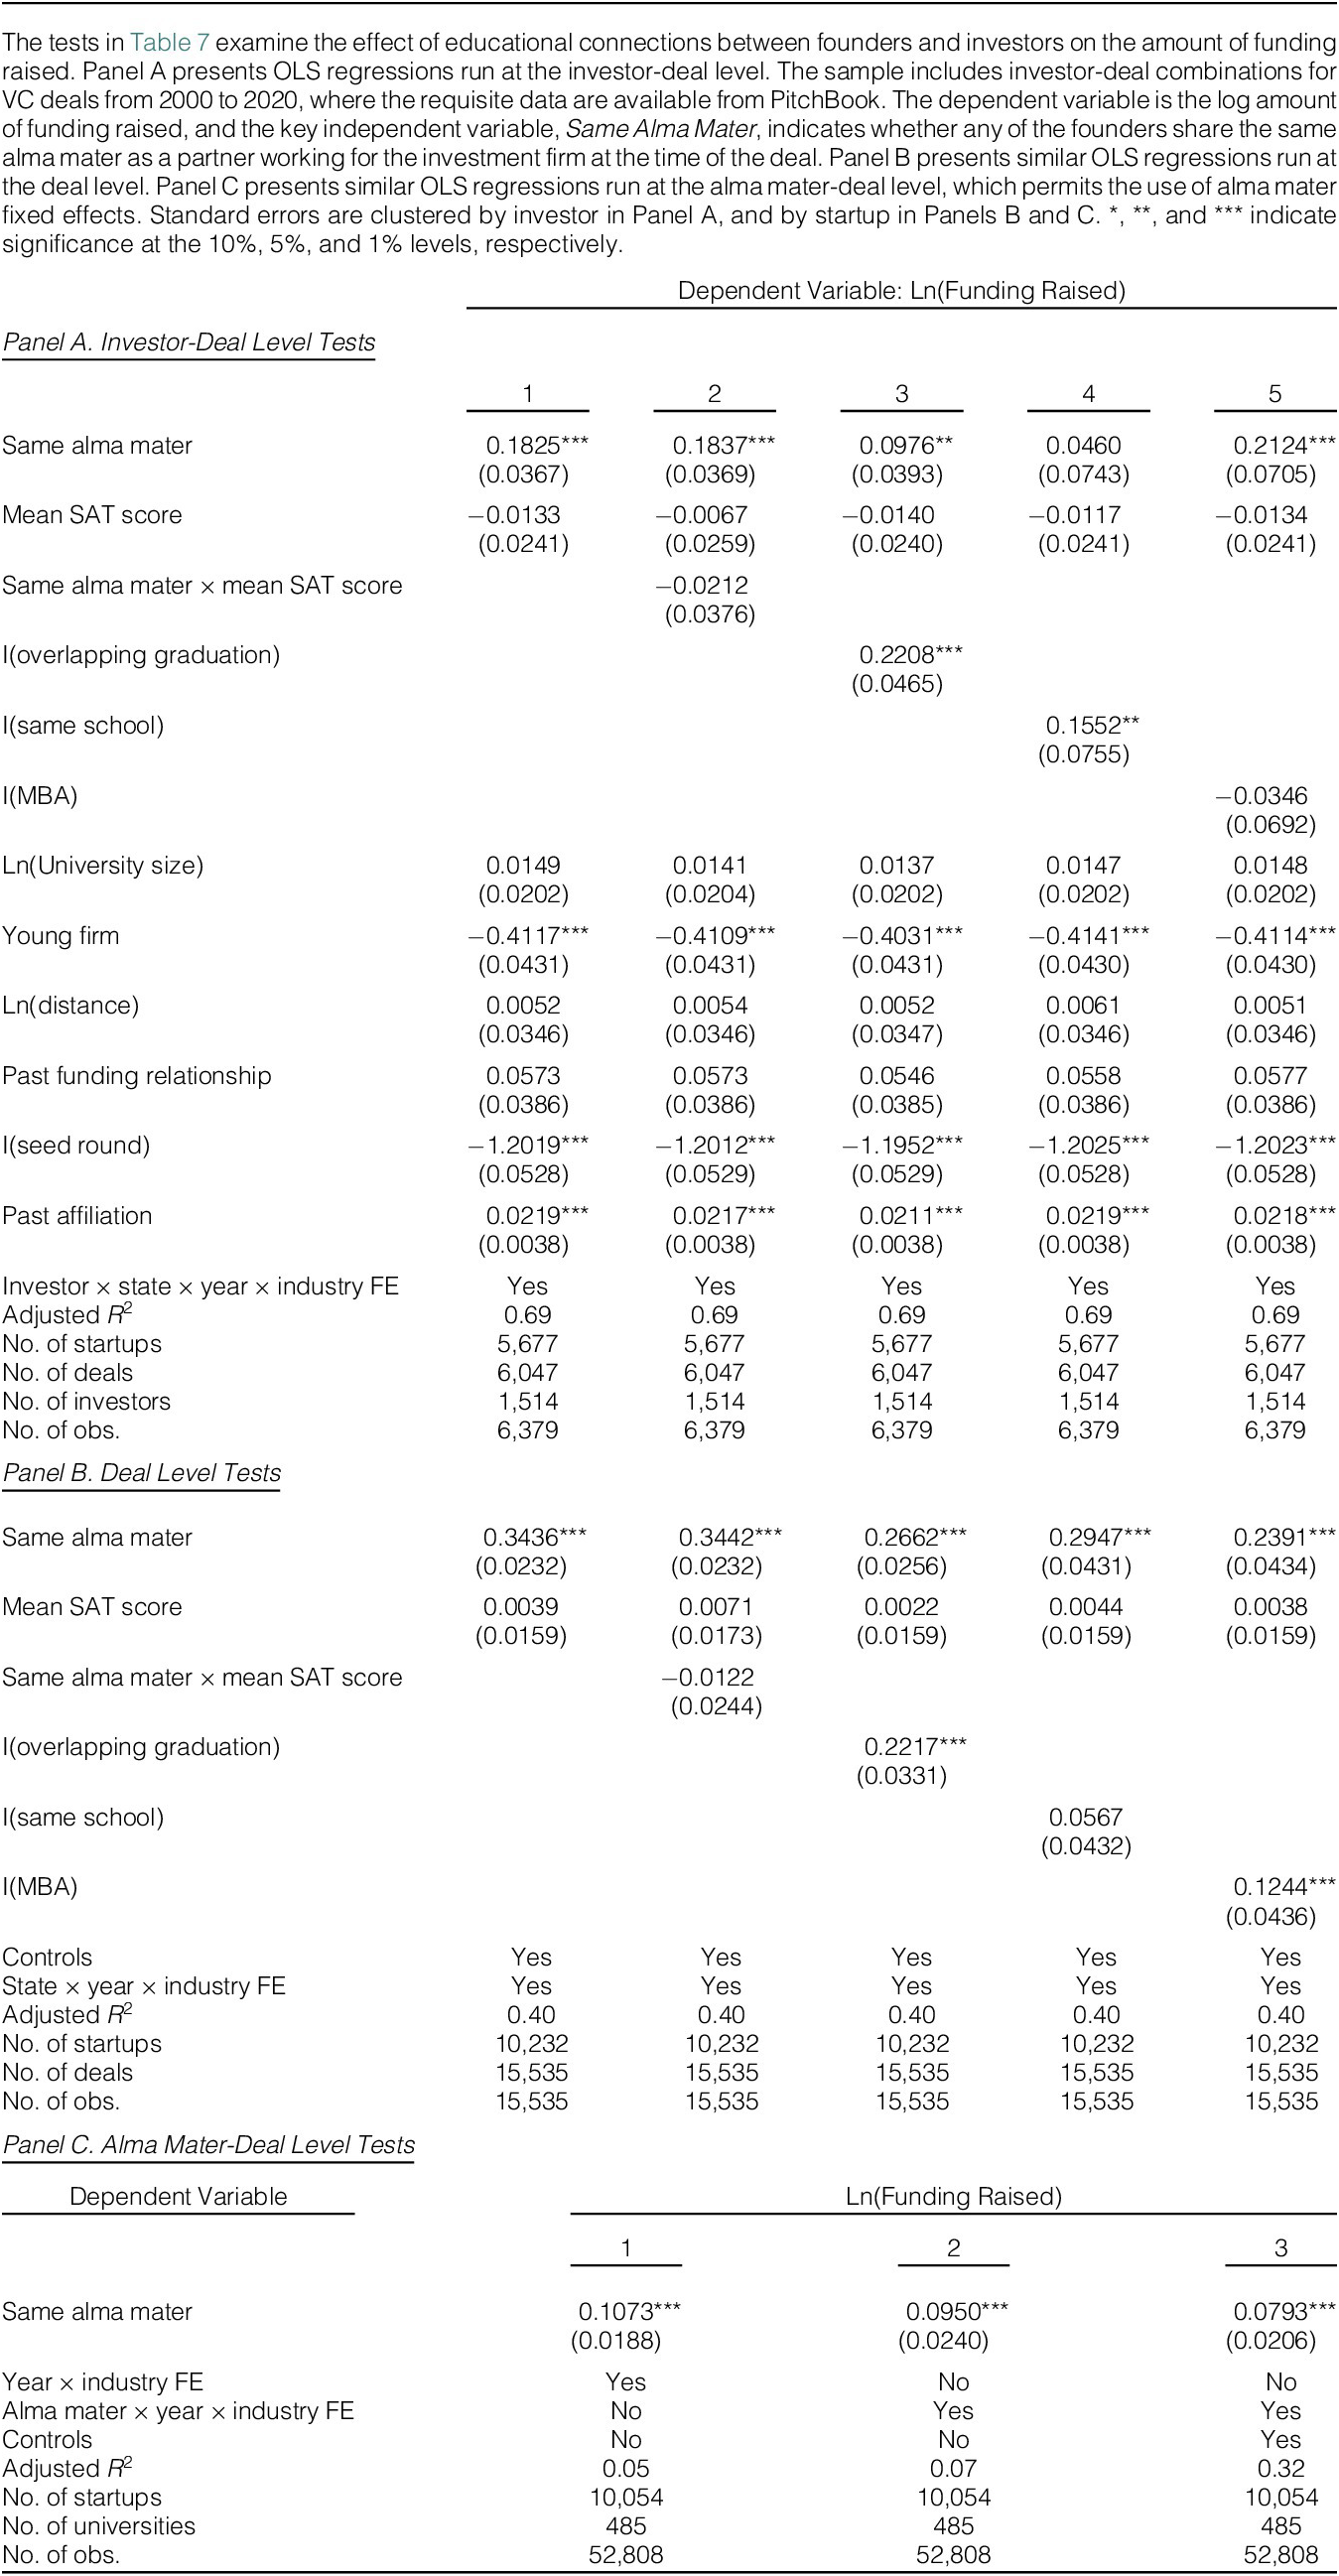
We now turn to the intensive margin of venture capital investment and examine whether school connections encourage investors to place larger bets on startups from their alma mater. We again use data on VC deals from PitchBook. The dependent variable in these tests is the Ln(Funding Raised) for the deal, and we control for the same firm and deal characteristics from prior tests.
In Table 7, we present three panels that vary our units of observation to enable various layers of fixed effects. In Panel A, we study the sample at the investor-deal level, and include investor–state–year–industry fixed effects. Panel B collapses the sample to the deal level and Same Alma Mater indicates whether any of the founders share the same alma mater as any partners working for the lead investor in the deal. Panel C presents tests at the alma mater-deal level, which permits the use of alma mater fixed effects. In the alma mater-deal data, a unit of observation is a deal and a university attended by at least one of the founders—a deal involving three founders that attended three different universities will have three unique observations.

In Panel A of column 1, we see that Same Alma Mater predicts larger venture capital investments. The coefficient of 0.18 implies 18 percent more funding when a founder and investor on the deal attended the same university. This effect is meaningful in economic terms. Given the average funding amount of $17.80 million, an 18-percent increase represents $3 million in additional investment. Importantly, the tight fixed effects ensure that these tests only exploit variation within investor–state–year–industry, helping to reduce omitted variable concerns. Columns 2–5 explore cross-sectional variation in the effect and show that connections have the largest effect on funding when there is overlap in the dates of university attendance, and when the founder and investor were at the same school within the university (such as the business school within the university).
In Panel B, we collapse the sample to the deal level and find similar results. In fact, the coefficient on Same Alma Mater is slightly larger. This is due to the fact that Panel A intentionally limited the analysis to study variation within investors, whereas Panel B exploits more of the variation in the data and allows for comparisons across investors. In either setting, we find that alumni connections lead to significantly larger venture capital investments. Moreover, the cross-sectional variation in each setting lines up with an explanation based on human connections rather than omitted variables.
Finally, Panel C studies the relationship at the alma mater-deal level. This level of analysis allows for the inclusion of alma mater fixed effects, which are important as flexible controls for school unobservables (such as quality) that could influence funding amounts. These tests continue to show a strong positive effect of Same Alma Mater. Overall, we find that alumni network connections influence not only the extensive, but also the intensive margin of venture capital investment.
C. Are Connected Investments More Informed?
In this section, we study the important question of whether the documented effects of alumni connections represent informational advantages versus favoritism. A favoritism explanation could be grounded in either in-group bias or overconfidence bias, where VCs overestimate the skills of founders from their university (e.g., Kahneman (Reference Kahneman2011)). To distinguish between an information channel versus favoritism, we examine postfunding outcomes for the startups in our sample that received funding in 2016 or earlier (to allow time to observe exits). If an information advantage is the primary mechanism, we would expect connected investments to perform at least as well as nonconnected investments. In contrast, if favoritism is driving the tilt in investors’ portfolios, we would expect connected investments to underperform.
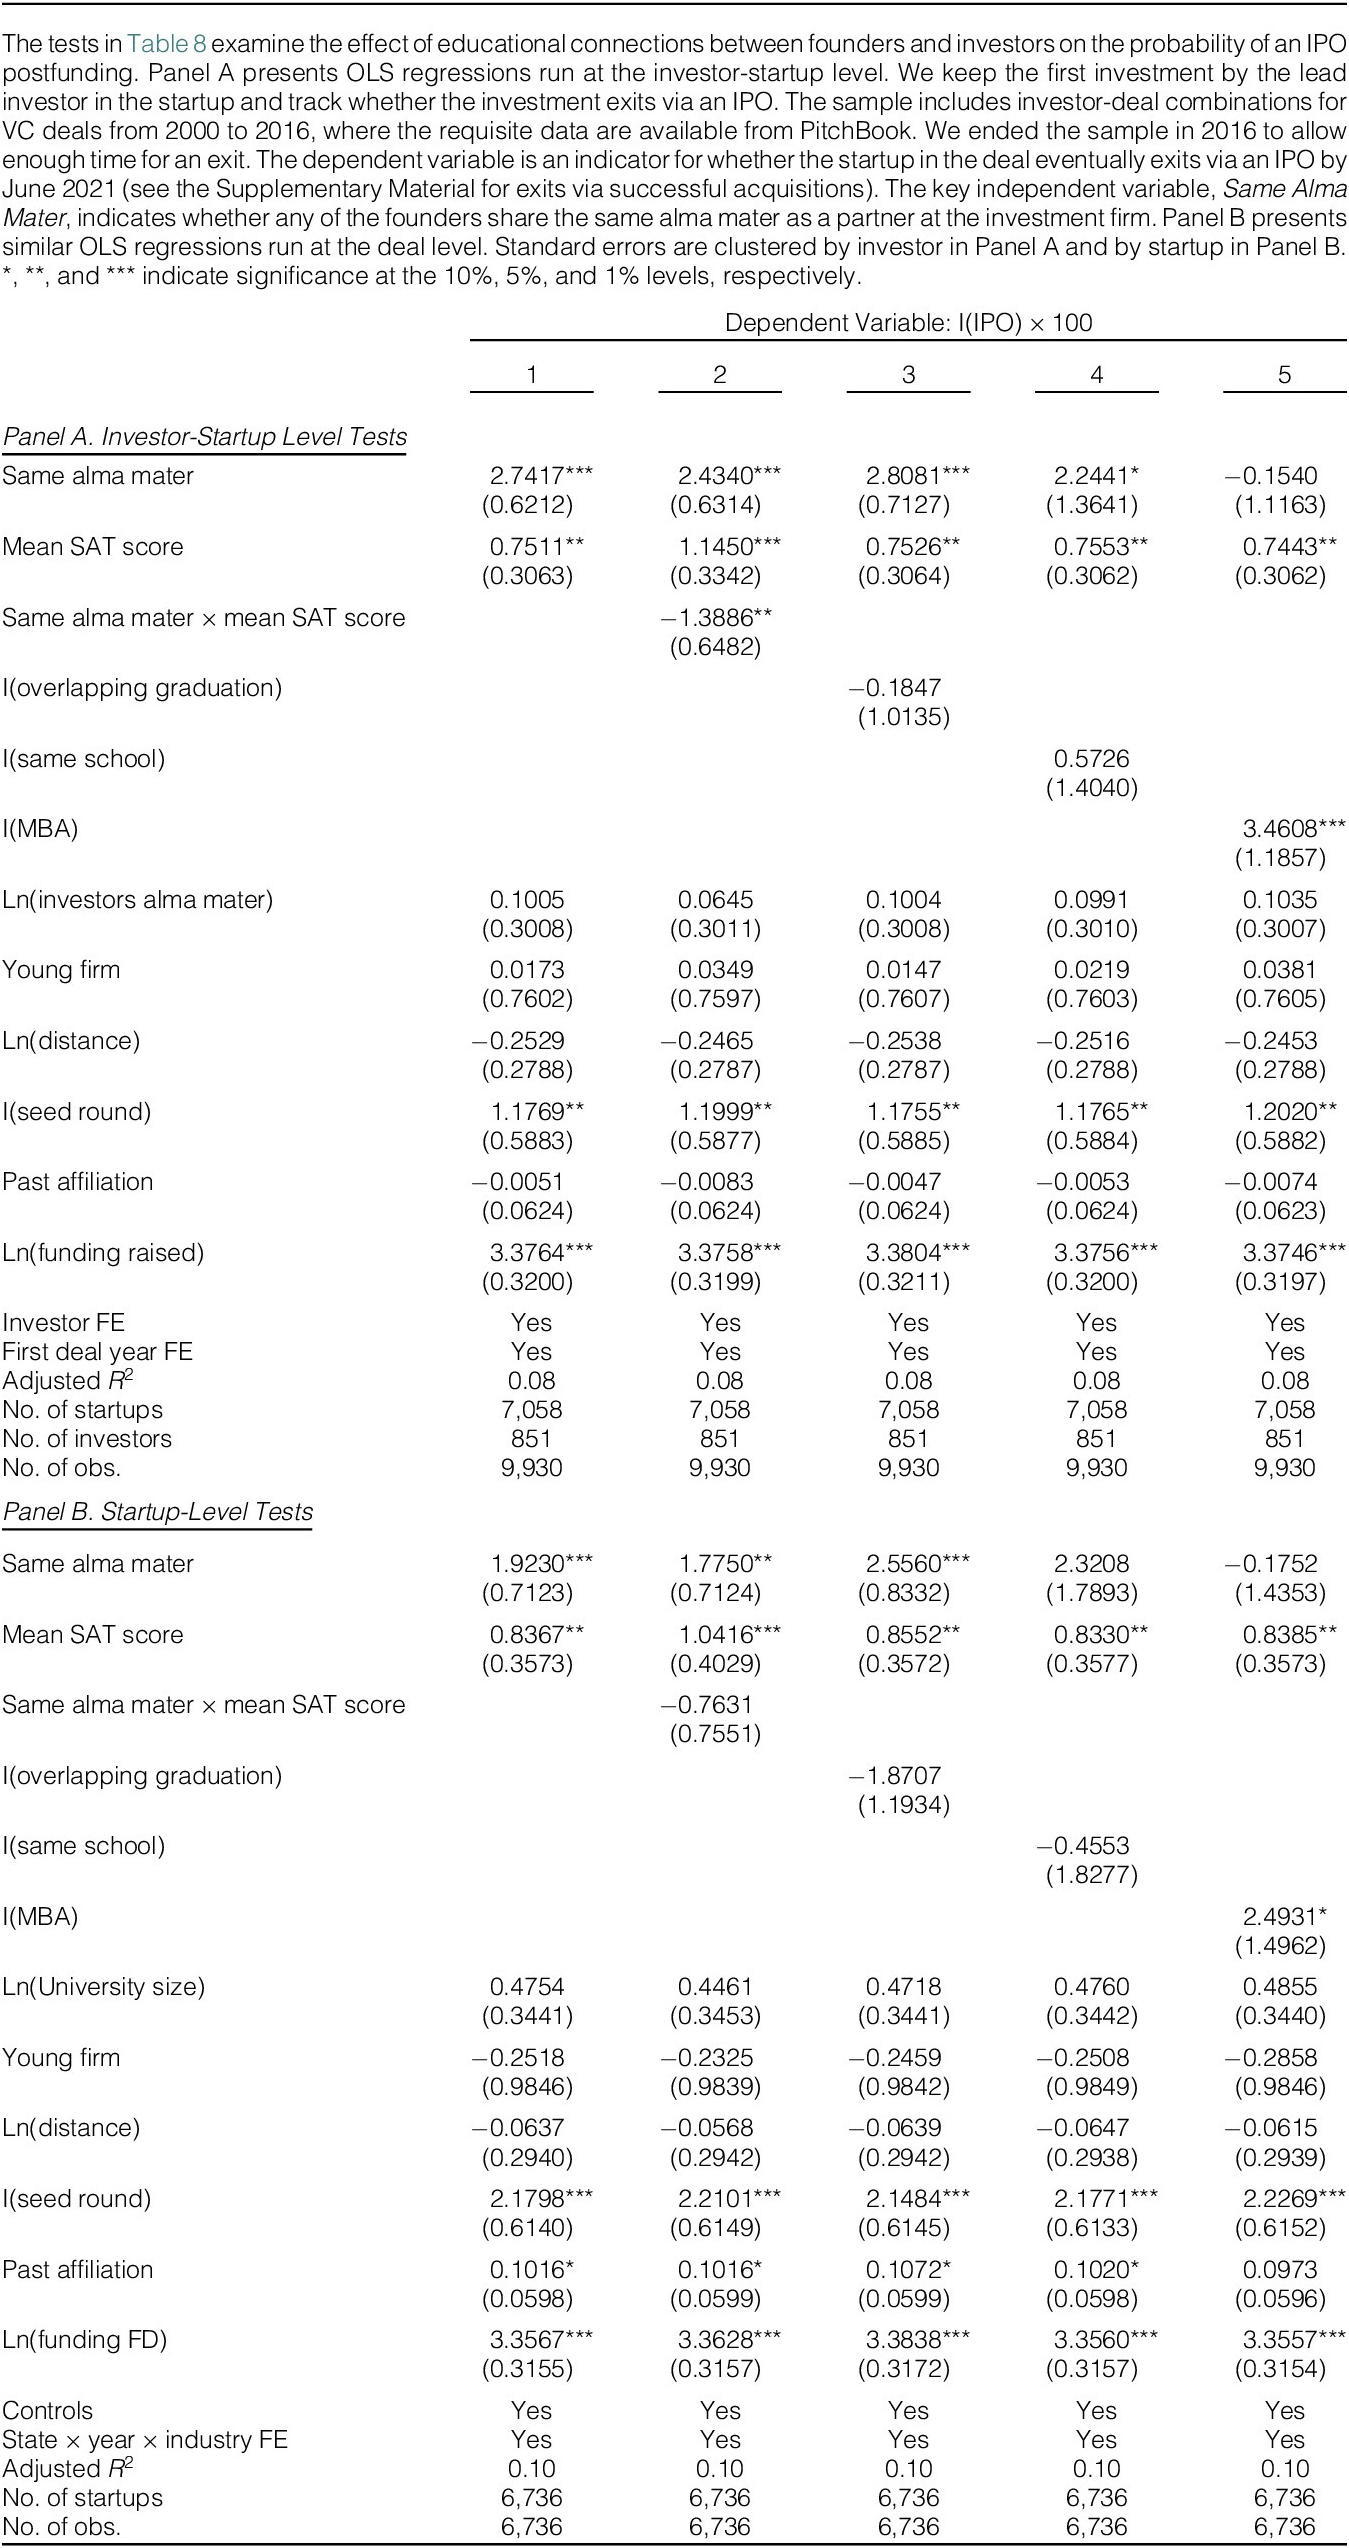
Table 8 presents tests examining startups’ likelihood of an IPO—the primary benchmark for success following early-stage funding (e.g., Hochberg et al. (Reference Hochberg, Ljungqvist and Lu2007), Gompers et al. (Reference Gompers, Mukharlyamov and Xuan2016), and Farre-Mensa et al. (Reference Farre-Mensa, Hegde and Ljungqvist2020)). The tests examine the effect of Same Alma Mater on IPO likelihood with a linear probability model that controls for firm and deal characteristics. In Panel A, we conduct tests at the investor-deal level and include investor fixed effects so that we draw inferences based on variation in outcomes within an investor’s portfolio. In Panel B, we collapse the data to the deal level and conduct similar tests using the broader variation across investors.

Column 1 of Panel A of Table 8 shows that investments in connected startups are 2.7 percentage points more likely to lead to an IPO than nonconnected investments. Taking into account that 7.4 percent of investments lead to an IPO, the Same Alma Mater coefficient represents over a 36-percent increase in the likelihood of a successful exit via an IPO. This contrasts (indirectly) with Gompers et al. (Reference Gompers, Mukharlyamov and Xuan2016), who report a cost of homophily among venture capitalists collaborating on deals by demonstrating that such deals are less likely to result in an IPO. Our findings suggest that relationships between coinvesting VCs of the same ethnicity, as explored by Gompers et al. (Reference Gompers, Mukharlyamov and Xuan2016), and those between founders and investors from the same university are fundamentally different. The latter may be based on shared experiences, values, or knowledge imparted by the same institution, potentially making partnerships more efficient. Whereas the former may be driven by comfort or familiarity. Our findings here also suggest that networks connecting VC partners and founders may play an important role in VC firm performance, complementing work by Hochberg et al. (Reference Hochberg, Ljungqvist and Lu2007) who document the performance implications of VC firm networks formed by portfolio investment syndication.
Columns 2–5 of Table 8 explore cross-sectional variation in the effect of Same Alma Mater on IPO likelihood. The results in column 2 show that the effect is stronger at schools with lower average SAT scores.Footnote 15 Importantly, this matches the cross-sectional variation in the effect of alumni connections on funding likelihood and deal size, suggesting a common mechanism is at work. Columns 3–5 test for incremental effects of overlap in terms of university attendance window, school within the university, or MBA program. Here, only the MBA indicator is statistically significant.
Panel B of Table 8 studies the relationship at the deal level and implements state–year–industry fixed effects. We find broadly similar effects using this sample construction and control strategy. Overall, the tests in this section provide evidence that VCs’ connected investments outperform their nonconnected ones on average. This finding suggests that reduced information asymmetry, rather than favoritism, is likely the primary reason why venture capital investors tilt their portfolios toward startups from their alma mater.
We conduct two additional tests and report the results in the Supplementary Material. First, in Supplementary Material Table A.6, we examine the effect of alumni connections on the likelihood of a successful exit via M&A. The results are weaker than those for IPO exits, but still suggest a positive effect of connections. Second, we conduct a test to distinguish whether the positive effect of Same Alma Mater on IPO likelihood is due to ex ante screening (as prior results suggest) versus ex post monitoring or guidance to startups. Specifically, we ask whether following a VC partner departure, the VC firm’s existing portfolio companies from the departing partner’s alma mater become less likely to exit via IPO (as one would expect if the performance effect were driven by monitoring). Supplementary Material Table A.7 reports these tests, which do not find significant evidence for this ex post monitoring channel.
Legacy Admissions and Access to Valuable Education Networks
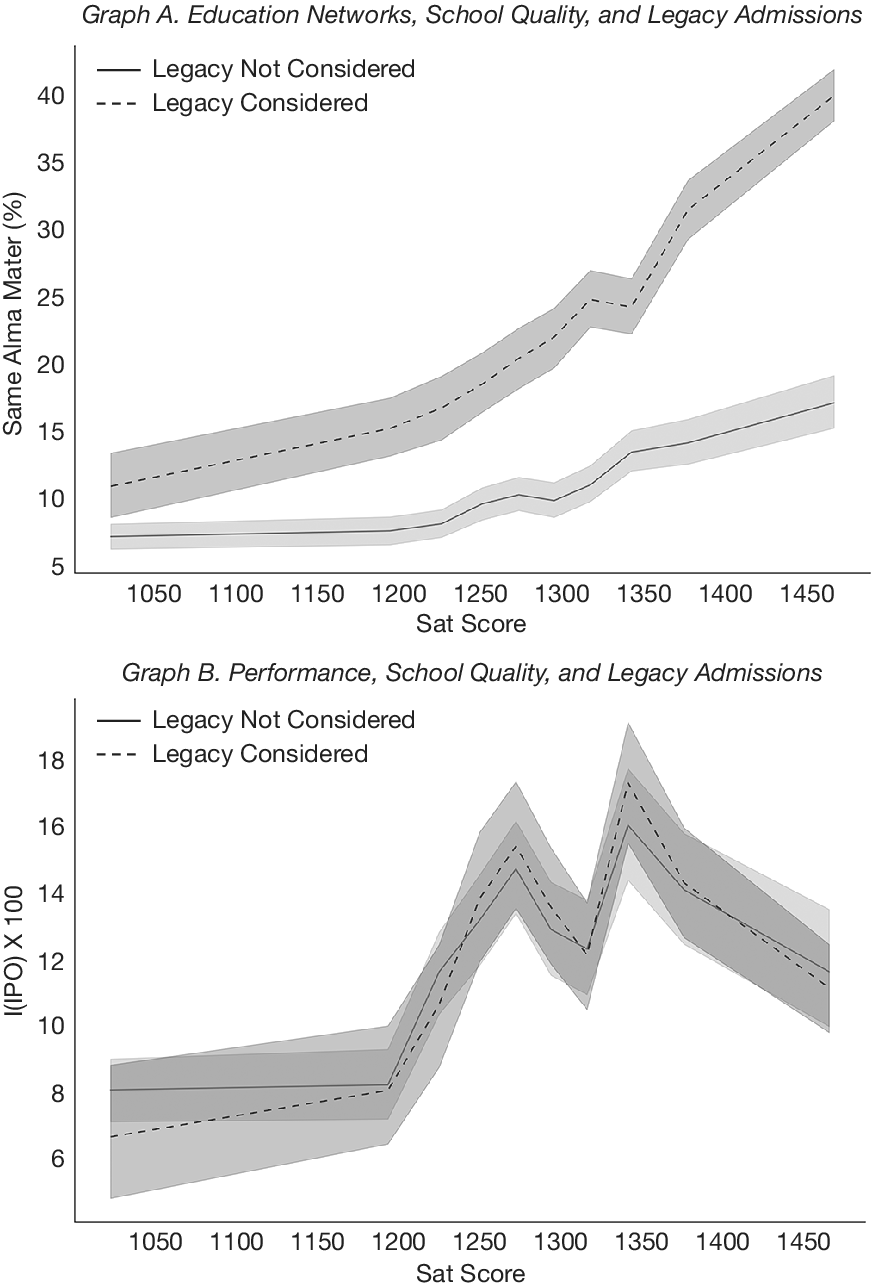
Our final set of tests starts with a striking observation: The percentage of deals involving a same-alma-mater-investor is over twice as high when the founders are from universities that allow legacy admissions.Footnote 16 We document this finding in Figure 4, Graph A, which shows a binned scatter plot of the percentage of deals that are same-alma-mater against the average SAT Score at the founder’s alma mater. We split the graph into cases where legacy is considered in admissions versus cases where it is not. The plot shows that throughout the school quality distribution, the deals involving founders from legacy schools are much more likely to have a same-alma-mater-investor, compared to deals of startups from nonlegacy schools. Further tests in Supplementary Material Table A.8 confirm that this pattern holds even after controlling for a rich set of university and startup characteristics as well as state–year–industry fixed effects.
Figure 4 examines the relationship between universities’ legacy admissions policies, academic quality, and startup outcomes. Graph A presents a binned scatter plot describing the probability that a deal involves an investment firm where at least one partner attended the same university as one of the startup’s founders (Same Alma Mater). Deals are sorted into decile bins along the horizontal axis based on the most recent data on the average scholastic assessment test (SAT) score of entering freshmen at the founders’ alma mater (averaged for startups with multiple founders). Legacy Considered shows the likelihood of a same alma mater match for founders who attended a university that considers legacy admissions. Legacy Not Considered shows the results for founders that attended a school that does not consider legacy admissions. Graph B presents a similar plot, where the dependent variable is an indicator for whether the startup exited via an IPO, times 100. The bands around each line represent 95 percent confidence intervals.

While striking, there could be several explanations for this pattern in the data. First, the pattern could arise because startups from legacy admissions schools are of higher quality and attract within-network investment. Second, it could arise due to favoritism in VC investment within legacy school networks. Or third, this pattern could arise because education networks at legacy admissions schools are particularly thick, well-developed, and valuable to entrepreneurs looking to connect with venture capital investors.
We offer one view on this in Figure 4, Graph B. It plots the percentage of deals where the startup ultimately conducted an IPO against the SAT Score of the founder’s alma mater, split by legacy versus nonlegacy schools. The plot shows that the likelihood of an IPO is nearly identical for legacy and nonlegacy schools across the school quality distribution. This finding cuts against explanations where legacy school startups are systematically better (which would lead to higher IPO likelihoods), or where legacy school startups receive significant favoritism from VC investors (which would lead to lower IPO likelihoods). Instead, the particularly strong tilt in investors’ portfolios at legacy schools, combined with the similar startup performance at these schools, suggests that these education networks are particularly information-rich and valuable to aspiring entrepreneurs.
Our findings here highlight the importance of access to well-developed alumni networks for prospective entrepreneurs looking to obtain VC funding. The benefits hold even after conditioning on school academic quality, naturally raising the question of which students benefit from this increased access to entrepreneurial finance. Supplementary Material Table A.9 summarizes student demographics at legacy admissions schools versus nonlegacy schools. The statistics (from the more recent time period) show that legacy schools have a slightly lower percentage of students from underrepresented minority groups (e.g., 19 percent of their students are Black or Hispanic, compared to 22 percent at nonlegacy schools). An even larger difference arises based on socioeconomic status: Legacy schools have far fewer first-generation college students (20 percent vs. 30 percent) and legacy school students are from families with 28-percent higher incomes ($103 K vs. $80 K). As large as these current differences are, Supplementary Material Table A.9 shows that in most cases, they were even larger historically (in the early 2000s when the data begins). Overall, these patterns highlight the importance of equitable access to valuable university networks when discussing equality of opportunity in entrepreneurship.
IV. Conclusion
Entrepreneurial ventures are key contributors to innovation and long-term economic growth. Yet, founders of early-stage firms often struggle to obtain financing due to the severe information frictions between themselves and venture capitalists. In this article, we present novel evidence that professional networks created by university attendance are a major force working to reduce information asymmetries and facilitate early-stage investment.
Using expansive new data from PitchBook on the education histories of founders and venture capital investors, we document that roughly one-third of VC investments involve a shared university connection between a founder and investor. Our tests show that VCs tilt their portfolios toward startups from their alma mater, even relative to observably similar startups in the same state–industry–year. This occurs at both the extensive margin (deal selection) and the intensive margin (deal size). The superior performance of connected investments suggests that an information advantage, rather than favoritism, drives the tilt in portfolios.
Our findings demonstrate that university networks play an economically important role in reducing information frictions and supporting the flow of capital to early-stage ventures. Further exploration of network effects in early-stage financing, and of the distributional consequences of access to these networks is a promising area for future research.
Supplementary Material
To view supplementary material for this article, please visit http://doi.org/10.1017/S0022109025102354.




 Open access

