


Impact Statement
Recent advance of a microbubble-powered micromotor, also known as a bubble-propelled microrocket, has attracted wide interest due to its fast speed and potential functions based on bubble dyanmics. Unlike the common single-bubble case, this novel double-bubble-powered Janus micromotor has a distinct propulsion mechanism that is closely related to the bubble coalescence process. This study presents the first experiment of the double-bubble-powered Janus micromotor, and our study identifies a universal scaling law containing an inertially limited viscous regime manifesting linear scaling when dimensionless time $\tilde{t}$
< 1 and a 1/2 scaling of the inertial regime located at
$\tilde{t}$
< 1 and a 1/2 scaling of the inertial regime located at $\tilde{t}$
= 1–1000. We also reveal how the interaction between the bubble and Janus micromotor causes a high propulsion speed of ∼0.25 m s−1 and a two-stage displacement after bubble coalescence. These results provide valuable information to better understand the flow physics and improve propulsion efficiency for microbubble propelled swimming devices.
$\tilde{t}$
= 1–1000. We also reveal how the interaction between the bubble and Janus micromotor causes a high propulsion speed of ∼0.25 m s−1 and a two-stage displacement after bubble coalescence. These results provide valuable information to better understand the flow physics and improve propulsion efficiency for microbubble propelled swimming devices.
1. Introduction
The coalescence of bubbles or drops is an essential process involving rapid free surface flows and topological transitions (Eggers et al. Reference Eggers, Sprittles and Snoeijer2025; Kavehpour, Reference Kavehpour2015). Similar to the breakup of fluids (Jo & Revankar, Reference Jo and Revankar2011), coalescence is prevalent in natural flows and industrial applications, and the dynamics and evolution of these self-similar structures have attracted wide research attention. At the surface of the ocean, both the coalescence of underwater bubbles into the atmosphere and the coalescence of sea spray bubbles/drops influence the size distribution of sea surface aerosols. This aspect is considered an important factor in global climate dynamics (Cochran et al. Reference Cochran, Ryder, Grassian and Prather2017; Constante-Amores et al. Reference Constante-Amores, Kahouadji, Batchvarov, Shin, Chergui, Juric and Matar2021; Dubitsky et al. Reference Dubitsky, Mcrae and Bird2023; Shaw & Deike, Reference Shaw and Deike2021). In many industrial applications such as inkjet printing (Lohse, Reference Lohse2022), emulsions (Lee et al. Reference Lee, Sun, Huisman and Lohse2022) and oil recovery (Kavehpour, Reference Kavehpour2015), fine control of generated drops/bubbles relies on a good understanding of the flow physics during the coalescence process. In biology, the coalescence of biomolecular condensates in living cells (Gouveia et al. Reference Gouveia, Brangwynne, Kim, Shaevitz, Petry and Stone2022) is a fundamental mechanism of the coarsening behaviour and is highly important for cellular function; here, the capillary effect combined with various microscopic interactions in complex and confined environments becomes a challenge.
In addition to the above applications, microbubbles that can release surface energy and generate strong hydrodynamic flow have been used as a vital component of novel micro- and nano-devices for transport function and flow manipulation. For instance, these microbubbles can play an important role in the propulsion and manipulation of emerging swimming microrobots (Nourhani et al. Reference Nourhani, Karshalev, Soto and Wang2020; Wang et al. Reference Wang, Chen, Zheng, Yu, Lv, Sheng, Wang, Nie, Li, Guan and Cui2022, Reference Wang, Sheng, Chen, Yang, Li, Li, Nie, Lv, Guo, Cao, Wang, Li, Hu, Guan, Du, Cui and Zheng2024) based on bubble-powered catalytic colloids, known as bubble microrockets (Chamolly et al. Reference Chamolly, Michelin and Lauga2024; Li et al. Reference Li, Rozen and Wang2016; Michelin et al. Reference Michelin, Gallino, Gallaire and Lauga2018). Unlike common single-bubble microrockets, two or more bubbles can be generated when a higher concentration of fuel solution or a larger size catalytic micromotor is used. In these scenarios, bubble coalescence is crucial for achieving high propulsion efficiency, particularly when bubble coalescence reduces the surface area and releases surface energy.
The above applications have motivated studies on the fluid flow and microscale physics that govern coalescence dynamics. At this scale, surface tension is typically the dominant effect in a wide variety of coalescence contexts, such as in the multi-bubble-powered microrockets, because the capillary number Ca (defined as the ratio of viscous force to interfacial force) and the Ohnesorge number Oh (defined as the ratio of viscous time scale to inertial-capillary time scale) are both small. Early work focused on the growth of the neck radius between two coalescing drops, where the surface tension induces a very rapid coalescence motion with a typical Reynolds number Re (defining the ratio of inertial force to viscous force) of up to 100 or even more. For a long time, this rapid growth of the neck was described as an inertial dominant regime in which 1/2 scaling was used to characterise neck growth (Paulsen et al. Reference Paulsen, Burton, Nagel, Appathurai, Harris and Basaran2012; Thoroddsen et al. Reference Thoroddsen, Takehara and Etoh2005). However, linear scaling has also been reported in experimental and numerical studies (Aarts et al. Reference Aarts, Lekkerkerker, Guo, Wegdam and Bonn2005; Burton & Taborek, Reference Burton and Taborek2007; Yao et al. Reference Yao, Maris, Pennington and Seidel2005). Reminiscent of the exact solution in the viscous Stokes regime of Hopper (Reference Hopper2006), this linear scaling should be rational if the viscosity is sufficiently high. The so-called inertially limited viscous regime (ILV regime) at the beginning of coalescence was proposed by Paulsen et al., and its typical linear scaling was established in their coalescence experiments (Paulsen et al. Reference Paulsen, Burton, Nagel, Appathurai, Harris and Basaran2012, Reference Paulsen, Carmigniani, Kannan, Burton and Nagel2014). Since then, viscous-to-inertial cross-over has become the research focus. Negal’s group (Paulsen et al. Reference Paulsen, Burton and Nagel2011, Reference Paulsen, Burton, Nagel, Appathurai, Harris and Basaran2012, Reference Paulsen, Carmigniani, Kannan, Burton and Nagel2014) established a framework to describe the cross-over from a linear scaling of the inertially limited viscous regime to a 1/2 scaling of the inertial coalescence regime for various drops. A universal coalescence scaling theory of the viscous-to-inertial cross-over process for various drops was also identified by Xia et al. (Reference Xia, He and Zhang2019). However, in the meantime, Anthony et al. performed numerical simulations and reported that the results were sensitive to the initial bubble contact conditions and the grid resolution, raising doubts on the existence of the linear ILV regime (Anthony et al. Reference Anthony, Kamat, Thete, Munro, Lister, Harris and Basaran2017, Reference Anthony, Harris and Basaran2020; Eggers et al. Reference Eggers, Sprittles and Snoeijer2025). Nonetheless, for bubble coalescence, especially in the applications of multi-bubble-powered microrockets, the scaling is not clear since the neck growth is influenced by the confinement effect of the catalytic micromotor and the gas generation from chemical reactions.
The complexity of addressing coalescence dynamics originates not only from the singular regime of the contact point of two bubbles, but also from the geometric confinement and the flow of the outer phase fluid. The confinement could impose restrictions on the initial condition as well as hydrodynamic drag to the outer phase flow (Eggers et al. Reference Eggers, Sprittles and Snoeijer2025; Ryu et al. Reference Ryu, Zhang and Anuta2023). Unlike drop coalescence, the outer liquid phase for bubble coalescence also plays a major role because the lubrication flow of the outer fluid confined to a very small gap between the two bubbles becomes significant, even if its viscosity is not very high. Clearly, the solid micromotor in the multi-bubble-powered microrockets inevitably introduces a strong and asymmetric confinement effect that has not been effectively characterised in previous studies. These previous studies have usually analysed the coalescence process far from a solid boundary. Moreover, in the late coalescence process, surface deformation during the merging of two bubbles and the detachment of the merging bubble from the micromotor may also significantly contribute to the propulsion efficiency, whereas detailed experiments and analyses are still needed.
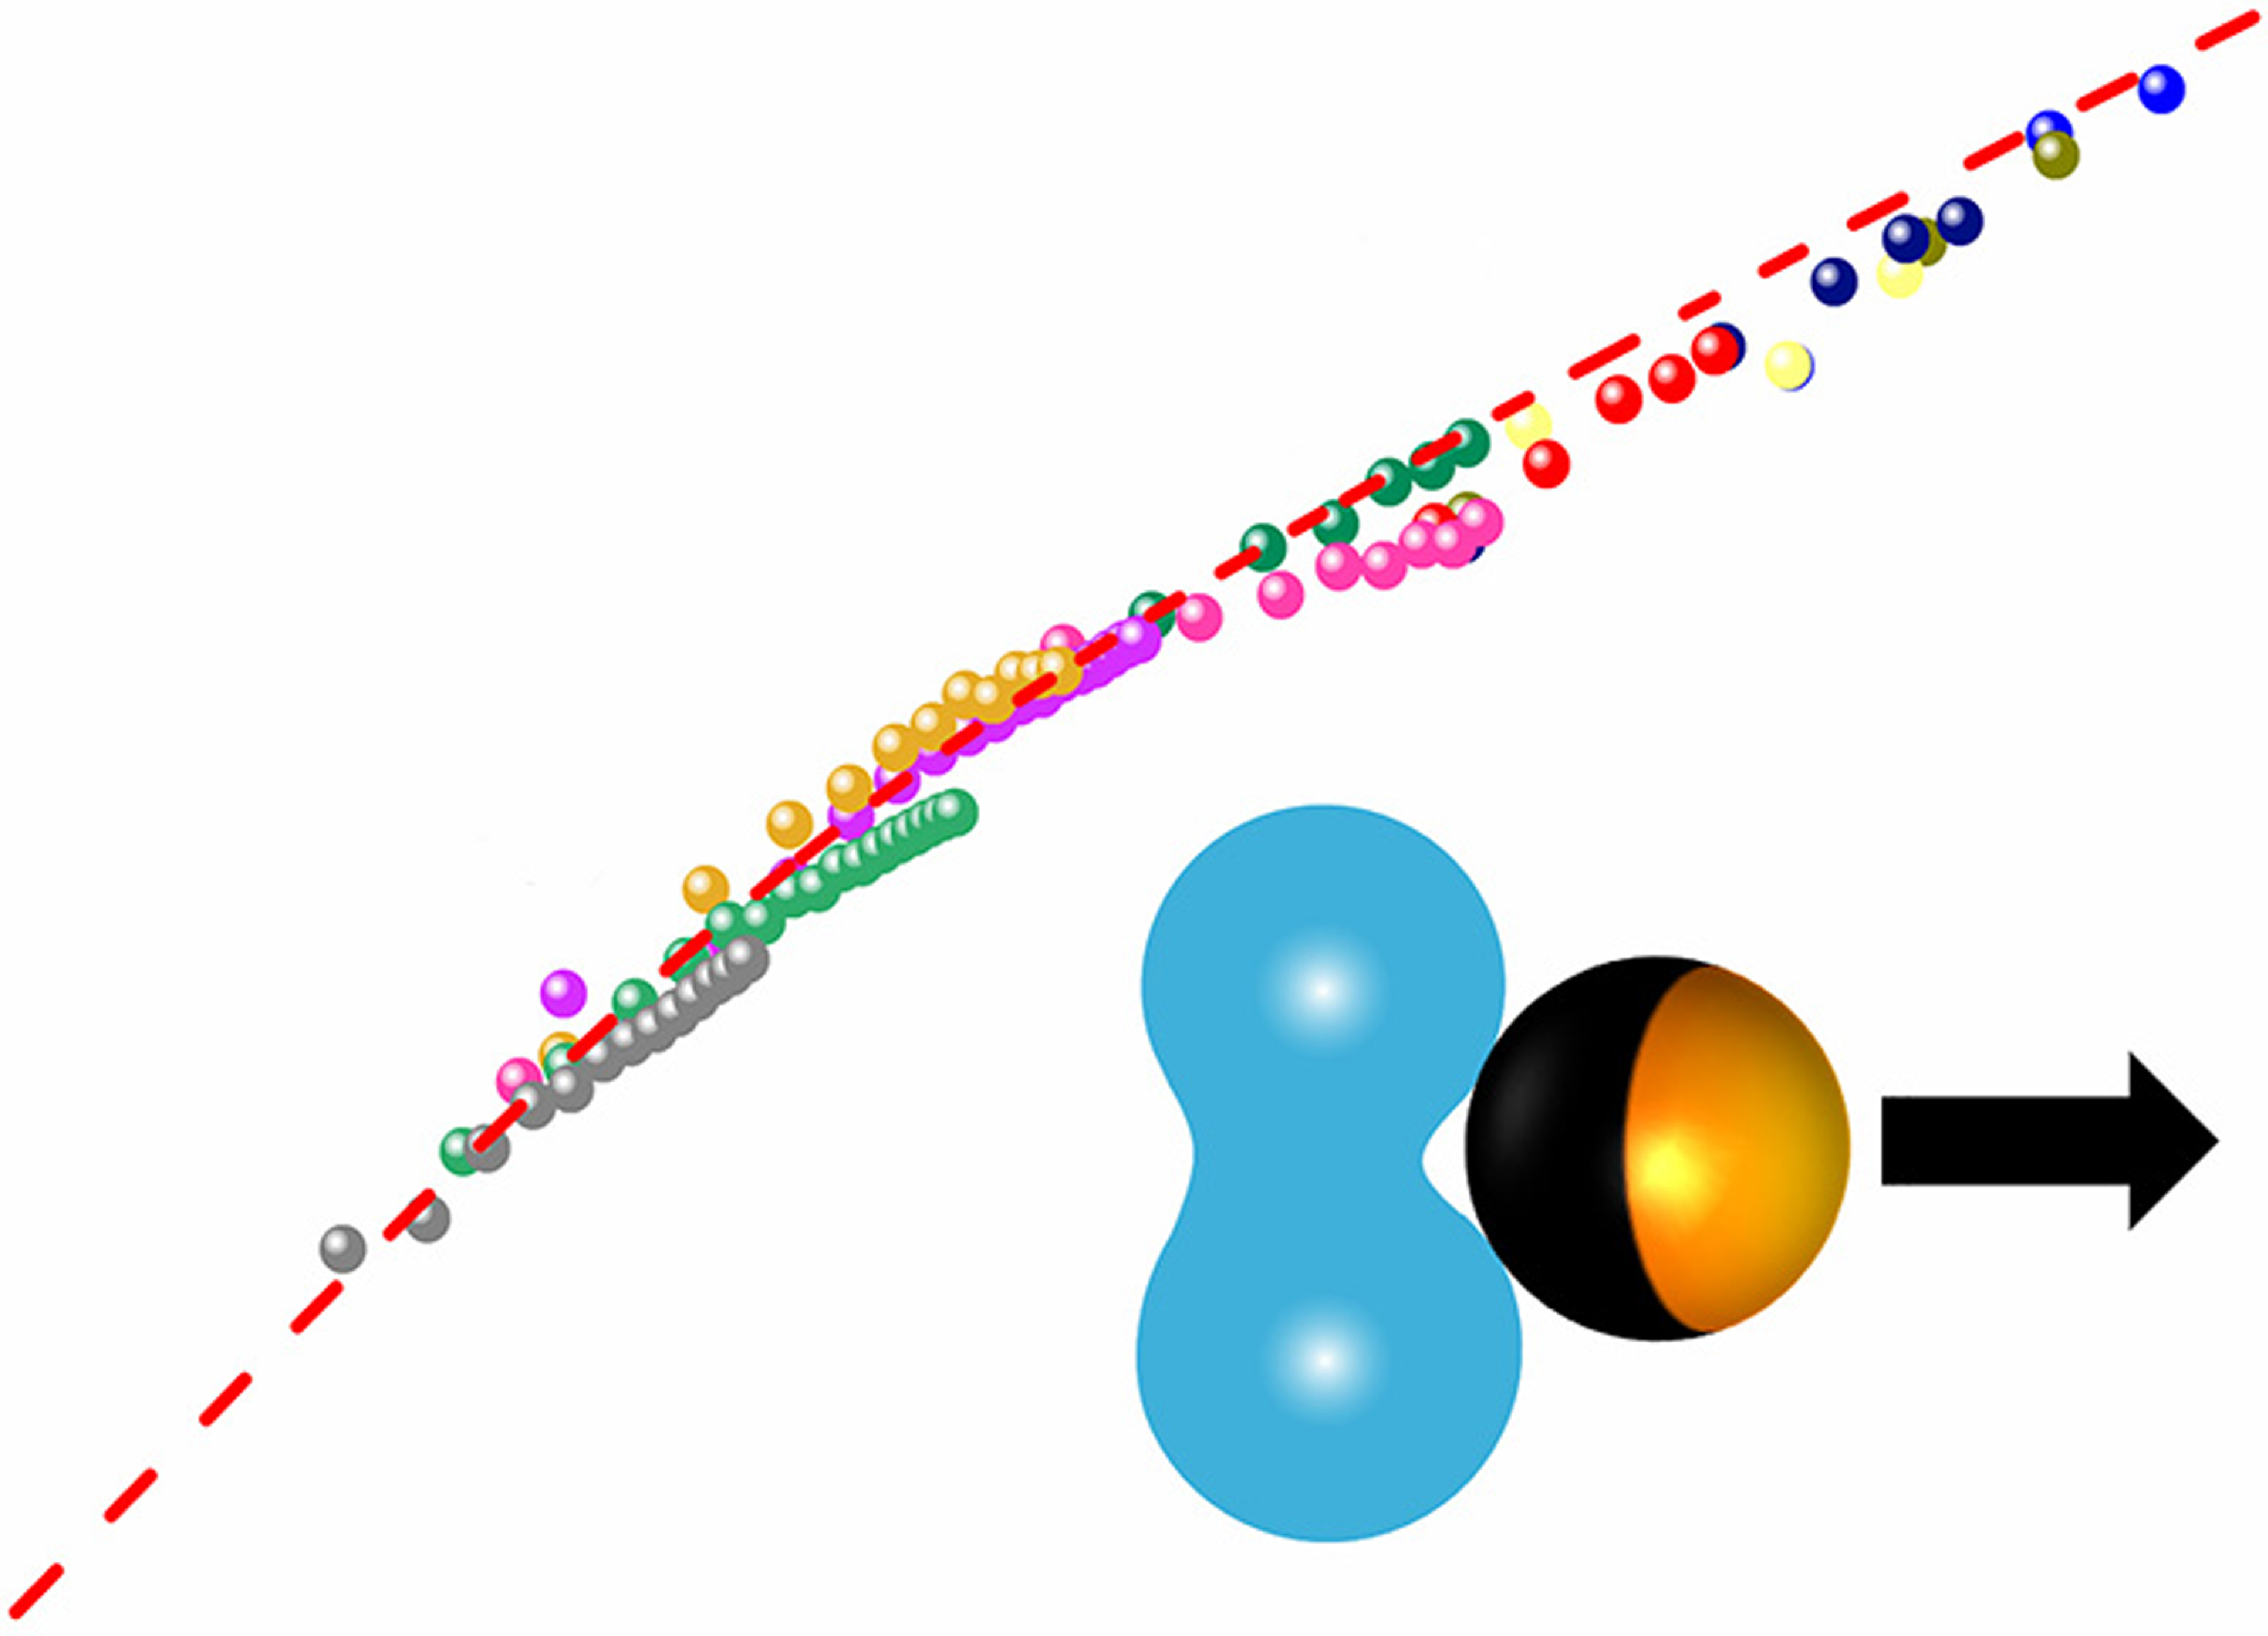
In this study, we establish a double-bubble-powered micromotor based on a platinum-silica (Pt-SiO2) Janus microsphere. When submerged in H2O2 solutions at a medium concentration (15 %), a pair of bubbles can be simultaneously generated on the Pt surface due to the catalytic decomposition of H2O2. Unlike common single-bubble-powered micromotors (Manjare et al. Reference Manjare, Yang and Zhao2012; Wang & Wu, Reference Wang and Wu2014; Wang et al. Reference Wang, Chen, Zheng, Yu, Lv, Sheng, Wang, Nie, Li, Guan and Cui2022, Reference Wang, Sheng, Chen, Yang, Li, Li, Nie, Lv, Guo, Cao, Wang, Li, Hu, Guan, Du, Cui and Zheng2024; Zhang et al. Reference Zhang, Zheng, Cui and Silber-Li2017), the presence of twin bubbles introduces a novel propulsion mechanism that is closely related to the bubble coalescence process. In this double-bubble-powered micromotor system, the translational motion of the micromotor is propelled by repeated bubble cycles. These cycles include the generation, growth and coalescence of the bubble pair, and the final detachment of the merging bubble. This double-bubble-powered micromotor provides a unique experimental set-up for investigating bubble coalescence and subsequent bubble motion; here, the crucial factors such as bubble size, micromotor size, liquid viscosity and reaction rate are adjustable. We focus on clarifying the scaling law of bubble coalescence in this complex system. Based on the experimental results over a wide range of Oh, we show a universal scaling law manifesting a cross-over from a linear scaling of the inertially limited viscous regime to a 1/2 scaling of the inertial coalescence regime. We find that the confinement effect of the solid micromotor results in asymmetric growth of the neck region and a repulsion to detach the coalescing bubble. To characterise the contribution to the propulsion of the micromotor, we show the effects of releasing surface energy from bubble coalescence and the momentum transferred during bubble detachment by a two-stage variation in the displacement from experimental observations. The results provide a better understanding of the flow dynamics and the transport mechanism in micro- and nano-scale swimming devices.
2. Experimental methods
In our experiment, the generation of microbubbles was achieved through the decomposition of H2O2 on the Pt side of the Janus microsphere ( $2\mathrm{H}_{2}{\rm O}_{2}\overset{\mathrm{Pt}}{\rightarrow }2\mathrm{H}_{2}{\rm O}+{\rm O}_{2}$
). An inverted microscope (Nikon Eclipse Ti-U) equipped with a 20× objective (NA = 0.75) and ultrahigh-speed cameras (Phantom, V2512 and TMX 7510) were used to record the coalescence process of the microbubbles, as shown in Figure 1a. Hollow Janus microspheres (hJMs) were obtained by depositing a Pt layer (thickness of 20 nm) on the hemisphere of the hollow glass microspheres (radius R
JM ∼ 10–30 µm; the main component is SiO2). More fabrication details can be found in the literature (Wang et al. Reference Wang, Chen, Zheng, Yu, Lv, Sheng, Wang, Nie, Li, Guan and Cui2022). In the experiment, the H2O2 solution was dripped onto a hydrophilic glass slide to form a liquid film with a thickness of ∼500 µm, and then the Janus particle was placed in the solution using a micropipette. The generation of single or multiple microbubbles was controlled by varying the H2O2 concentration. When the H2O2 concentration c was less than 10 %, only a single bubble formed on the JM surface. While for a higher H2O2 concentration, c ∼ 15 %, usually two microbubbles were generated simultaneously on the Pt surface (Figure 1a). If the two bubbles were in contact with each other, bubble coalescence began. Note that the bubble coalescence occurred in an extremely short time according to the characteristic capillary time
$2\mathrm{H}_{2}{\rm O}_{2}\overset{\mathrm{Pt}}{\rightarrow }2\mathrm{H}_{2}{\rm O}+{\rm O}_{2}$
). An inverted microscope (Nikon Eclipse Ti-U) equipped with a 20× objective (NA = 0.75) and ultrahigh-speed cameras (Phantom, V2512 and TMX 7510) were used to record the coalescence process of the microbubbles, as shown in Figure 1a. Hollow Janus microspheres (hJMs) were obtained by depositing a Pt layer (thickness of 20 nm) on the hemisphere of the hollow glass microspheres (radius R
JM ∼ 10–30 µm; the main component is SiO2). More fabrication details can be found in the literature (Wang et al. Reference Wang, Chen, Zheng, Yu, Lv, Sheng, Wang, Nie, Li, Guan and Cui2022). In the experiment, the H2O2 solution was dripped onto a hydrophilic glass slide to form a liquid film with a thickness of ∼500 µm, and then the Janus particle was placed in the solution using a micropipette. The generation of single or multiple microbubbles was controlled by varying the H2O2 concentration. When the H2O2 concentration c was less than 10 %, only a single bubble formed on the JM surface. While for a higher H2O2 concentration, c ∼ 15 %, usually two microbubbles were generated simultaneously on the Pt surface (Figure 1a). If the two bubbles were in contact with each other, bubble coalescence began. Note that the bubble coalescence occurred in an extremely short time according to the characteristic capillary time ${\unicode{x03C4}}=\sqrt{\rho {R_{b}}^{3}/{\unicode[Arial]{x03C3}} }$
(where ρ is the liquid density, R
b
is the bubble radius and σ is the bubble surface tension; τ ∼ 10.5 µs for a microbubble with a radius R
b
= 20 µm) in H2O2 solutions. Compared with a recent experimental study of bubble coalescence (Soto et al. Reference Soto, Maddalena, Fraters, van der Meer and Lohse2018), the capillary time τ in our case is much shorter because of the decreased bubble size in a micromotor system. Thus, we needed to use ultrahigh-speed cameras (Phantom, V2512, or TMX 7510) with higher frame rates (460 000 fps or 770 000 fps) to record the coalescence process. The image resolution was approximately 0.68 µm pixel−1. To investigate the universal scaling of coalescence, glycerol was added to the H2O2 solution to adjust the viscosity and surface tension of the fluids (Table 1). In the experiment, the glycerol concentration ranged from 0% to 80%, and the viscosity µ and surface tension σ ranged from 0.98 to 179.50 mPa.s, and from 0.0596 to 0.0725 N m−1, respectively.
${\unicode{x03C4}}=\sqrt{\rho {R_{b}}^{3}/{\unicode[Arial]{x03C3}} }$
(where ρ is the liquid density, R
b
is the bubble radius and σ is the bubble surface tension; τ ∼ 10.5 µs for a microbubble with a radius R
b
= 20 µm) in H2O2 solutions. Compared with a recent experimental study of bubble coalescence (Soto et al. Reference Soto, Maddalena, Fraters, van der Meer and Lohse2018), the capillary time τ in our case is much shorter because of the decreased bubble size in a micromotor system. Thus, we needed to use ultrahigh-speed cameras (Phantom, V2512, or TMX 7510) with higher frame rates (460 000 fps or 770 000 fps) to record the coalescence process. The image resolution was approximately 0.68 µm pixel−1. To investigate the universal scaling of coalescence, glycerol was added to the H2O2 solution to adjust the viscosity and surface tension of the fluids (Table 1). In the experiment, the glycerol concentration ranged from 0% to 80%, and the viscosity µ and surface tension σ ranged from 0.98 to 179.50 mPa.s, and from 0.0596 to 0.0725 N m−1, respectively.
Concentration, density, viscosity and surface tension in the experiments

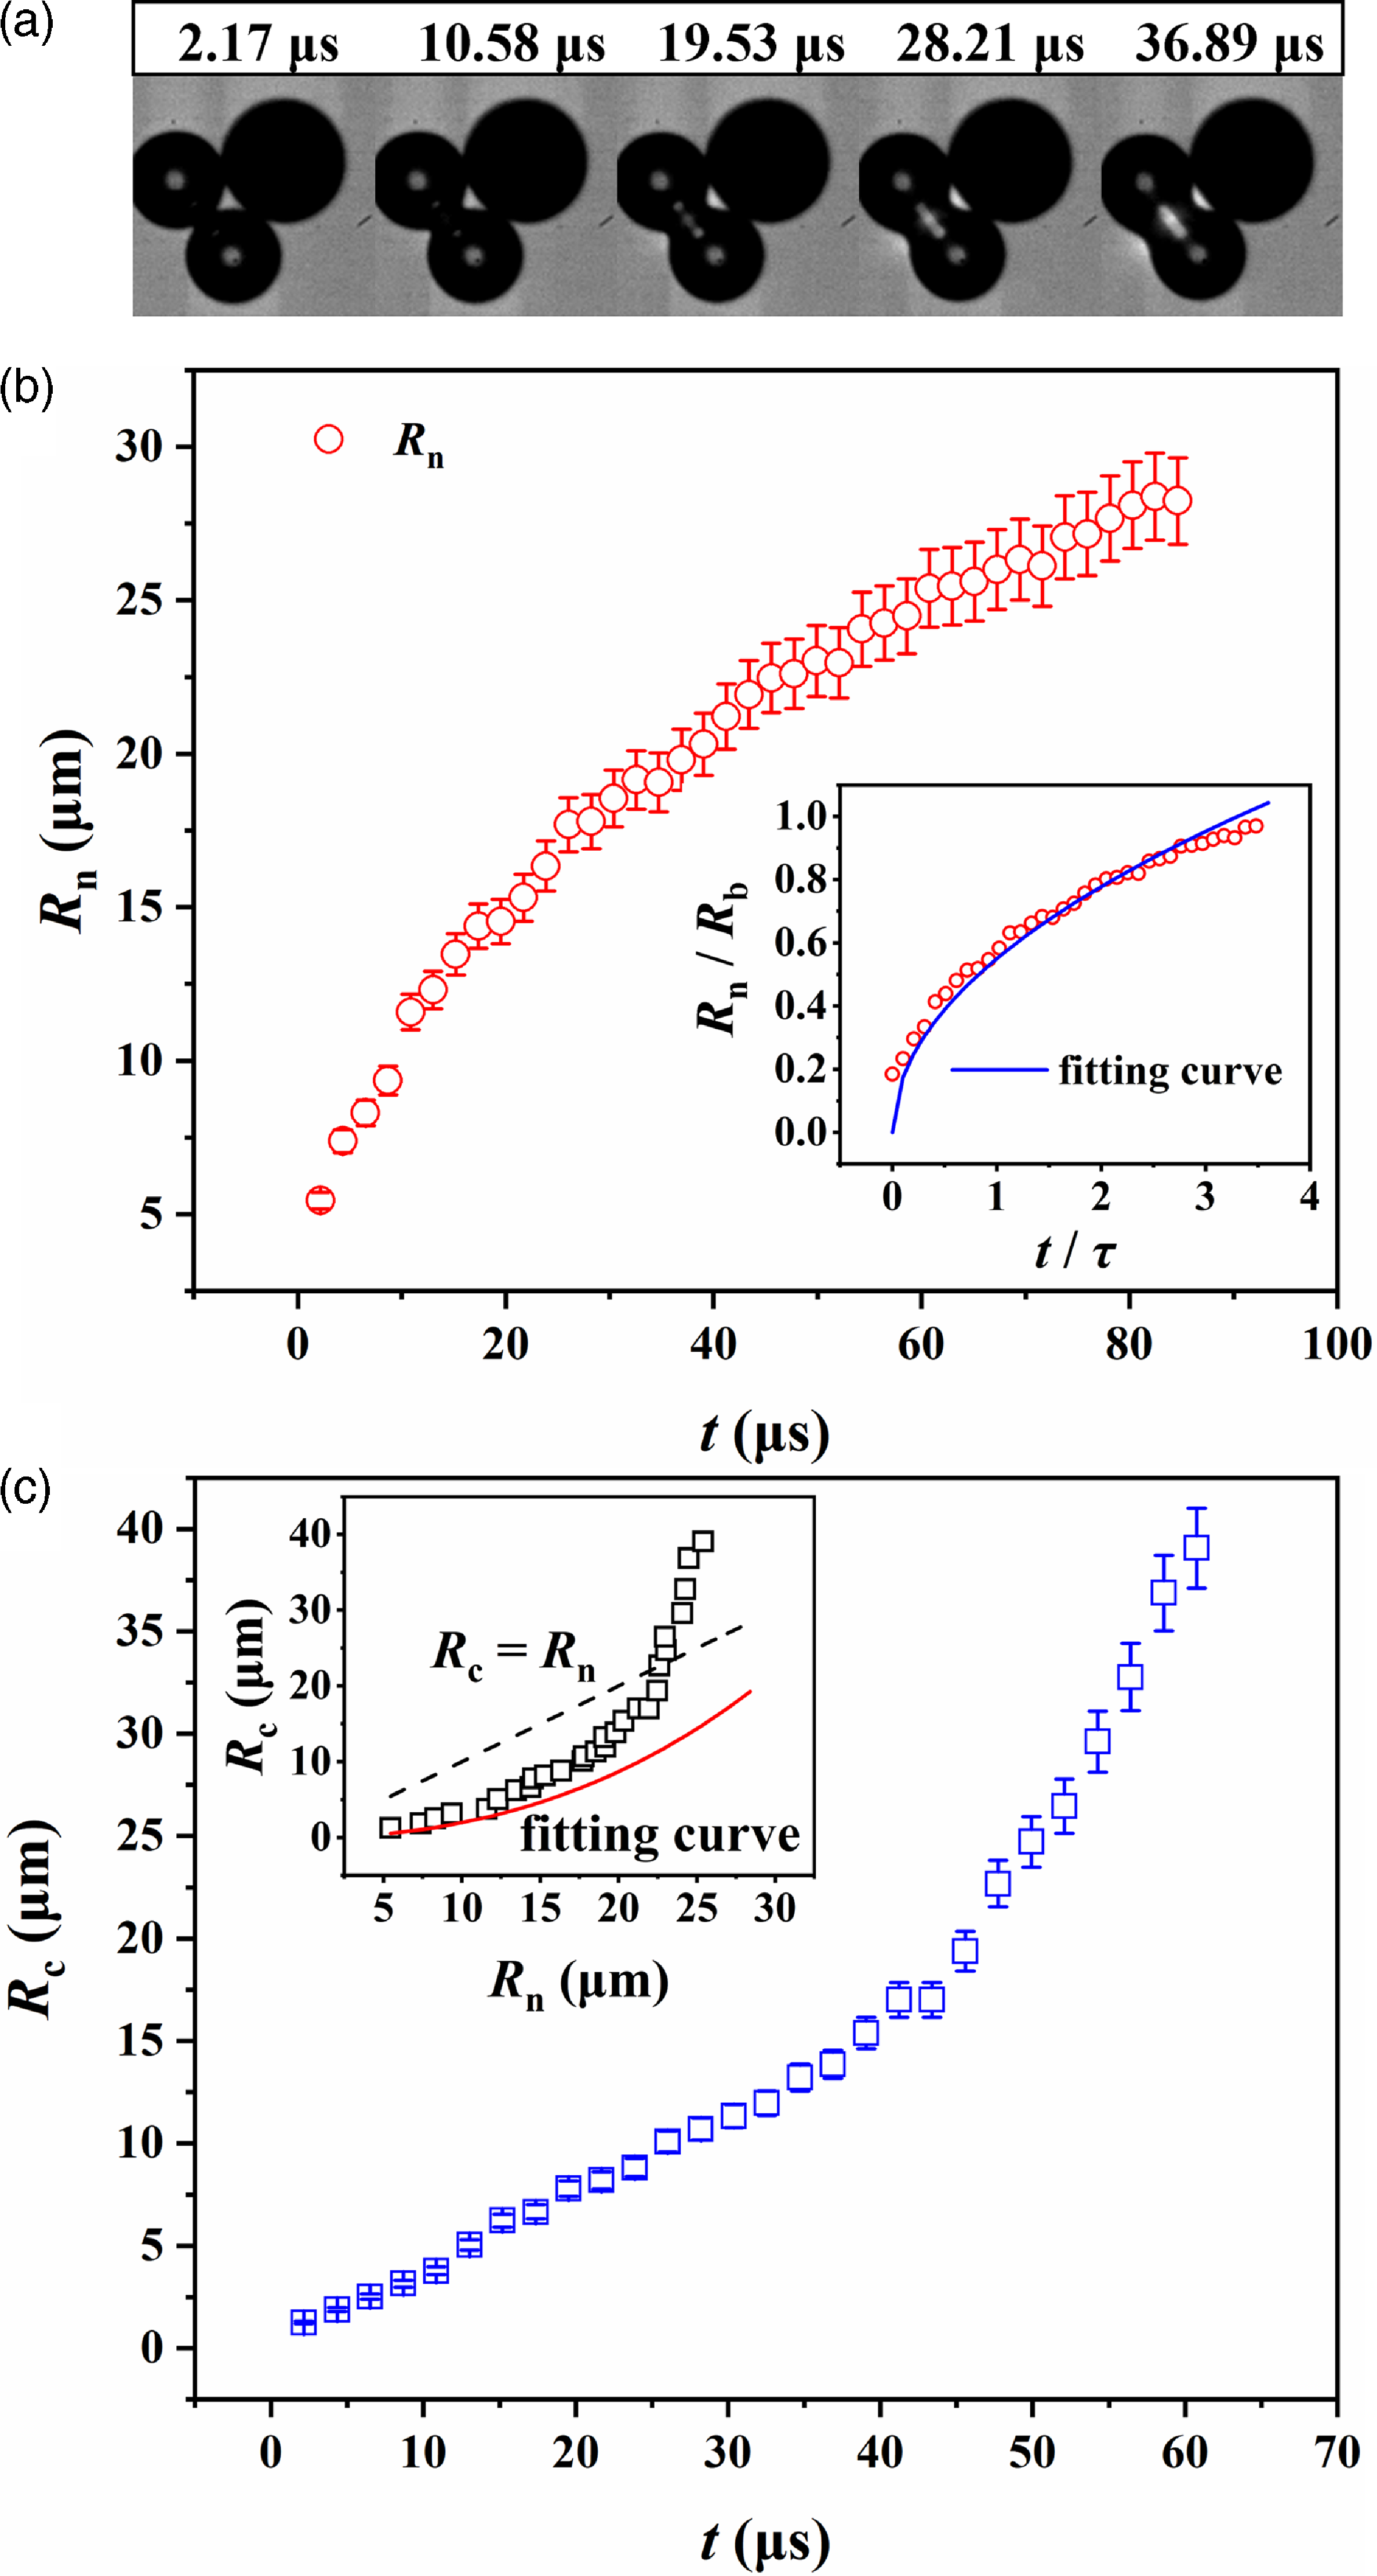
(a) Schematic diagram of the experimental set-up. (b) Schematic diagram of the neck region of two coalescing microbubbles with similar initial radii Rb. The neck radius Rn is defined as the minimum radial distance measured from the z-axis to the neck profile. A zoomed-in schematic of the neck region is shown in the dashed rectangle, where the curvature radius of the outer profile near the neck region is defined as Rc. The velocities along the r-axis and z-axis directions are ur and uz, respectively.
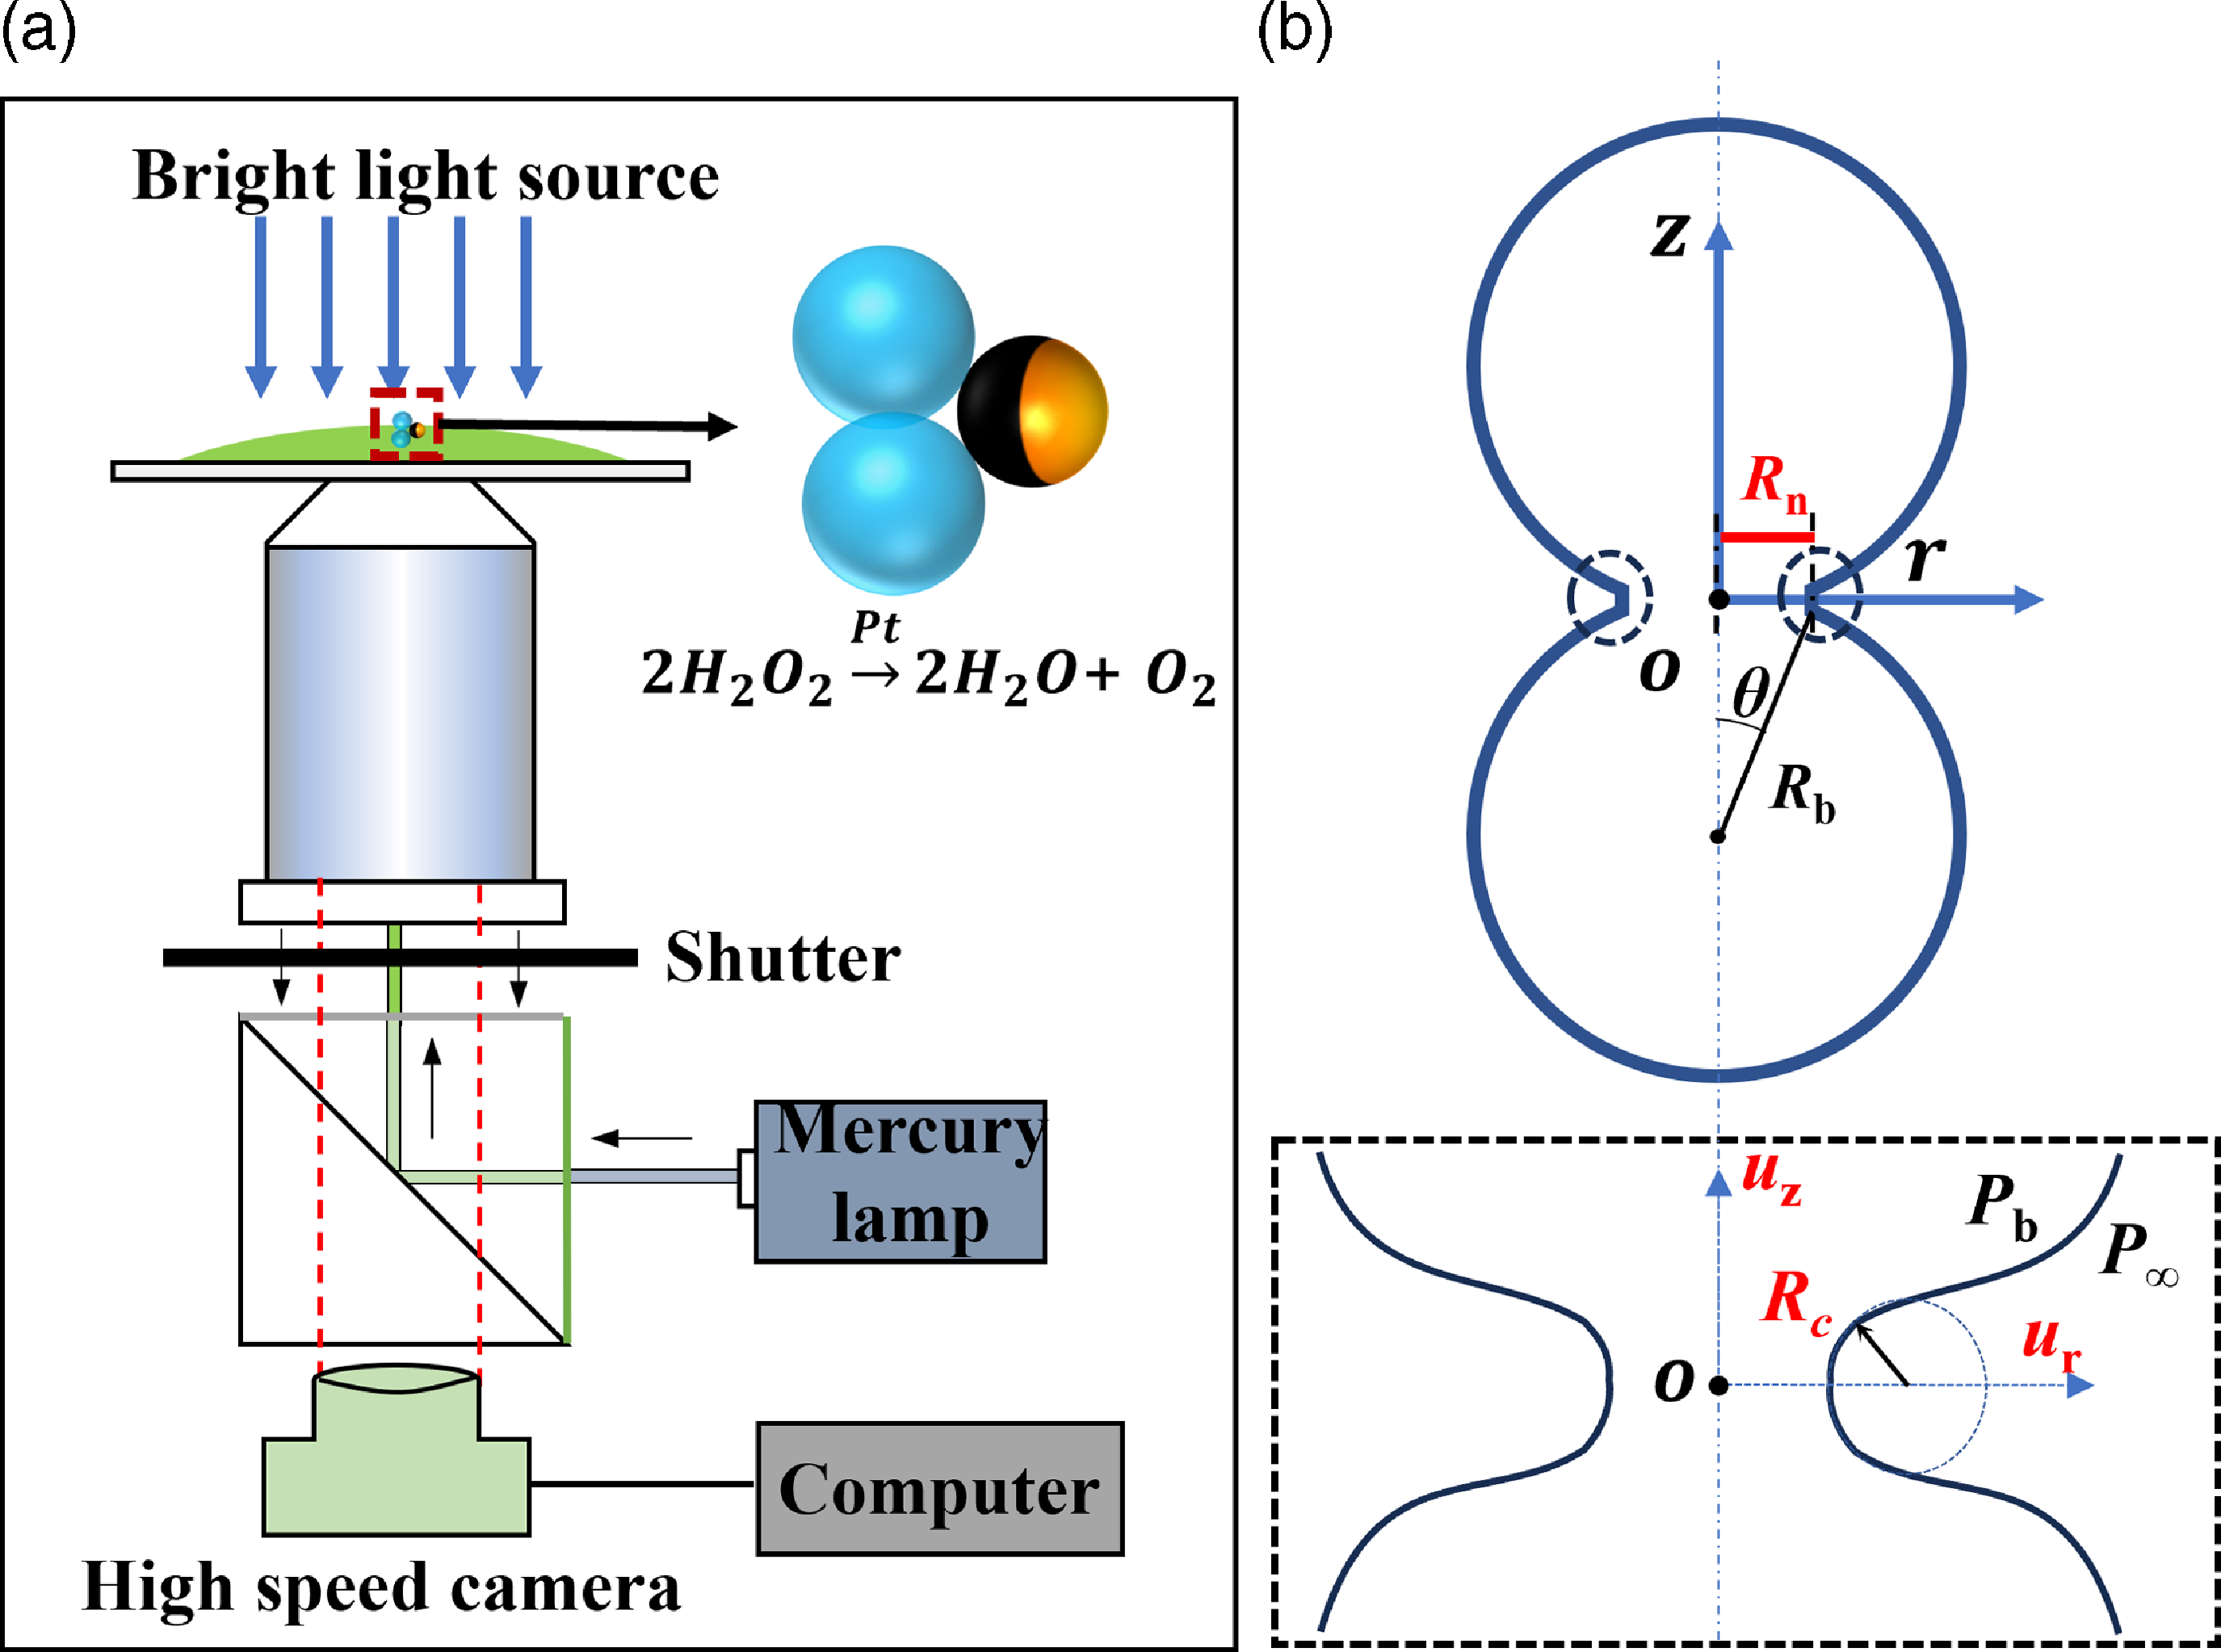
For convenience in describing the bubble coalescence process, we define the geometric coordinates of the two coalescing microbubbles (with the same initial radius of R b) near an hJM, as shown in Figure 1b. To show the process, experimental snapshots of bubble coalescence using two identical bubbles (R b = 21.3 µm and 22.3 µm, the difference in R b is less than 5 %) in a glycerol-H2O2 solution (50 %, Vglycerol / VH2O2) are shown in Figure 2a. The first four snapshots display the early coalescence process at t = 0–6.51 µs until the neck region has grown to approximately R n ∼ R b/2. The neck growth then slows (t = 10.58–19.26 µs), and the difference in neck growth between the near and far sides can be clearly observed due to the presence of the JM and its confinement effect. The merging of the two bubbles by the surface tension of the neck region takes a much longer time (t = 19.26–412.31 µs); during this process, the bubble deformation can transfer the energy resulting from a decrease in total surface energy to the JM. Unsurprisingly, in the 80 % glycerol-H2O2 solution, the neck growth process was slower because of the greater viscosity of the solution.
(a) Experimental snapshots of the neck growth during microbubble coalescence near a JM. The environmental fluid is 50 % glycerol-H2O2 solution. The JM radius is RJM = 22.6 µm, the bubble radii are identical, and Rb = 21.3 µm and 22.3 µm. (b) Determining the neck radius Rn and the outer curvature radius Rc from the experimental image. An overlap of the bubble profiles with a time interval of 4.34 µs is shown in the last plot of panel (b). To clearly show the temporal evolution, the near and far sides of each profile are shifted outwards for a small distance. The full process of panel (a) can be viewed in supplementary movie S1. (c) Zoomed-in images of the neck region at t = 0 µs and t = 2.17 µs. Neck radius Rn is measured from the image based on the interfacial profile (red curve). The blue dash-dotted lines denote the uncertainty of the image recognition. The yellow lines indicate the measured neck diameters and the red dots represent the centre of the diameter. The right panel displays the increase of neck radius Rn versus time.
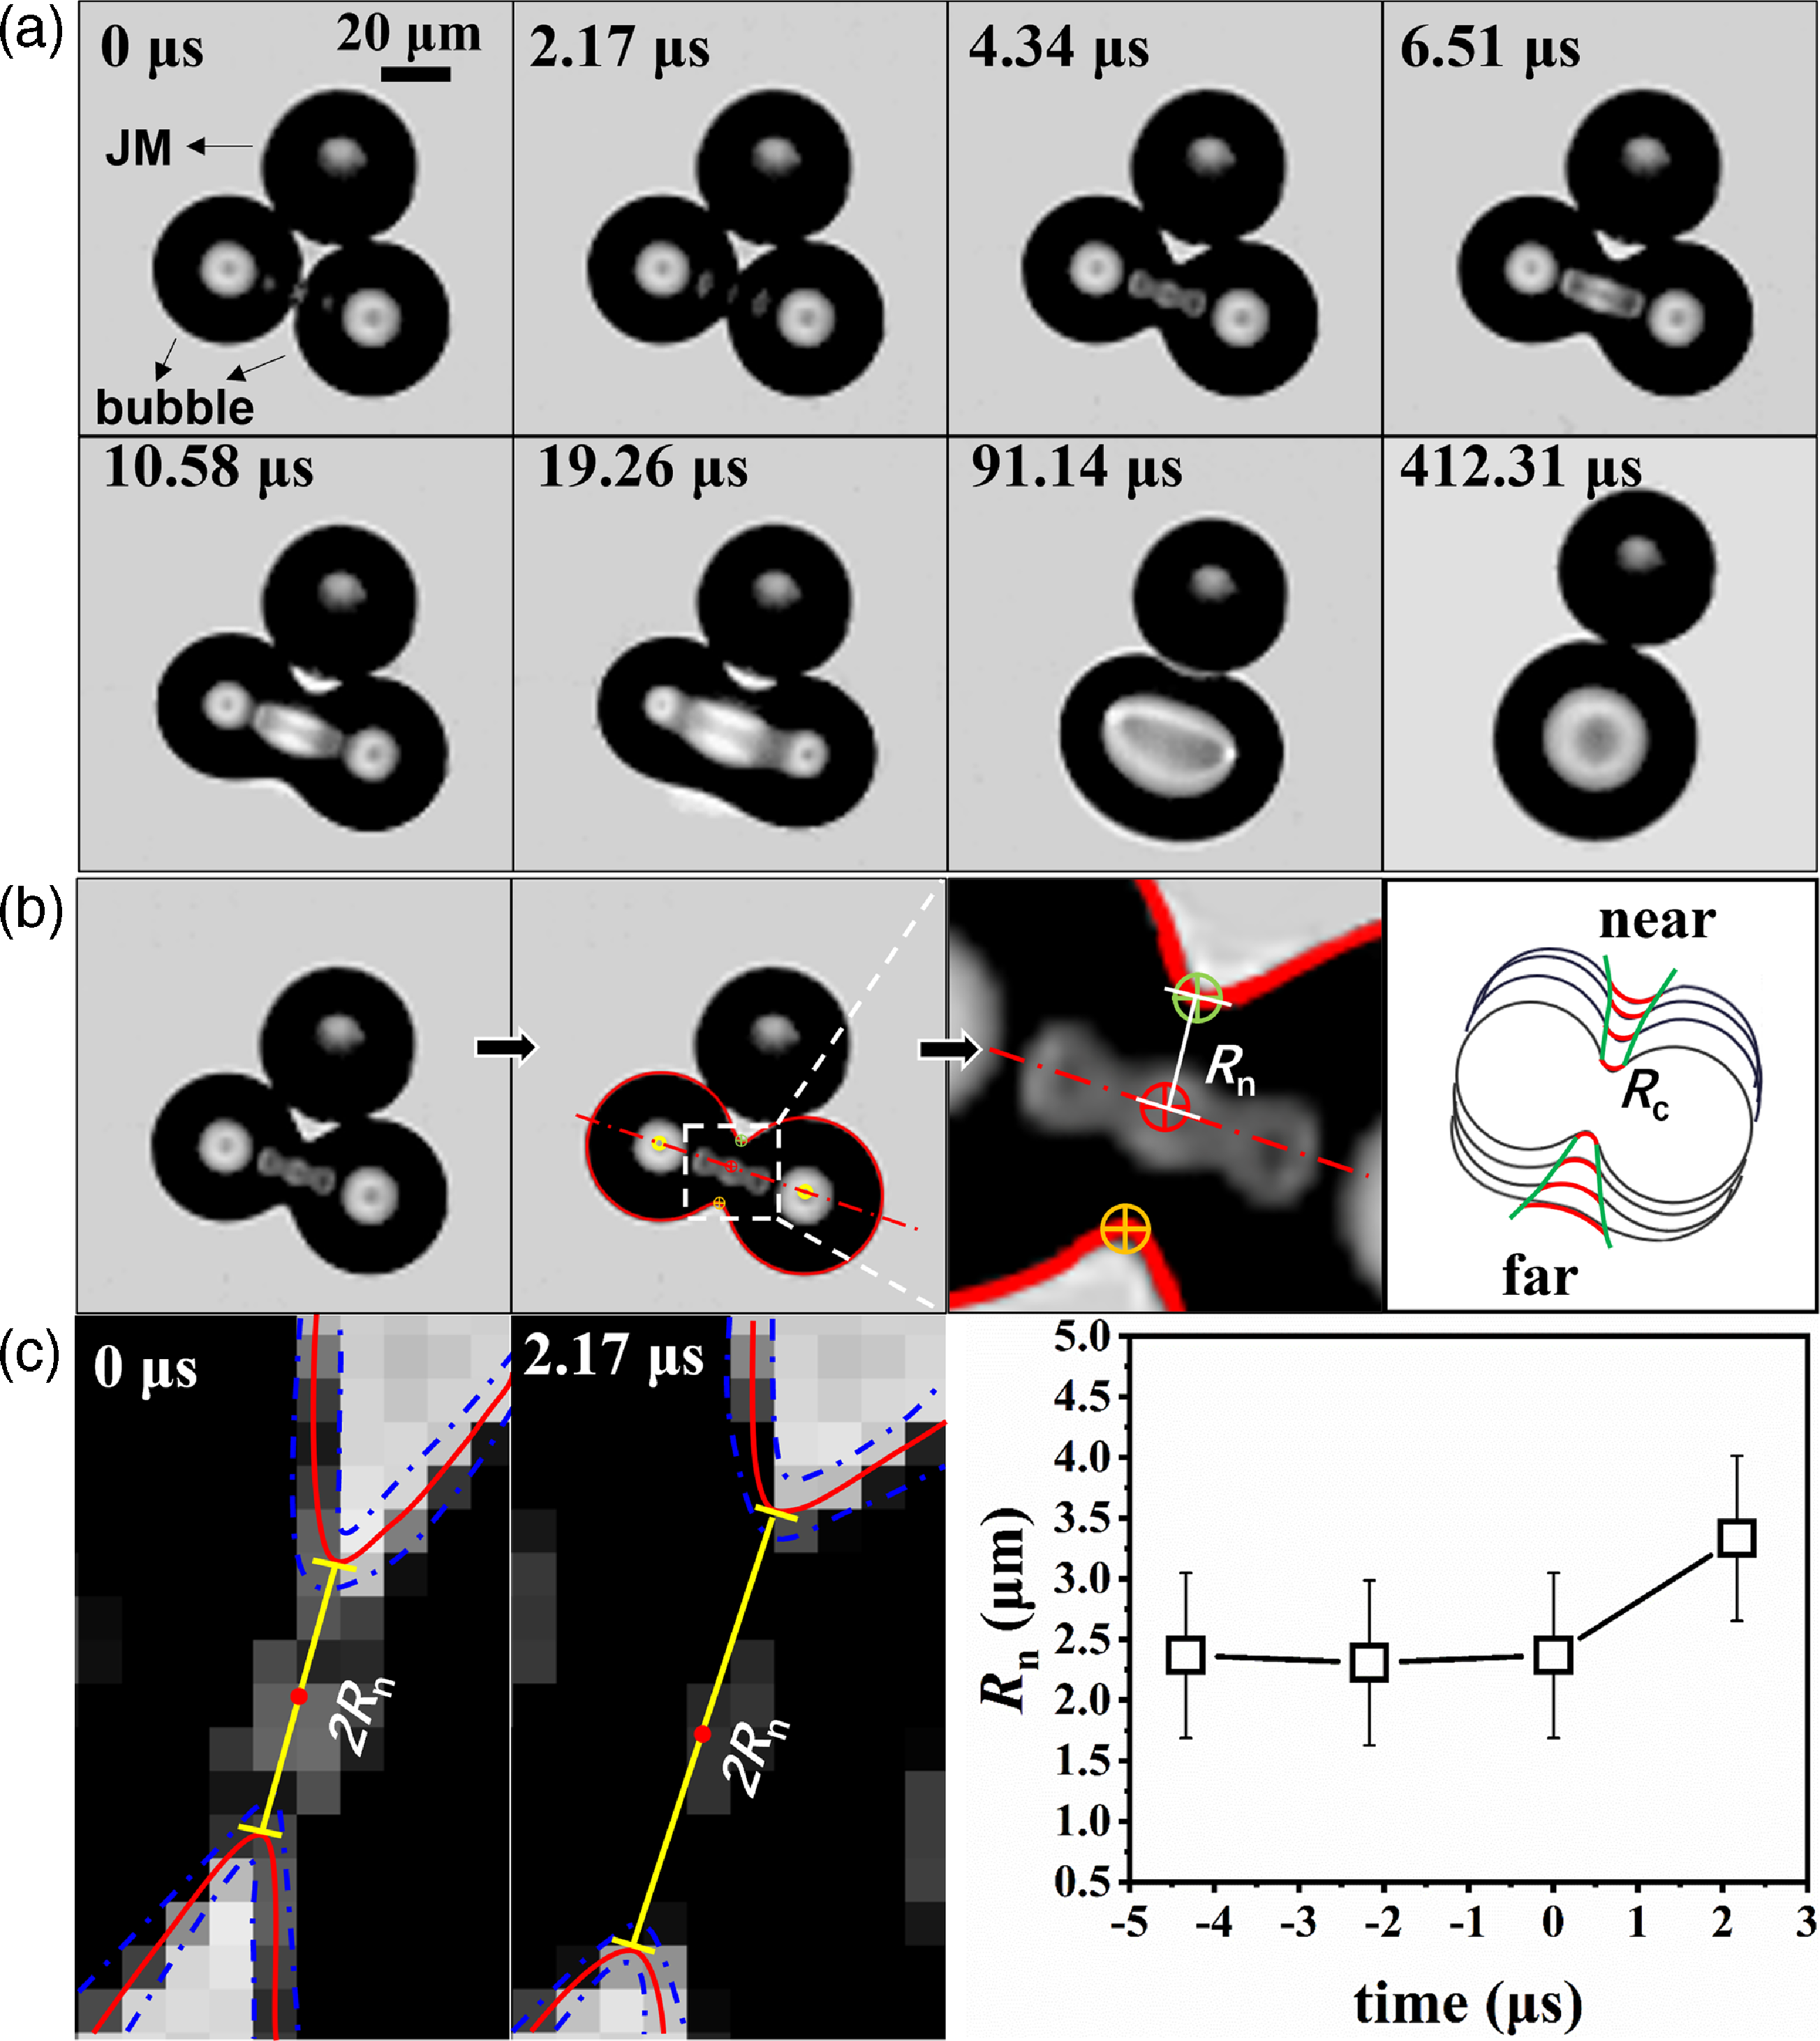
To analyse the detailed bubble coalescence process, we obtained the neck growth data from the experimental images. The method is illustrated in Figure 2b. Briefly, we first identified the interfacial profile of the coalescing bubbles, as shown in red in Figure 2b. The neck radius R n is determined as the distance between the centre and the boundary of the neck region. As a result, the temporal evolution of the neck region and the outer curvature radius R c can also be obtained, as shown in the last plot of Figure 2b. As shown in Figure 2c, the zoomed-in images of the neck region at t = 0 µs and t = 2.17 µs demonstrate a sudden neck growth since bubble coalescence. Here, the onset of bubble coalescence is determined with an uncertainty of a half-frame interval of approximately 1.1 µs. The boundary of the neck can be clearly observed in Figure 2c, and the neck radius R n is measured from the image based on the interfacial profile (red curve). Due to the complex optical effect in the neck region and the limit of the optical resolution, we estimate that the measurement uncertainty of the neck radius R n is approximately ± 1 pixel = ± 0.68 µm. The right panel of Figure 2c displays the measured R n with error bars indicating the uncertainties.
3. Theoretical model and numerical simulation
3.1. Scaling law of the neck growth at the beginning of bubble coalescence
The early coalescence of two bubbles characterised by the neck formation between them is a classic problem in fluid dynamics (Case & Nagel, Reference Case and Nagel2008; Paulsen et al. Reference Paulsen, Burton and Nagel2011, Reference Paulsen, Carmigniani, Kannan, Burton and Nagel2014; Soto et al. Reference Soto, Maddalena, Fraters, van der Meer and Lohse2018; Thoroddsen et al. Reference Thoroddsen, Takehara and Etoh2005). The typical Reynolds number, which is based on the speed of neck growth, i.e. $Re={\unicode[Arial]{x03C1}} \dot{R_{n}}R_{b}/\mu$
, can reach 1–100, indicating a significant inertial effect. Here,
$Re={\unicode[Arial]{x03C1}} \dot{R_{n}}R_{b}/\mu$
, can reach 1–100, indicating a significant inertial effect. Here, $\dot{R_{n}}$
is the growth speed of the neck radius, ρ is the fluid density and µ is the viscosity. The Ohnesorge number Oh = µ
$\dot{R_{n}}$
is the growth speed of the neck radius, ρ is the fluid density and µ is the viscosity. The Ohnesorge number Oh = µ $ /\sqrt{{\unicode[Arial]{x03C1}} {\unicode[Arial]{x03C3}} R_{b}}$
is approximately 0.01–10 and indicates a stronger surface tension effect compared with the viscous effect. According to the theory of Thoroddsen et al. (Reference Thoroddsen, Takehara and Etoh2005), which introduced the Laplace pressure based on the neck radius R
n
and the typical horizontal spacing δR
n
between the two bubbles, the ordinary differential equation for the dimensionless neck radius can be expressed as follows:
$ /\sqrt{{\unicode[Arial]{x03C1}} {\unicode[Arial]{x03C3}} R_{b}}$
is approximately 0.01–10 and indicates a stronger surface tension effect compared with the viscous effect. According to the theory of Thoroddsen et al. (Reference Thoroddsen, Takehara and Etoh2005), which introduced the Laplace pressure based on the neck radius R
n
and the typical horizontal spacing δR
n
between the two bubbles, the ordinary differential equation for the dimensionless neck radius can be expressed as follows:
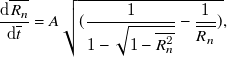 \begin{equation}\frac{{\rm d}\overline{R_{n}}}{{\rm d}\overline{t}}=A\sqrt{(\frac{1}{1-\sqrt{1-\overline{R_{n}^{2}}}}-\frac{1}{\overline{R_{n}}})},\end{equation}
where A is a fitting parameter, the dimensionless neck radius is $\overline{R_{n}}=R_{n}/R_{b}$
and the dimensionless time is
$\overline{R_{n}}=R_{n}/R_{b}$
and the dimensionless time is $\overline{t}=t/{\unicode[Arial]{x03C4}}$
normalised by the capillary time
$\overline{t}=t/{\unicode[Arial]{x03C4}}$
normalised by the capillary time ${\unicode[Arial]{x03C4}} =\sqrt{{\unicode[Arial]{x03C1}} {R_{b}}^{3}/{\unicode[Arial]{x03C3}} }$
(Soto et al. Reference Soto, Maddalena, Fraters, van der Meer and Lohse2018; Thoroddsen et al. Reference Thoroddsen, Takehara and Etoh2005). The above approach suggests an R
n
∼ t
1/2 relation (Thoroddsen et al. Reference Thoroddsen, Takehara and Etoh2005) at early coalescence, which has been experimentally verified by Soto et al. (Reference Soto, Maddalena, Fraters, van der Meer and Lohse2018). Nagel’s group also showed this inertial R
n
∼ t
1/2 relation based on systematic investigations using various drops (Case & Nagel, Reference Case and Nagel2008; Paulsen et al. Reference Paulsen, Burton and Nagel2011, Reference Paulsen, Carmigniani, Kannan, Burton and Nagel2014):
${\unicode[Arial]{x03C4}} =\sqrt{{\unicode[Arial]{x03C1}} {R_{b}}^{3}/{\unicode[Arial]{x03C3}} }$
(Soto et al. Reference Soto, Maddalena, Fraters, van der Meer and Lohse2018; Thoroddsen et al. Reference Thoroddsen, Takehara and Etoh2005). The above approach suggests an R
n
∼ t
1/2 relation (Thoroddsen et al. Reference Thoroddsen, Takehara and Etoh2005) at early coalescence, which has been experimentally verified by Soto et al. (Reference Soto, Maddalena, Fraters, van der Meer and Lohse2018). Nagel’s group also showed this inertial R
n
∼ t
1/2 relation based on systematic investigations using various drops (Case & Nagel, Reference Case and Nagel2008; Paulsen et al. Reference Paulsen, Burton and Nagel2011, Reference Paulsen, Carmigniani, Kannan, Burton and Nagel2014):
 \begin{equation}\frac{R_{n}}{R_{b}}=B\sqrt{\frac{t}{{\unicode[Arial]{x03C4}} }},\end{equation}
where B is a dimensionless fitting parameter.
Nonetheless, as mentioned before, a different viscous scaling should begin with an inertially limited viscous regime (Paulsen et al. Reference Paulsen, Burton, Nagel, Appathurai, Harris and Basaran2012), which satisfies linear scaling in the Stokes regime if the viscosity is sufficiently high. This linear behaviour was theoretically described by Hopper (Reference Hopper2006) and was experimentally and numerically examined (Aarts et al. Reference Aarts, Lekkerkerker, Guo, Wegdam and Bonn2005; Burton & Taborek, Reference Burton and Taborek2007; Yao et al. Reference Yao, Maris, Pennington and Seidel2005). Thus, viscous-to-inertial cross-over became a main research focus. Negal’s group (Paulsen et al. Reference Paulsen, Burton, Nagel, Appathurai, Harris and Basaran2012, Reference Paulsen, Carmigniani, Kannan, Burton and Nagel2014) established a framework to describe the cross-over from a linear scaling of the inertially limited viscous regime to a 1/2 scaling of the inertial coalescence regime for various drops. Recently, Xia et al. (Reference Xia, He and Zhang2019) provided a theoretical derivation to reveal the universal coalescence scaling of the viscous-to-inertial cross-over process for various drops starting from the Navier–Stokes (N-S) equation. Note that the simulation of Anthony et al. (Reference Anthony, Kamat, Thete, Munro, Lister, Harris and Basaran2017, Reference Anthony, Harris and Basaran2020) showed a 1/2 scaling of bubble coalescence and explained that the linear ILV regime would not exist if the initial condition was a point contact. Hereafter, we introduce the theoretical description for our experiment based on the work of Xia et al.
A schematic diagram of the neck region of bubble coalescence in our experiment is displayed in Figure 1b. Since the evolution of the neck region is governed mainly by a more viscous fluid phase, we establish equations to describe the fluid flows of the neck region. For the axisymmetric and quasi-steady flow, the continuity equation and the momentum equations in the r direction can be exprssed as
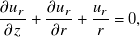 \begin{align}\frac{\partial u_{r}}{\partial z}+\frac{\partial u_{r}}{\partial r}&+\frac{u_{r}}{r}=0,\end{align}
 \begin{align}{\unicode[Arial]{x03C1}} \left(u_{z}\frac{\partial u_{r}}{\partial z}+u_{r}\frac{\partial u_{r}}{\partial r}\right)=-\frac{\partial p}{\partial r}&+\mu (\frac{\partial ^{2}u_{r}}{\partial z^{2}}+\frac{\partial ^{2}u_{r}}{\partial r^{2}}+\frac{\partial (u_{r}/r)}{\partial r}),\\[8pt]\nonumber\end{align}
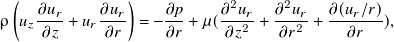
where u z and u r are velocities in the z and r directions, respectively, and p is the pressure. In this axisymmetric configuration, following the deduction of Xia et al. (Reference Xia, He and Zhang2019) in which a Batchelor vortex was used to address the velocity distribution in the neck region, an equation governing the flow during bubble coalescence is obtained:
 \begin{equation}{\unicode[Arial]{x03C1}} u^{2}-2{\unicode[Arial]{x03C3}} \left(\frac{1}{R_{c}}-\frac{1}{R_{n}}+\frac{2}{R_{b}}\right)+\mu \frac{\sqrt{\pi }u}{R_{c}}=0.\end{equation}
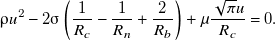
The three terms on the left-hand side of (3.5) represent the inertial effect, the surface tension effect and the viscous effect, respectively. The surface tension term $2{\unicode[Arial]{x03C3}} \left(\frac{1}{R_{c}}-\frac{1}{R_{n}}+\frac{2}{R_{b}}\right)$
can be approximated as 2σ/R
c as R
c is the smallest length. Note that the self-similar geometric relationship indicates R
c/R
n ≈ tanθ/2 ≈ R
n/2R
b << 1, which also means R
c ∼ R
n
2/2R
b. Therefore, the governing equation is simplified to be
$2{\unicode[Arial]{x03C3}} \left(\frac{1}{R_{c}}-\frac{1}{R_{n}}+\frac{2}{R_{b}}\right)$
can be approximated as 2σ/R
c as R
c is the smallest length. Note that the self-similar geometric relationship indicates R
c/R
n ≈ tanθ/2 ≈ R
n/2R
b << 1, which also means R
c ∼ R
n
2/2R
b. Therefore, the governing equation is simplified to be
 \begin{equation}{\unicode[Arial]{x03C1}} u^{2}-\frac{4\sigma R_{b}}{R_{n}^{2}}+\frac{2\sqrt{\pi }\mu uR_{b}}{R_{n}^{2}}=0.\end{equation}
Similar to the treatment of Paulsen et al. (Reference Paulsen, Carmigniani, Kannan, Burton and Nagel2014) and Xia et al. (Reference Xia, He and Zhang2019), by selecting a characteristic length L = $2R_{b}Oh$
, velocity U = σ/µ and time scales T =
$2R_{b}Oh$
, velocity U = σ/µ and time scales T = $2R_{b}Oh$
µ/σ, a final dimensionless equation can be established based on (3.6):
$2R_{b}Oh$
µ/σ, a final dimensionless equation can be established based on (3.6):
 \begin{equation}\dot{\widetilde{R_{n}}}^{2}-\frac{2}{\widetilde{R_{n}}^{2}}+\frac{\sqrt{\pi }\dot{\widetilde{R_{n}}}}{\widetilde{R_{n}}^{2}}=0,\end{equation}
where the dimensionless neck radius is $\widetilde{R_{n}}=R_{n}/2OhR_{b}$
and the dimensionless time is
$\widetilde{R_{n}}=R_{n}/2OhR_{b}$
and the dimensionless time is $\tilde{t}=t\sigma /2\mu OhR_{b}$
. Using proper initial conditions
$\tilde{t}=t\sigma /2\mu OhR_{b}$
. Using proper initial conditions $\widetilde{R_{n}}=0$
and
$\widetilde{R_{n}}=0$
and $\dot{\widetilde{R_{n}}}(\tilde{t})$
= 0, we can solve (3.7) and obtain an implicit form of the exact solution:
$\dot{\widetilde{R_{n}}}(\tilde{t})$
= 0, we can solve (3.7) and obtain an implicit form of the exact solution:
 \begin{equation}\tilde{t}=\frac{\sqrt{\pi }\widetilde{R_{n}}}{4}+\frac{\widetilde{R_{n}}}{8}\sqrt{8\widetilde{R_{n}}^{2}+\pi }+\frac{\sqrt{2}\pi }{32}\ln (\sqrt{\frac{8}{\pi }}\widetilde{R_{n}}+\sqrt{\frac{8\widetilde{R_{n}}^{2}}{\pi }+1}).\end{equation}
More information can be obtained from the dimensionless (3.7). By respectively neglecting the inertial, surface tension and viscous term in (3.7), one can readily find the scaling of $\widetilde{R_{n}}\sim \tilde{t}$
,
$\widetilde{R_{n}}\sim \tilde{t}$
, $\widetilde{R_{n}}\sim \tilde{t}^{1/3}$
and
$\widetilde{R_{n}}\sim \tilde{t}^{1/3}$
and $\widetilde{R_{n}}\sim \tilde{t}^{1/2}$
. Nonetheless, considering that surface tension cannot be disregarded in our experiments since Oh < 1, the presence of
$\widetilde{R_{n}}\sim \tilde{t}^{1/2}$
. Nonetheless, considering that surface tension cannot be disregarded in our experiments since Oh < 1, the presence of $\widetilde{R_{n}}\sim \tilde{t}$
and
$\widetilde{R_{n}}\sim \tilde{t}$
and $\widetilde{R_{n}}\sim \tilde{t}^{1/2}$
is expected. The former is known as the inertially limited viscous regime for very small
$\widetilde{R_{n}}\sim \tilde{t}^{1/2}$
is expected. The former is known as the inertially limited viscous regime for very small $\tilde{t}$
at the beginning of coalescence (Paulsen et al. Reference Paulsen, Carmigniani, Kannan, Burton and Nagel2014), and the latter is more frequently observed in the literature (Paulsen et al. Reference Paulsen, Carmigniani, Kannan, Burton and Nagel2014; Soto et al. Reference Soto, Maddalena, Fraters, van der Meer and Lohse2018; Thoroddsen et al. Reference Thoroddsen, Takehara and Etoh2005; Xia et al. Reference Xia, He and Zhang2019) when the inertial effect becomes dominant. The
$\tilde{t}$
at the beginning of coalescence (Paulsen et al. Reference Paulsen, Carmigniani, Kannan, Burton and Nagel2014), and the latter is more frequently observed in the literature (Paulsen et al. Reference Paulsen, Carmigniani, Kannan, Burton and Nagel2014; Soto et al. Reference Soto, Maddalena, Fraters, van der Meer and Lohse2018; Thoroddsen et al. Reference Thoroddsen, Takehara and Etoh2005; Xia et al. Reference Xia, He and Zhang2019) when the inertial effect becomes dominant. The $\widetilde{R_{n}}(\tilde{t})$
∼
$\widetilde{R_{n}}(\tilde{t})$
∼ $\tilde{t}$
relation in (3.8) contains three terms:
$\tilde{t}$
relation in (3.8) contains three terms: $\widetilde{t_{1}}=\frac{\sqrt{\pi }\widetilde{R_{n}}(\widetilde{t_{1}})}{4}$
,
$\widetilde{t_{1}}=\frac{\sqrt{\pi }\widetilde{R_{n}}(\widetilde{t_{1}})}{4}$
, $\widetilde{t_{2}}=\frac{\widetilde{R_{n}}(\widetilde{t_{2}})}{8}\sqrt{8\widetilde{[R_{n}}(\widetilde{t_{2}})]^{2}+\pi }$
and
$\widetilde{t_{2}}=\frac{\widetilde{R_{n}}(\widetilde{t_{2}})}{8}\sqrt{8\widetilde{[R_{n}}(\widetilde{t_{2}})]^{2}+\pi }$
and $\widetilde{t_{3}}=\frac{\sqrt{2}\pi }{32}\ln (\sqrt{\frac{8}{\pi }}\widetilde{R_{n}}+\sqrt{\frac{8\widetilde{R_{n}}^{2}}{\pi }+1})$
, which are shown in Figure 3. The summation of the three terms is also displayed by empty circles in Figure 3. At short times
$\widetilde{t_{3}}=\frac{\sqrt{2}\pi }{32}\ln (\sqrt{\frac{8}{\pi }}\widetilde{R_{n}}+\sqrt{\frac{8\widetilde{R_{n}}^{2}}{\pi }+1})$
, which are shown in Figure 3. The summation of the three terms is also displayed by empty circles in Figure 3. At short times $\tilde{t}$
<< 1, all curves follow the linear
$\tilde{t}$
<< 1, all curves follow the linear $\widetilde{R_{n}}\sim \tilde{t}$
scaling, and the value of
$\widetilde{R_{n}}\sim \tilde{t}$
scaling, and the value of $\widetilde{R_{n}}$
is mainly determined by the first term
$\widetilde{R_{n}}$
is mainly determined by the first term $\widetilde{t_{1}}=\frac{\sqrt{\pi }\widetilde{R_{n}}(\widetilde{t_{1}})}{4}$
. At long times
$\widetilde{t_{1}}=\frac{\sqrt{\pi }\widetilde{R_{n}}(\widetilde{t_{1}})}{4}$
. At long times $\tilde{t}$
>> 1, the value of
$\tilde{t}$
>> 1, the value of $\widetilde{R_{n}}$
is mainly determined by the second term
$\widetilde{R_{n}}$
is mainly determined by the second term $\widetilde{t_{2}}=\frac{\widetilde{R_{n}}(\widetilde{t_{2}})}{8}\sqrt{8\widetilde{[R_{n}}(\widetilde{t_{2}})]^{2}+\pi }$
, which indicates a scaling of
$\widetilde{t_{2}}=\frac{\widetilde{R_{n}}(\widetilde{t_{2}})}{8}\sqrt{8\widetilde{[R_{n}}(\widetilde{t_{2}})]^{2}+\pi }$
, which indicates a scaling of $\widetilde{R_{n}}\sim \tilde{t}^{1/2}$
. The cross-over of the summation curve occurs near
$\widetilde{R_{n}}\sim \tilde{t}^{1/2}$
. The cross-over of the summation curve occurs near $\tilde{t}$
= 1. More specifically, the cross-over starts after the intersection at
$\tilde{t}$
= 1. More specifically, the cross-over starts after the intersection at $\tilde{t}=\sqrt{\pi (\pi -1)/32}$
≈ 0.459 between the first and second terms. In addition, with increasing R
c
, the surface tension term in (3.5) may become trivial as R
c
≈ R
n
. This analysis implies that the experimental scaling when
$\tilde{t}=\sqrt{\pi (\pi -1)/32}$
≈ 0.459 between the first and second terms. In addition, with increasing R
c
, the surface tension term in (3.5) may become trivial as R
c
≈ R
n
. This analysis implies that the experimental scaling when $\tilde{t}$
> 1 may be slightly smaller than the 1/2 prediction since (3.7) suggests a 1/3 scaling when the surface tension effect is not important.
$\tilde{t}$
> 1 may be slightly smaller than the 1/2 prediction since (3.7) suggests a 1/3 scaling when the surface tension effect is not important.
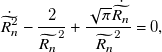
Dimensionless $\widetilde{R_{n}}(\tilde{t})$
∼
$\widetilde{R_{n}}(\tilde{t})$
∼ $\tilde{t}$
relation (empty circles) obtained from (3.8) contains three parts, as displayed by the blue solid curve, purple dashed curve and red dash-dotted curve.
$\tilde{t}$
relation (empty circles) obtained from (3.8) contains three parts, as displayed by the blue solid curve, purple dashed curve and red dash-dotted curve.
It is necessary to discuss alternative theories regarding the scaling of neck growth. As mentioned above, the simulation results from Anthony et al. (Reference Anthony, Kamat, Thete, Munro, Lister, Harris and Basaran2017, Reference Anthony, Harris and Basaran2020) showed a 1/2 scaling rather than a linear scaling of neck growth. A fundamental difference between the two viewpoints is whether the initial contact is a point contact or a Taylor–Culick-type bridge of finite size. The works of Anthony et al. have shown that if the initial condition is a point contact featuring coalescence singularity, the neck growth follows a 1/2 scaling. While if the contact is a Taylor–Culick-type bridge of finite size, the linear ILV regime appears before the 1/2 inertial scaling. Nonetheless, the lack of resolution of the initial contact condition has led to debate regarding the ILV regime, which will be further discussed based on our experimental results in § 4.2.
3.2. Numerical simulation
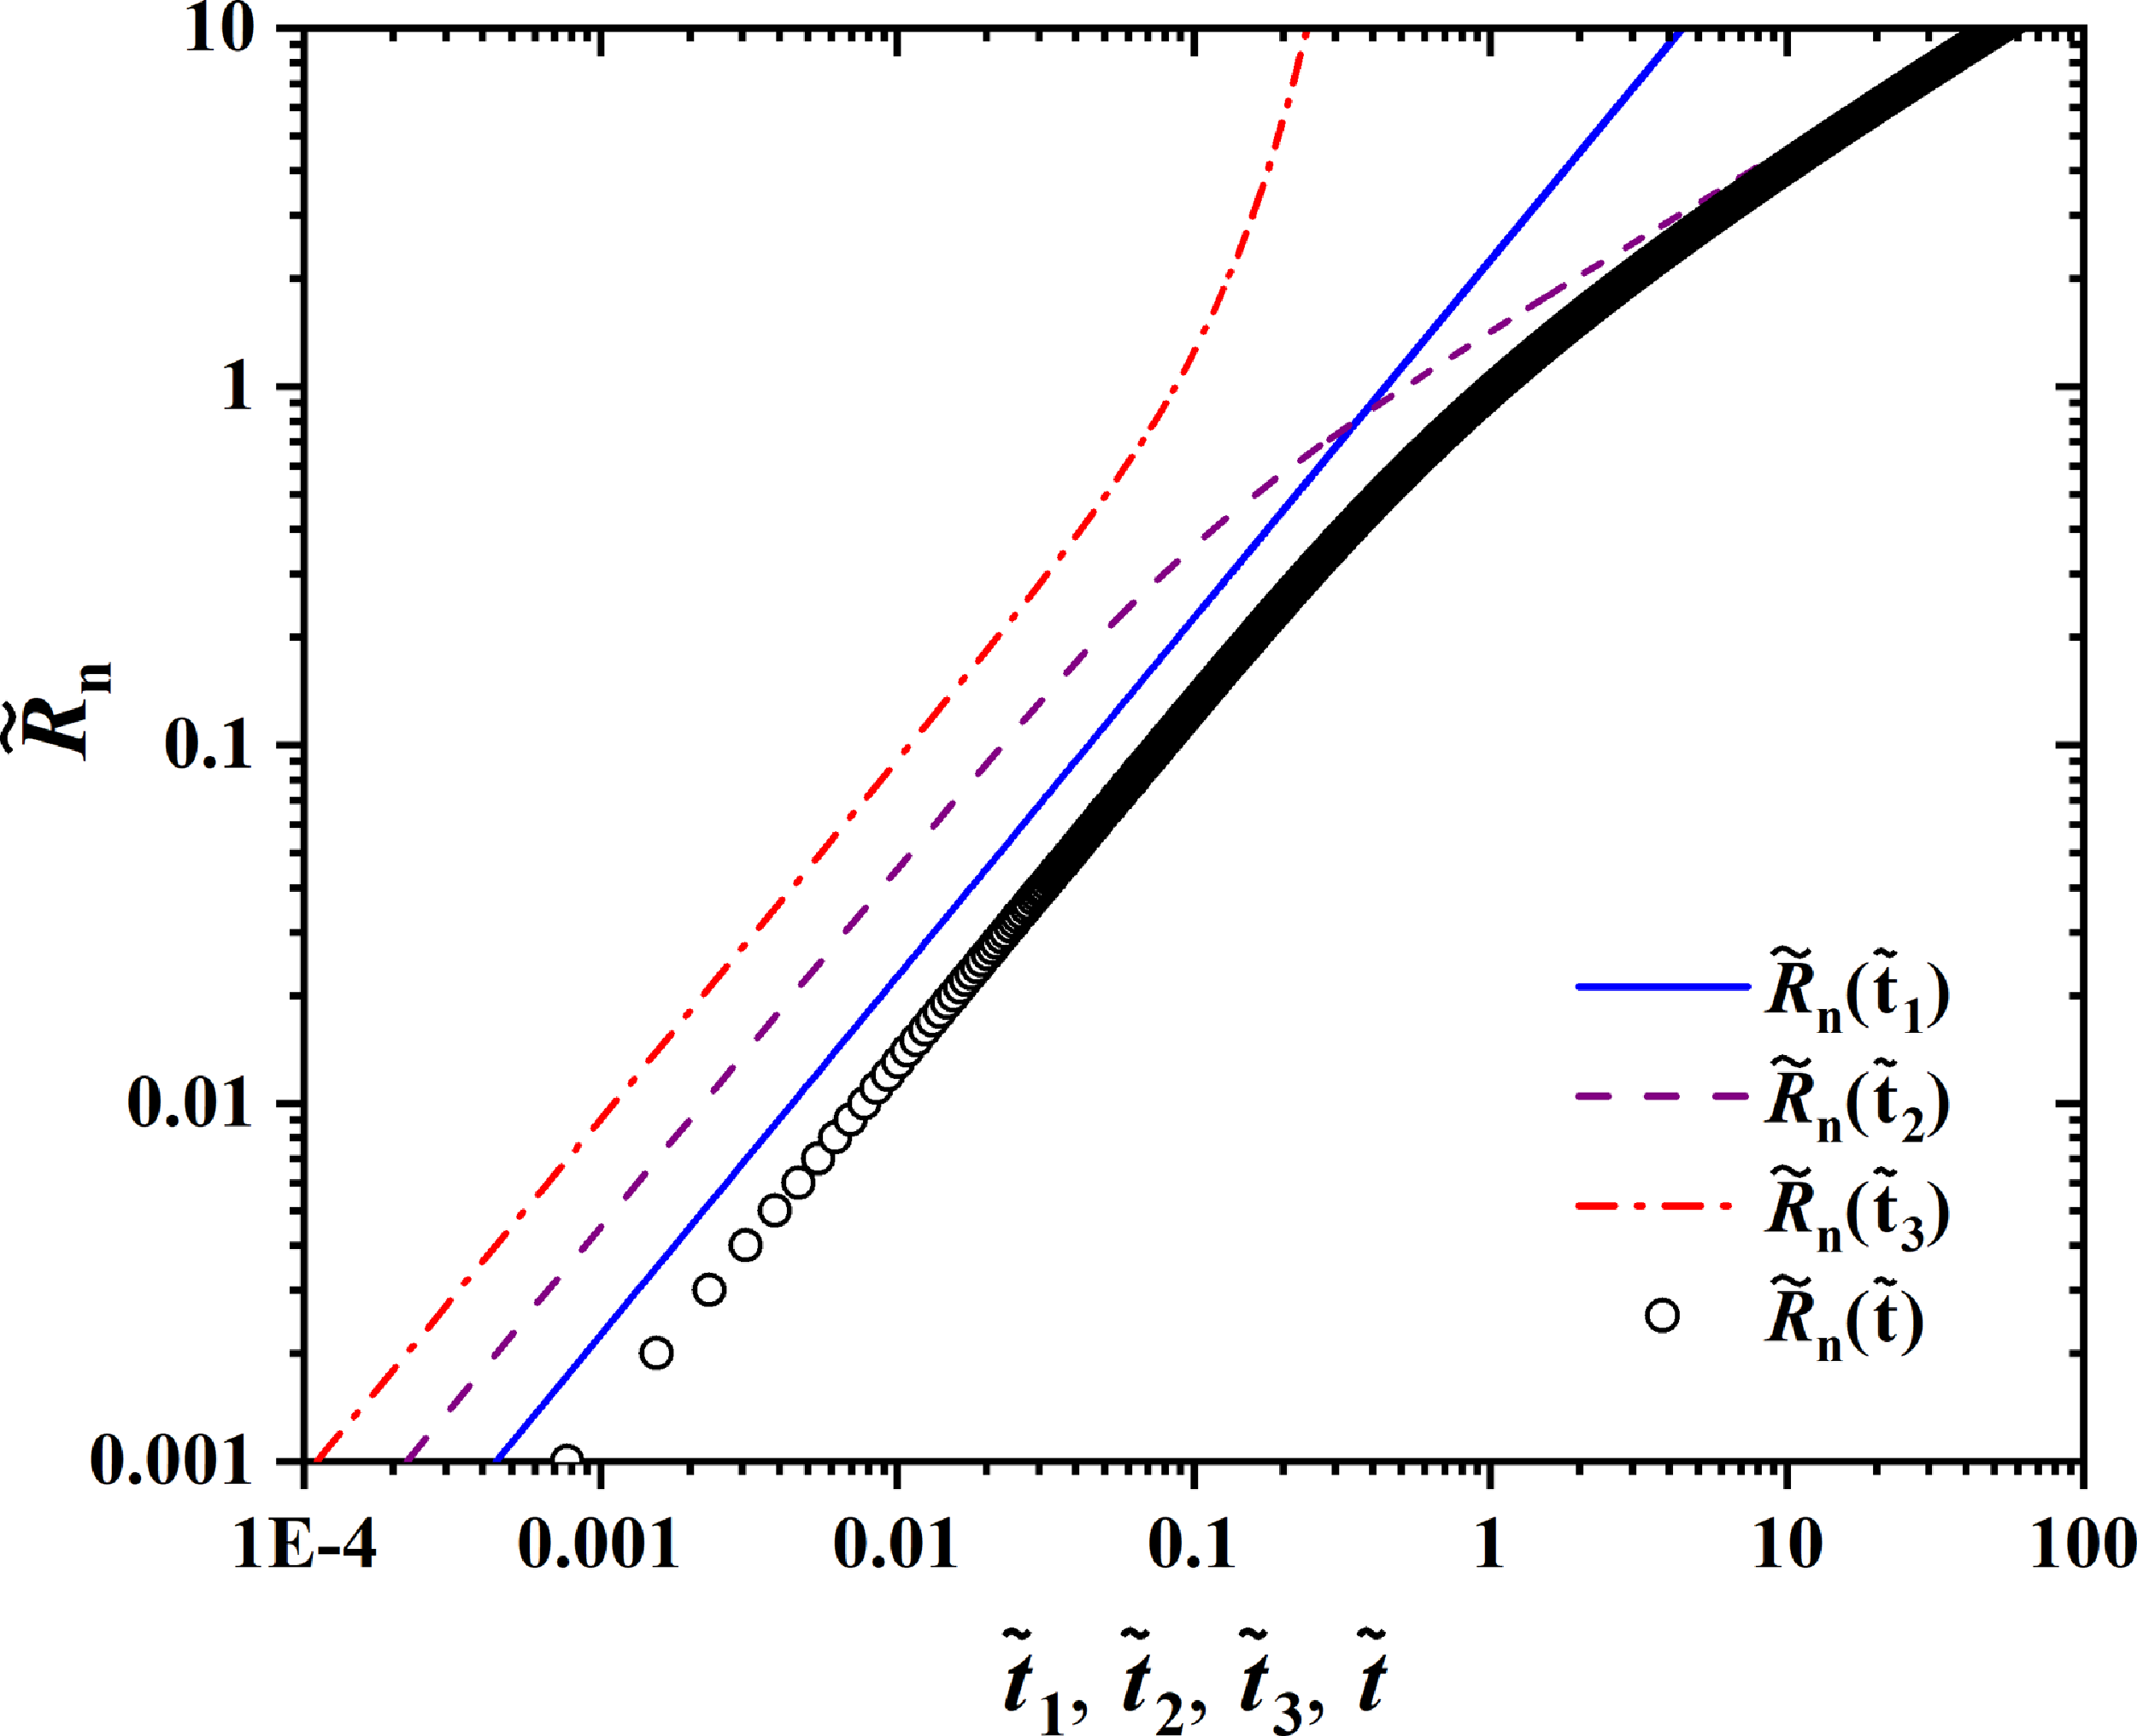
To understand the evolution of neck growth in detail, we conducted a numerical analysis of the bubble coalescence process. The numerical model of the bubble coalescence process consists of a particle with two same size bubbles merging next to it. The radii of the JM and the bubble were both set as 20 µm, close enough to the dimensions observed in our experiments. Unliked in the experiments, the particle was fixed to measure the forces induced by the coalescence process. The simulation domain was initially fully occupied with solutions other than particles and bubbles, and its dimensions were set as 180 × 180 × 120 µm, which were large enough to neglect the far-field effect from boundaries. For the boundaries, the top and side boundaries were set as free stream boundaries (mixed boundary conditions), while the bottom boundary was treated as a substrate (non-slip boundary condition). The first plot of Figure 4 shows the initial locations of the JM and bubbles before the coalescence process occurs.
Left panel: vertical view of the temporal evolution of the bubble coalescence process at 0, 2.5, 4.5, 6.5, 10.5 and 19.5 µ $\mathrm{s}$
. The numerical snapshots are in good agreement with the experimental results shown in Figure 2
(a). Right panel: the local flow field induced by the bubble coalescence process at 6.5 µ
$\mathrm{s}$
. The numerical snapshots are in good agreement with the experimental results shown in Figure 2
(a). Right panel: the local flow field induced by the bubble coalescence process at 6.5 µ $\mathrm{s}$
.
$\mathrm{s}$
.
Here, for conciseness, we list only the main governing equations of the multiphase model. By assuming incompressible fluids and neglecting the microscale gravity effect, the fluid flow of both liquid and gas obeys the continuum and multiphase Navier–Stokes equations, which are written in the following forms:
 \begin{align}\nabla \cdot \mathbf{u}&=0,\end{align}
 \begin{align}\frac{\partial \rho \mathbf{u}}{\partial t}+\nabla \cdot (\rho \mathbf{uu})-\nabla \cdot (\mu \nabla \mathbf{u})&-\nabla \mathbf{u}\cdot \nabla \mu =-\nabla p+\sigma \kappa \nabla \alpha,\\[8pt]\nonumber\end{align}
where α is the volume fraction of the liquid phase and κ is the local curvature of the liquid–gas interface. The first two terms on the left-hand side of (3.10) represent the inertial effect, and the third and fourth terms represent the viscous effect resulting from the fluid viscosity evolution due to interface motion. The terms on the right-hand side of the equation are the pressure gradient and surface tension force terms. This form is the classical volume-of-fluid interface capturing approach used to describe the Navier–Stokes equations for two immiscible fluids (Annaland et al. Reference Annaland, Deen and Kuipers2005). The evolution of the volume fraction of the liquid and gas phases obeys the following advection equation:
 \begin{equation}\frac{\partial \alpha }{\partial t}+\mathbf{u}\cdot \nabla \alpha =0.\end{equation}
By using the set of equations mentioned above, we can model the bubble coalescence process next to the particle. This multiphase model was solved using the widely used interFoam solver from the OpenFOAM open-source CFD package (Hrvoje Reference Hrvoje2009) and has been thoroughly validated for gas–liquid multiphase simulation applications. The readers are referred to the theoretical manual of the OpenFOAM for the details of numerical implementation.
Figure 4 shows the neck evolution snapshots obtained from the simulations. These simulations are in good agreement with the experimental observations in Figure 2a. Similarly, we found a decrease in neck growth as well as a difference in neck growth between the near and far sides.
4. Results
4.1. Neck growth in the whole bubble coalescence process
We first present the experimental results of the neck growth during the entire bubble coalescence process. This experiment was performed using a Pt-SiO2 JM with radius R JM = 37.41 µm in 80 % glycerol-H2O2 solution. The radii of the bubbles before coalescence were considered identical: R b = 29.24 µm and 29.92 µm. The surface tension of the solution was 59.6 mN m−1, which led to a capillary time of τ = 23.38 µs. Here, the bubble coalescence takes a longer time (more than t = 36.89 µs) to finish, as shown in Figure 5a, than the shorter duration of roughly t = 19.26 µs, as shown Figure 2a. In addition, Figure 5a reveals the asymmetric neck growth between the near and far sides due to the confinement effect of the JM, especially when R n > R b /2. In this section, we first focus on the neck growth on the far side, and only experimental data from the far side are provided in Figures 5 and 6. The confinement effect and the near-side data are discussed later in § 4.3.
(a) Snapshots of bubble coalescence in 80 % glycerol-H2O2 solution, which were obtained from supplementary movie S2. (b) Growth of the neck radius Rn versus time t. A comparison of the experimental data with the theoretical model $\frac{R_{n}}{R_{b}}=B\sqrt{\frac{t}{{\unicode[Arial]{x03C4}} }}$
is displayed in the inset, where the fit parameter is B = 0.550. (c) Temporal evolution of the outer curvature radius Rc during bubble coalescence. The inset shows the relation of Rc versus Rn, and a dashed line is plotted to highlight Rc < Rn in the early coalescence.
$\frac{R_{n}}{R_{b}}=B\sqrt{\frac{t}{{\unicode[Arial]{x03C4}} }}$
is displayed in the inset, where the fit parameter is B = 0.550. (c) Temporal evolution of the outer curvature radius Rc during bubble coalescence. The inset shows the relation of Rc versus Rn, and a dashed line is plotted to highlight Rc < Rn in the early coalescence.
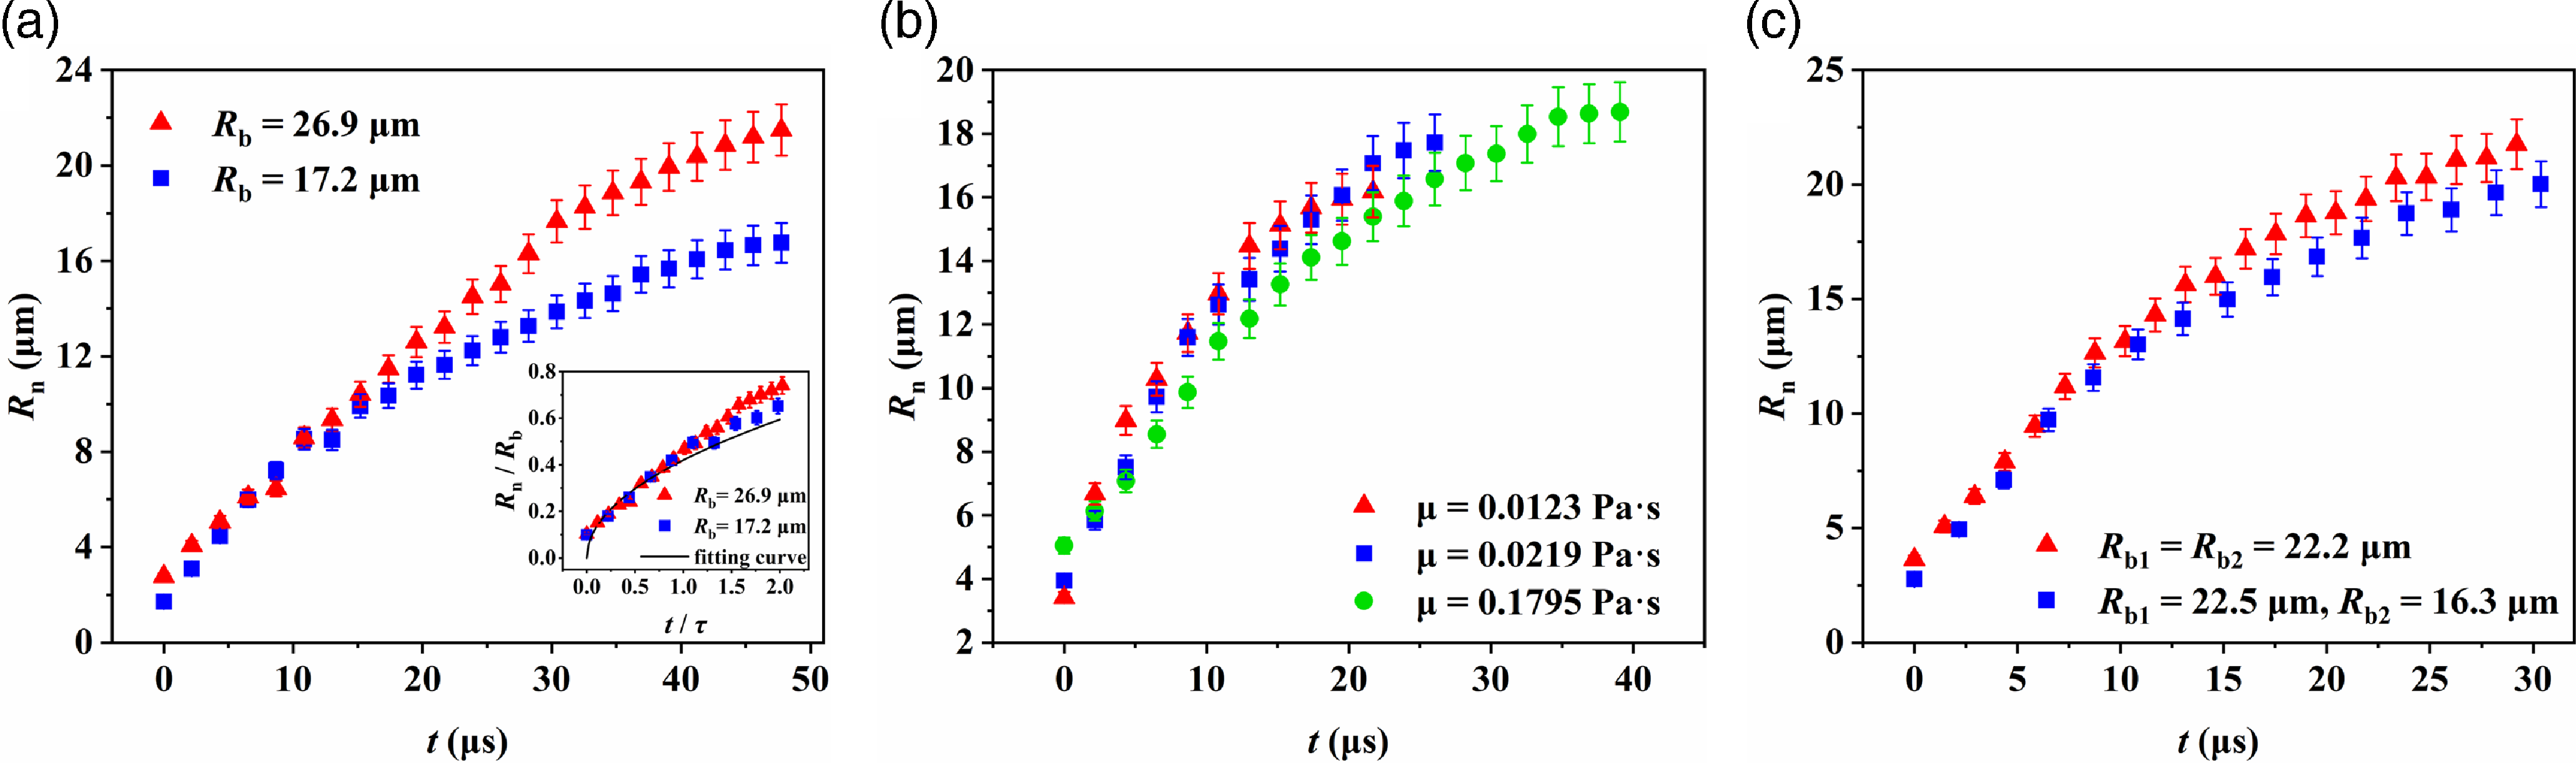
Neck growth is influenced by (a) bubble size and (b) fluid viscosity. In panel (a), the radii of the identical bubbles are 26.9 µm (red triangles) and 17.2 µm (blue squares), and 50 % glycerol-H2O2 solution is used for both cases. In panel (b), the glycerol concentrations are 40 % (red triangles), 50 % (blue squares) and 80 % (green circles), corresponding to fluid viscosities ranging from 12.3 to 179.5 mPa.s. The bubble radii are all within 17.9 ± 1.5 µm. In addition, the neck growth behaviour of non-identical bubbles is shown in panel (c). In panel (c), the red triangles represent data using identical bubbles with Rb1 ≈ Rb2 = 22.2 ± 0.6 µm as a reference, and the blue squares represent data of non-identical bubbles with a larger bubble with Rb1 = 22.5 µm similar to the former case, and a smaller bubble with Rb2 = 16.3 µm.
The temporal variation in the neck radius R
n
in 80 % glycerol-H2O2 solution is shown in Figure 5b, in which one observes that the neck growth rate decreases with time. The experimental data are compared with the theoretical model $\frac{R_{n}}{R_{b}}=B\sqrt{\frac{t}{{\unicode[Arial]{x03C4}} }}$
that predicts a 1/2 scaling as described in (3.2) (Case & Nagel, Reference Case and Nagel2008; Paulsen et al. Reference Paulsen, Burton and Nagel2011). This 1/2 scaling of the inertial regime is shown by a fitted solid curve in the inset of Figure 5b and effectively describes the tendency of the experimental data. The fit parameter B in the theoretical model is approximately B = 0.550. We notice that the best fit to the experimental tendency is usually within t/τ ≤ 1, which is roughly in accordance with the reported range t/τ ≤ 0.5 from Thoroddsen et al. (Reference Thoroddsen, Takehara and Etoh2005) and Soto et al. (Reference Soto, Maddalena, Fraters, van der Meer and Lohse2018). Nonetheless, a slight deviation in the late process occurs when t/τ>2; here, the increase of the experimental data becomes slower than the theoretical curve. Note that the neck coalescence process is finished when t/τ> 2 (t> 47 µs as τ = 23.38 µs), according to Figure 5a. Afterwards, a further increase in R
n
reflects the coupling effect of bubble deformation and the drag force due to surface tension from the near side. Ideally, the former effect should promote an increase in R
n
, which causes a larger R
n
than the theoretical curve; however, the latter should hinder the increase in R
n
on the far side. Here, we observe a slower increase in R
n
when t/τ> 2, which is attributed to a stronger surface tension effect from the near side. The effect of the asymmetric neck growth due to confinement of the JM is discussed in § 4.3.
$\frac{R_{n}}{R_{b}}=B\sqrt{\frac{t}{{\unicode[Arial]{x03C4}} }}$
that predicts a 1/2 scaling as described in (3.2) (Case & Nagel, Reference Case and Nagel2008; Paulsen et al. Reference Paulsen, Burton and Nagel2011). This 1/2 scaling of the inertial regime is shown by a fitted solid curve in the inset of Figure 5b and effectively describes the tendency of the experimental data. The fit parameter B in the theoretical model is approximately B = 0.550. We notice that the best fit to the experimental tendency is usually within t/τ ≤ 1, which is roughly in accordance with the reported range t/τ ≤ 0.5 from Thoroddsen et al. (Reference Thoroddsen, Takehara and Etoh2005) and Soto et al. (Reference Soto, Maddalena, Fraters, van der Meer and Lohse2018). Nonetheless, a slight deviation in the late process occurs when t/τ>2; here, the increase of the experimental data becomes slower than the theoretical curve. Note that the neck coalescence process is finished when t/τ> 2 (t> 47 µs as τ = 23.38 µs), according to Figure 5a. Afterwards, a further increase in R
n
reflects the coupling effect of bubble deformation and the drag force due to surface tension from the near side. Ideally, the former effect should promote an increase in R
n
, which causes a larger R
n
than the theoretical curve; however, the latter should hinder the increase in R
n
on the far side. Here, we observe a slower increase in R
n
when t/τ> 2, which is attributed to a stronger surface tension effect from the near side. The effect of the asymmetric neck growth due to confinement of the JM is discussed in § 4.3.
We also measured the temporal variation in the curvature radius R
c
of the outer profile. The variation in R
c
reveals different behaviours during and after the coalescence process. As shown in Figure 5c, we find a transition at approximately t ≈ 47 µs, from a smooth increase in R
c
to a sharp increase. Interestingly, this transition time is similar to the moment of t/τ = 2 mentioned above. The results in Figure 5c shows the competition between R
n
and R
c
in the surface tension term $2{\unicode[Arial]{x03C3}} \left(\frac{1}{R_{c}}-\frac{1}{R_{n}}+\frac{2}{R_{b}}\right)$
of (3.5), in which the transition is clearly displayed for the first time to the best of our knowledge. Before t = 2τ, the increase in both R
n
and R
c
is governed by the coalescence dynamics. After t = 2τ, the evolution is influenced by other effects, such as bubble deformation. In this stage, R
c
increases to infinity accompanied by bubble deformation that flattens the outer profile. The bubble deformation may cause surface wave propagation after coalescence (Gilet et al. Reference Gilet, Mulleners, Lecomte, Vandewalle and Dorbolo2007; Soto et al. Reference Soto, Maddalena, Fraters, van der Meer and Lohse2018). Unfortunately, due to the much smaller bubble size in our experiment than in Soto’s experiment, we did not observe clear propagation of the surface deformation waves.
$2{\unicode[Arial]{x03C3}} \left(\frac{1}{R_{c}}-\frac{1}{R_{n}}+\frac{2}{R_{b}}\right)$
of (3.5), in which the transition is clearly displayed for the first time to the best of our knowledge. Before t = 2τ, the increase in both R
n
and R
c
is governed by the coalescence dynamics. After t = 2τ, the evolution is influenced by other effects, such as bubble deformation. In this stage, R
c
increases to infinity accompanied by bubble deformation that flattens the outer profile. The bubble deformation may cause surface wave propagation after coalescence (Gilet et al. Reference Gilet, Mulleners, Lecomte, Vandewalle and Dorbolo2007; Soto et al. Reference Soto, Maddalena, Fraters, van der Meer and Lohse2018). Unfortunately, due to the much smaller bubble size in our experiment than in Soto’s experiment, we did not observe clear propagation of the surface deformation waves.
In our theoretical analysis (§ 3.1), a simplification of the surface tension term $2{\unicode[Arial]{x03C3}} \left(\frac{1}{R_{c}}-\frac{1}{R_{n}}+\frac{2}{R_{b}}\right)$
as 2σ/R
c was made based on the assumption of R
c
< R
n
. We can verify this point since both neck radius R
n
and outer curvature radius R
c
were measured in the experiments. In the inset of Figure 5c, we thus plot the curve of R
c
versus R
n
. A dashed line is drawn in this plot to highlight that the relation R
c
< R
n
is valid during the coalescence process. The cross-over occurs at R
c
= R
n
≈ 23 µm when t ≈ 48 µs ∼ 2τ. After that, R
c
rapidly increases to infinity and has a much faster rate than that of R
n
. The result of R
c
in Figure 5c indicates a clear boundary separating the dynamics of bubble coalescence and bubble deformation at approximately R
c
= R
n
when t ≈ 2τ. This can be correlated with the beginning of the deviation from the theoretical curve in Figure 5b.
$2{\unicode[Arial]{x03C3}} \left(\frac{1}{R_{c}}-\frac{1}{R_{n}}+\frac{2}{R_{b}}\right)$
as 2σ/R
c was made based on the assumption of R
c
< R
n
. We can verify this point since both neck radius R
n
and outer curvature radius R
c
were measured in the experiments. In the inset of Figure 5c, we thus plot the curve of R
c
versus R
n
. A dashed line is drawn in this plot to highlight that the relation R
c
< R
n
is valid during the coalescence process. The cross-over occurs at R
c
= R
n
≈ 23 µm when t ≈ 48 µs ∼ 2τ. After that, R
c
rapidly increases to infinity and has a much faster rate than that of R
n
. The result of R
c
in Figure 5c indicates a clear boundary separating the dynamics of bubble coalescence and bubble deformation at approximately R
c
= R
n
when t ≈ 2τ. This can be correlated with the beginning of the deviation from the theoretical curve in Figure 5b.
The neck evolution is also influenced by many factors, including bubble size and fluid viscosity. We compare the experimental data of the neck radius using different generated bubbles in Figure 6a. Here, the radii of the identical bubbles are 26.9 µm and 17.2 µm, respectively, and 50 % glycerol-H2O2 solution is used for both cases. The two curves in Figure 6a show similar neck growth behaviour before t = 15.2 µs independent of the bubble size. Therefore, consistent normalised behaviour at t/τ< 1 in the inset of Figure 6a is observed. Notably, the deviation of the experimental data from the theoretical curve in a glycerol solution at a low concentration (i.e. low viscosity) is opposite to the result of the high glycerol concentration case in Figure 5b. We suspect that competition between viscosity and surface tension dominates this different increasing behaviour of R n . In low viscosity solutions, bubble deformation is faster leading to faster expansion of R n ; thus, the dragging of the surface tension from the near side can be overcome.
The effect of fluid viscosity is illustrated in Figure 6b, in which by changing the glycerol concentration from 40 % to 80 %, the fluid viscosity is varied from 12.3 to 179.5 mPa.s. However, as the typical capillary time scale τ does not change with fluid viscosity, we observe similar bubble coalescence behaviour in Figure 6b. Note that the bubble radii of the three curves in Figure 6b are all within 17.9 ± 1.5 µm, and the surface tension decreases slightly from 0.0627 to 0.0596 N m−1 (Table 1). These data here again demonstrate that the capillary time τ can effectively describe the temporal evolution of the neck.
In practice, the two coalescing bubbles are usually not identical. In Figure 6c, we show the neck growth behaviour for non-identical bubbles in the same 50% glycerol-H2O2 solution. In the case of non-identical bubbles, the radius of the larger bubble is 22.5 µm and that of the smaller bubble is 16.3 µm. The experimental data of the identical bubbles whose radii (R b = 22.2 µm) are similar to those of the larger bubble are provided by the red triangles in Figure 6c as a reference. The size difference causes pressure difference between the two bubbles, whereas we do not observe the acceleration of the neck growth caused by the pressure difference. This occurs because coalescence is governed mainly by local flows.
4.2. Universal scaling of neck growth
For a long time, the key issue in the study of the neck growth during bubble coalescence has been identifying its universal scaling. As analysed in the theoretical part in § 3.1 (also see Figure 3), we expected a linear scaling of the inertially limited viscous regime at the beginning of the coalescence and a cross-over to a 1/2 scaling of the inertial regime. To verify this, we introduce the dimensionless forms $\widetilde{R_{n}}=R_{n}/2OhR_{b}$
and
$\widetilde{R_{n}}=R_{n}/2OhR_{b}$
and $\tilde{t}=t\sigma /2\mu OhR_{b}$
based on the Ohnesorge number Oh and plot the dimensionless results of
$\tilde{t}=t\sigma /2\mu OhR_{b}$
based on the Ohnesorge number Oh and plot the dimensionless results of $\widetilde{R_{n}}\sim \tilde{t}$
in Figure 7. To avoid undesired influences in the late coalescence process such as the surface tension singularity near R
n
= R
c
and the confinement effect of the JM, only the data when R
n
< R
c
are plotted in Figure 7.
$\widetilde{R_{n}}\sim \tilde{t}$
in Figure 7. To avoid undesired influences in the late coalescence process such as the surface tension singularity near R
n
= R
c
and the confinement effect of the JM, only the data when R
n
< R
c
are plotted in Figure 7.
Universal scaling of neck growth. The experimental data are shown by different symbols, and the theoretical prediction of (3.8) is displayed by the red dashed curve. The scaling values of 1 when $\tilde{t}$
< 1 and 1/2 when
$\tilde{t}$
< 1 and 1/2 when $\tilde{t}$
> 1 are respectively marked in the figure.
$\tilde{t}$
> 1 are respectively marked in the figure.
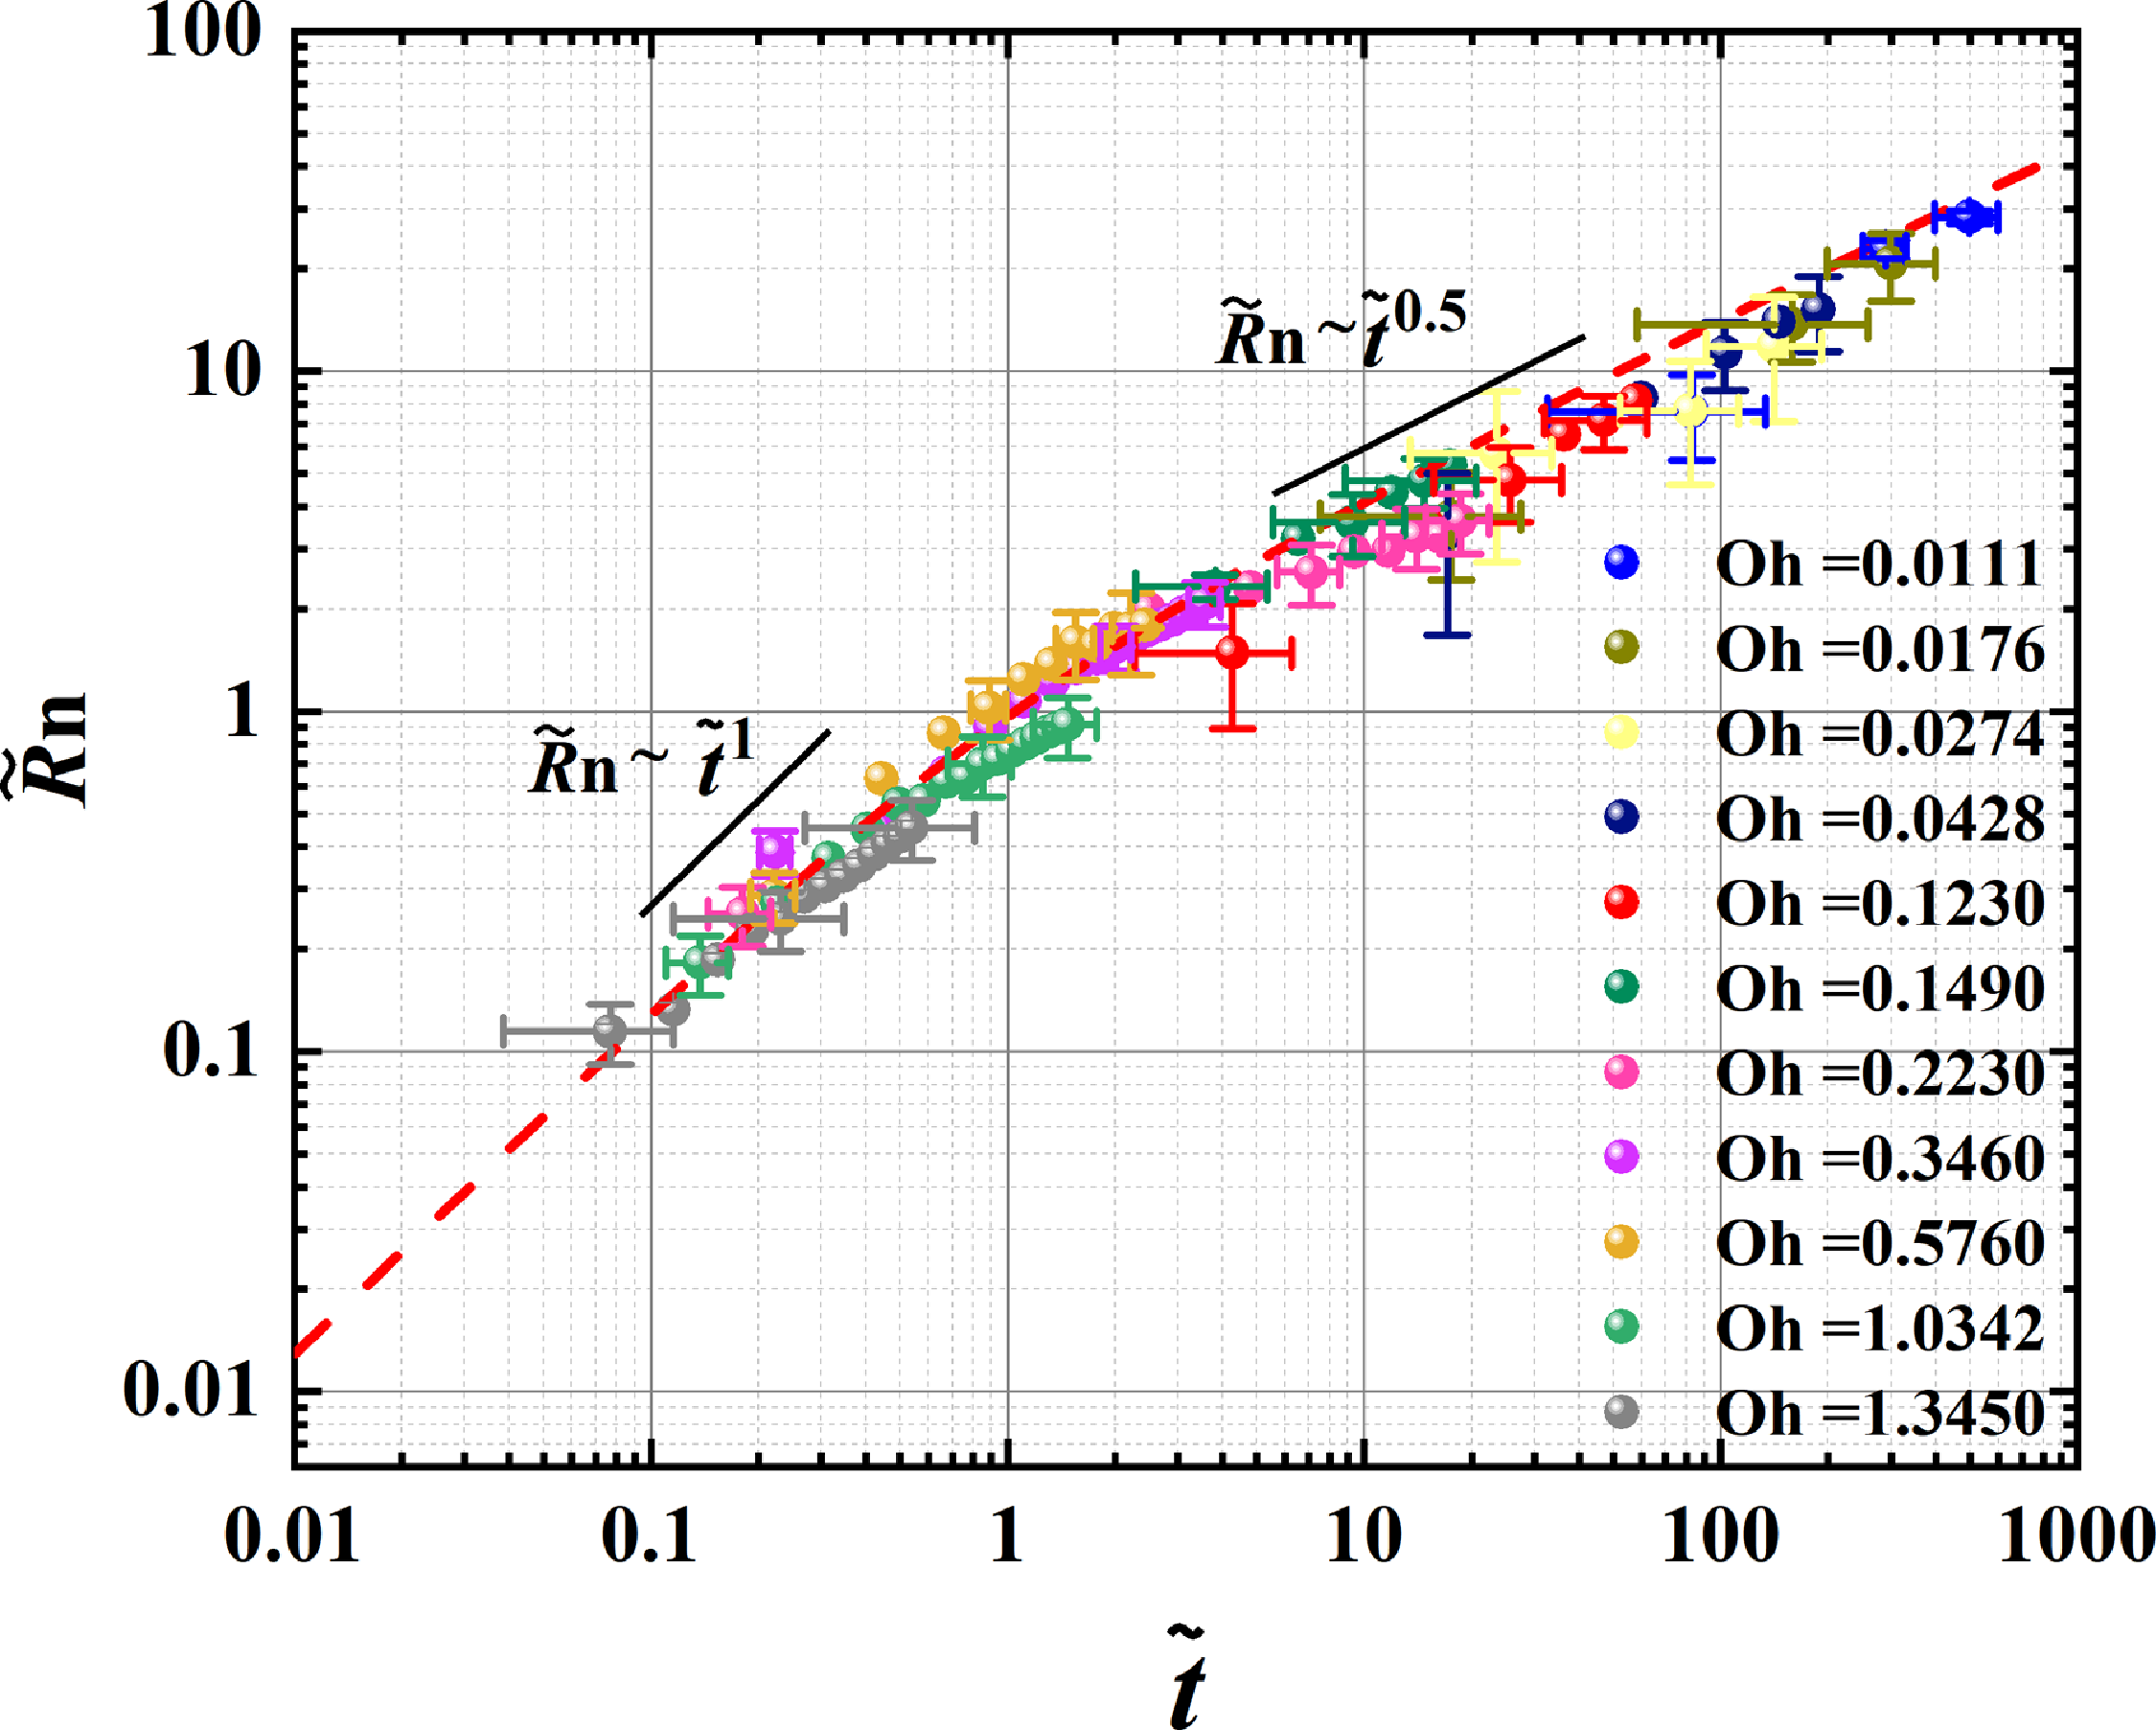
In Figure 7, we clearly observe a two-stage universal scaling of the neck growth, covering a wide range of Oh from approximately 0.01 to 1.35. The cross-over is approximately located at $\tilde{t}$
= 1. The linear scaling indicating the inertially limited viscous regime is clearly displayed when
$\tilde{t}$
= 1. The linear scaling indicating the inertially limited viscous regime is clearly displayed when $\tilde{t}$
< 1, where the dimensionless neck radius is also approximately
$\tilde{t}$
< 1, where the dimensionless neck radius is also approximately $\widetilde{R_{n}}$
< 1. After the cross-over at
$\widetilde{R_{n}}$
< 1. After the cross-over at $\tilde{t}$
= 1, we observe the 1/2 scaling of the inertial regime located at
$\tilde{t}$
= 1, we observe the 1/2 scaling of the inertial regime located at $\tilde{t}$
= 1–1000, in which the neck radius increases from
$\tilde{t}$
= 1–1000, in which the neck radius increases from $\widetilde{R_{n}}$
= 1 to 30. This experimental result provides a complete demonstration of the universal scaling of the neck growth during bubble coalescence, which is in good agreement with the theory of (3.8) (dashed line in Figure 7). The cross-over can be more easily observed for higher Oh, i.e. Oh> 0.3, because of the stronger viscous effect. Interestingly, our scaling result of bubble coalescence is consistent with the scaling of drop coalescence reported by Paulsen et al. (Reference Paulsen, Burton, Nagel, Appathurai, Harris and Basaran2012) and Xia et al. (Reference Xia, He and Zhang2019). For both bubbles and fluids, the interface evolution during coalescence is dominated by the flow of a more viscous phase near the neck.
$\widetilde{R_{n}}$
= 1 to 30. This experimental result provides a complete demonstration of the universal scaling of the neck growth during bubble coalescence, which is in good agreement with the theory of (3.8) (dashed line in Figure 7). The cross-over can be more easily observed for higher Oh, i.e. Oh> 0.3, because of the stronger viscous effect. Interestingly, our scaling result of bubble coalescence is consistent with the scaling of drop coalescence reported by Paulsen et al. (Reference Paulsen, Burton, Nagel, Appathurai, Harris and Basaran2012) and Xia et al. (Reference Xia, He and Zhang2019). For both bubbles and fluids, the interface evolution during coalescence is dominated by the flow of a more viscous phase near the neck.
The error bars based on the measurement uncertainties (see § 2) are plotted in Figure 7. Since the deviations between the experimental data and the linear scaling when $\tilde{t}$
< 1 are within the range of error bars, we believe that our experiment indeed shows a linear regime before the well-accepted inertial 1/2 regime. Our experimental results imply that the initial contact between two bubbles in our cases is Taylor–Culick type rather than point contact. We agree that the debate on the ILV regime has not been resolved since higher resolution experimental evidence is needed to clarify how the initial contact condition influences the scaling law, as predicted by Anthony et al. (Reference Anthony, Kamat, Thete, Munro, Lister, Harris and Basaran2017, Reference Anthony, Harris and Basaran2020).
$\tilde{t}$
< 1 are within the range of error bars, we believe that our experiment indeed shows a linear regime before the well-accepted inertial 1/2 regime. Our experimental results imply that the initial contact between two bubbles in our cases is Taylor–Culick type rather than point contact. We agree that the debate on the ILV regime has not been resolved since higher resolution experimental evidence is needed to clarify how the initial contact condition influences the scaling law, as predicted by Anthony et al. (Reference Anthony, Kamat, Thete, Munro, Lister, Harris and Basaran2017, Reference Anthony, Harris and Basaran2020).
4.3. Asymmetric growth caused by confinement
The asymmetric growth of the far and near side of the neck is a prominent feature of the coalescence dynamics in our double-bubble-powered micromotor system, which cannot be observed in the common bubble coalescence process in an unconfined case. We first compare the experimental data in a 50 % glycerol solution with the numerical simulation results, and similar asymmetric growth behaviour is captured, as shown in Figure 4. The comparison in Figure 8a demonstrates a good agreement between the numerical results and the experimental data when the bubble sizes are similar. We observe a noticeable deviation between the far and near sides at approximately t ∼ 4 µs, which is much earlier than the typical capillary time of τ = 12.3 µs in this case. At t ∼ τ, the difference between the two sides are as follows: R n_far – R n_near ≈ 15.0 – 11.3 = 3.7 µm. Based on the simulation results of the outer curvature radii of the far and near sides (R c_far = 9.6 µm, R c_near = 5.9 µm), the pressure difference can be calculated according to the Laplace equation,
 \begin{equation}p_{n\_ far}-p_{c\_ far}={\unicode[Arial]{x03C3}} (\frac{1}{R_{n\_ far}}-\frac{1}{R_{c\_ far}}),\quad p_{n\_ near}-p_{c\_ near}={\unicode[Arial]{x03C3}} (\frac{1}{R_{n\_ near}}-\frac{1}{R_{c\_ near}}).\end{equation}
Thus, the pressure difference between the near and far sides is estimated to be p c_near – p c_far ≈ σ(1/R n_far – 1/R c_far – 1/R c_near + 1/R c_near) = 2.7 kPa by assuming p n_near = p n_far. These results reflect the confinement effect on the near side due to the presence of the JM solid particle. In Figure 8(c), the velocity field near the neck region is highlighted to show the faster velocity decay on the near side than on the far side.
(a) Evolution of the far and near sides of the neck radius as a function of time in 50 % glycerol-H2O2 solution. The solid symbols are experimental data from Figure 2 with bubble radii of Rb = 21.3 µm and 22.3 µm, and the red and blue dash-dotted curves are simulation results on the far and near sides, respectively. (b) Log-log plot of the neck evolution on the near side showing an approximately 1/3 behaviour marked by the dashed line. (c) Velocity contour map near the neck region (in 50 % glycerol-H2O2) during coalescence. The position of the two bubbles is fully covered in white, and the part of the JM on top of each plot is covered in grey.
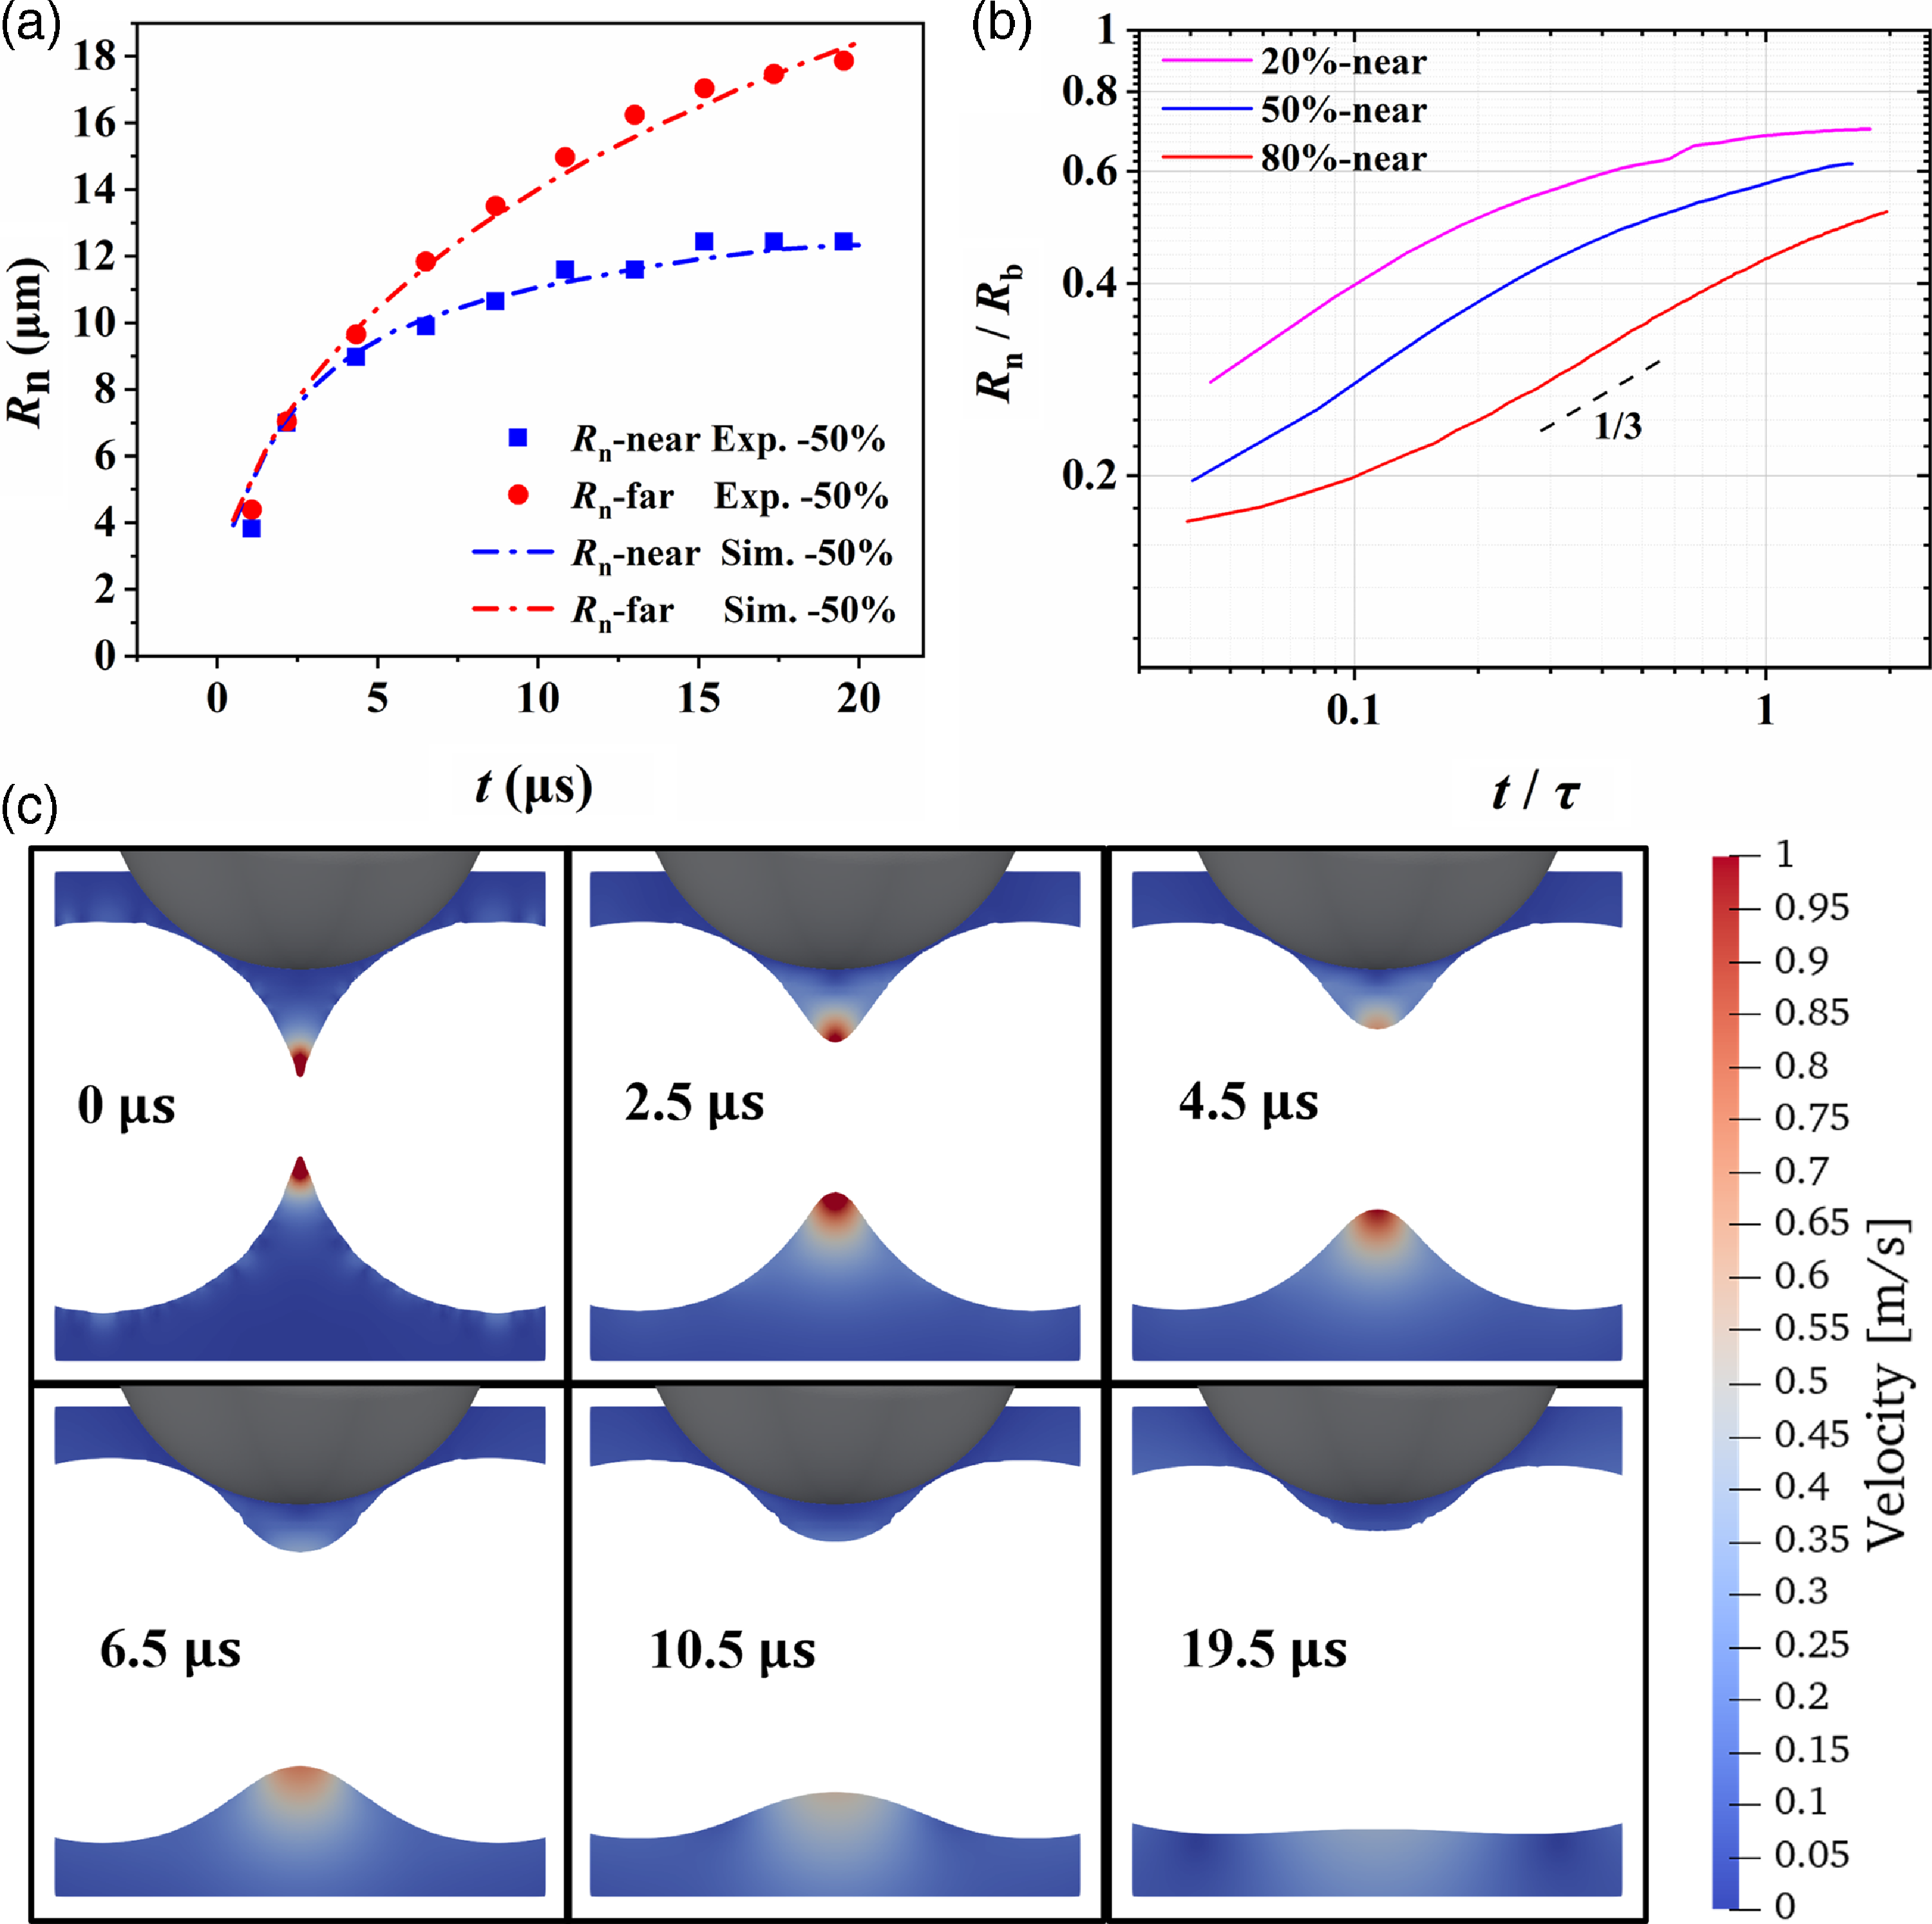
We further investigated the behaviour of the neck evolution on the near side. The numerical results obtained by varying the solution viscosity are shown in a double-logarithmic plot in Figure 8b. The solutions used were 20 %, 50 % and 80% glycerol-H2O2 solutions. It is not surprised that the evolution of the neck on the near side is hindered by the confinement of the solid JM, which thus manifests a scaling slower than the 1/2 tendency (3.2) of the far side. Asymmetric neck growth, especially the growth of the neck on the near side, involves complicated and coupled effects such as confinement from the solid JM on the near side of the neck, pressure differences caused by different outer curvature radii of the far and near sides, and tangential flow around the asymmetric neck. Due to the above difficulty, additional research is needed to elucidate the dynamics of the neck growth on the near side. Interestingly, we observe an approximately 1/3 scaling roughly at t/τ = 0.1–1 (Figure 8b). For the low viscosity case (20 %), our simulation shows that the 1/3 scaling appears at the beginning of the simulation (t ≈ 0.5 µs and t/τ ≈ 0.04), different from the common 1/2 scaling shown in Figure 5b. While for the high viscosity case (80 %), the neck growth is much slower than 1/3 scaling at the beginning when t/τ< 0.1, and 1/3 scaling appears in the intermediate regime at approximately t/τ ∼ 0.5. With increasing viscosity, the appearance of the 1/3 regime is gradually delayed. We speculate that the growth slower than 1/3 scaling for higher viscosity cases (50 % and 80 %) when t/τ< 0.1 reflects the hydrodynamic hinderance due to the confinement of the solid JM, whereas the acceleration to 1/3 scaling is caused by the surface tension from the far side with larger R n , which still needs further investigation. At a later stage when t/τ≥ 1, as the gap between the neck and the JM decreases, all curves of neck growth in Figure 8b flatten due to the confinement effect.
4.4. Deformation and detachment of the microbubbles after coalescence
For the bubble propulsion of a Janus micromotor, the coalescence of two bubbles and the detachment of the coalescing bubble provide the energy for the forward motion of the Janus microsphere. Bubble coalescence can release extra surface energy, and bubble detachment can transfer momentum to the Janus microsphere. However, an experimental video (supplementary movie S3) reveals more details on the correlation of the release of the surface energy and momentum transfer. Figure 9 displays some snapshots from supplementary movie S3, in which a dash-dotted line is used to mark the original position of the JM. We can see that bubble deformation after coalescence plays an important role in transferring the released surface energy to the JM, as shown at moments B and D in Figure 9a. At t = −6.7 µs in Figure 9a, the surface deformation wave rapidly travels along the coalescing bubble surface and reaches the two side apexes. The coalescence causes bubble deformation in the direction perpendicular to the JM’s propulsion direction. The surface wave of the bubble interface then transfers the impact to the JM when the deformation turns in the direction along the JM’s propulsion. This impact also results in detachment between the coalescing bubble and the JM, as shown at moment D in Figure 9a.
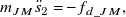
(a) Experimental snapshots during bubble detachment shown at moments A to G. The original JM centre is marked by an orange dash-dotted line. Bubble deformation and detachment (at moment D) both contribute to the JM’s propulsion. (b) Propelled displacement of the JM sJM during bubble coalescence and detachment obtained from the experiment. A theoretical curve of the displacements solved from (4.1). The corresponding moments A–G of the snapshots are marked in panel (b). (c) Acceleration of the JM versus time.
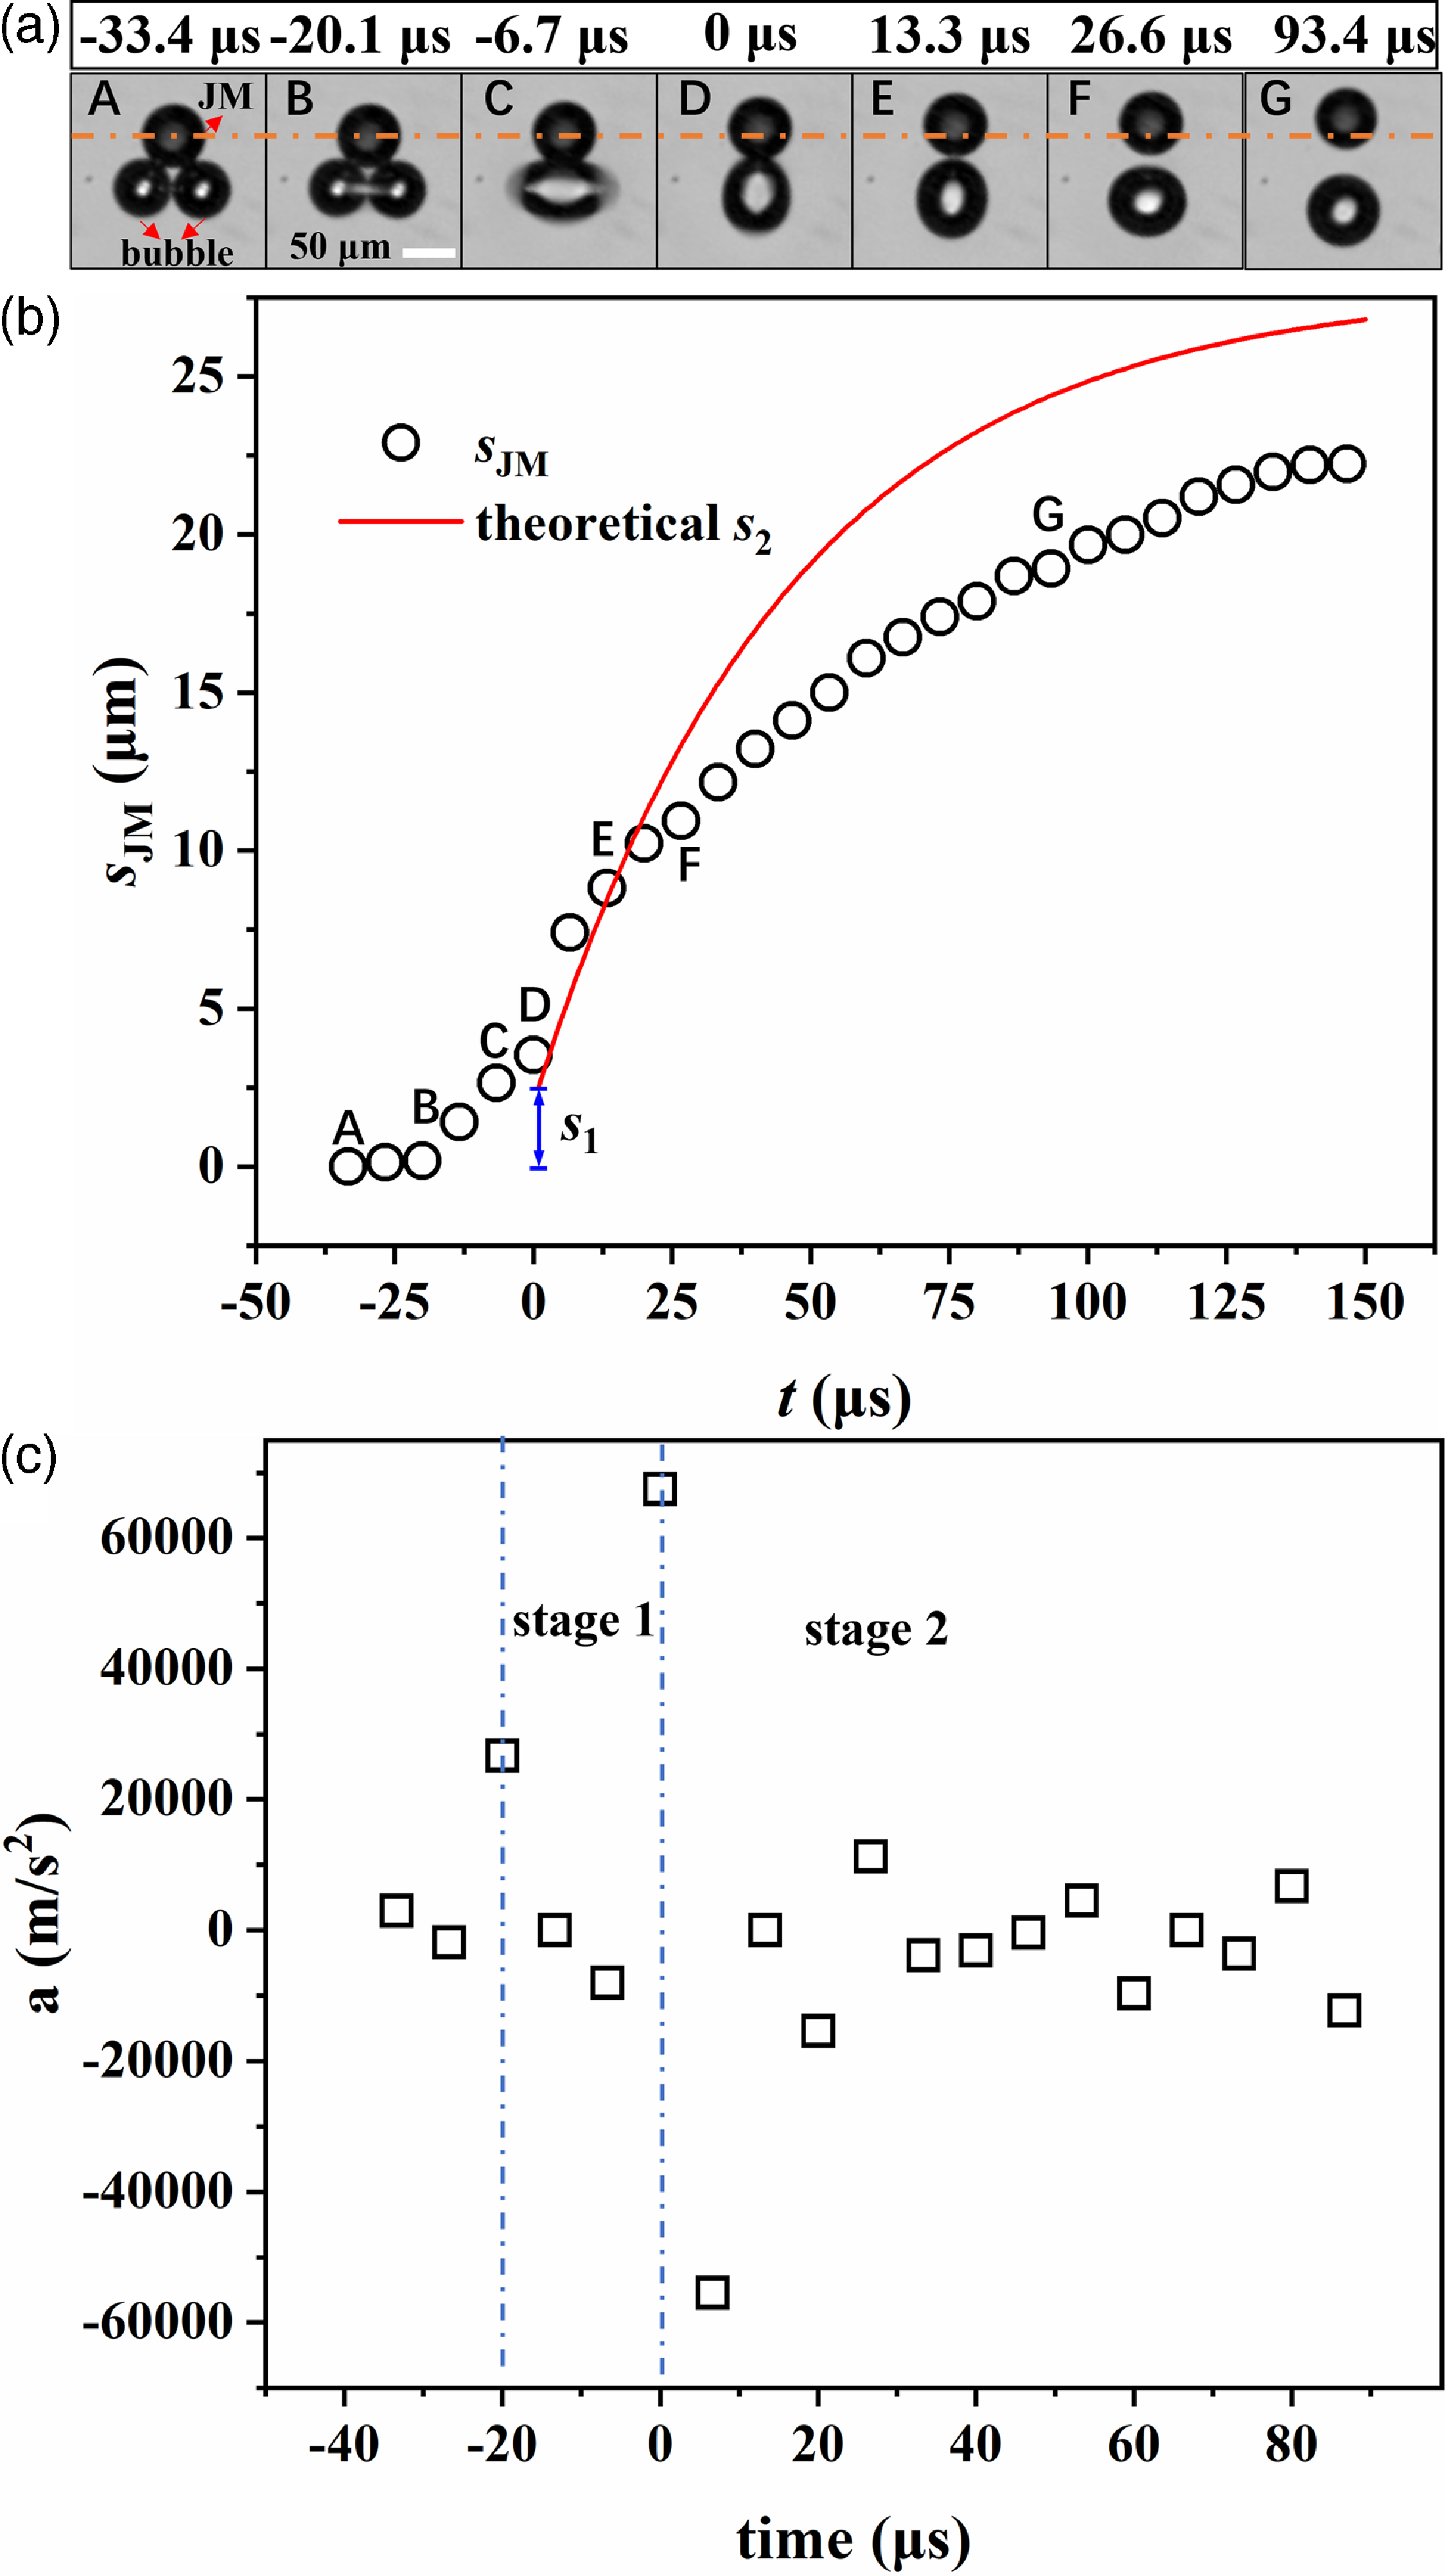
Therefore, according to Figure 9b, the propulsion of the JM has two sources. The JM’s displacement s can be divided into two parts: s JM = s 1 + s2, in which s 1 is the displacement that is produced during the bubble deformation from B to D before detachment, and s 2 is the displacement that is produced after bubble detachment by momentum transfer, as shown from D to G. We define the beginning time t = 0 µs at the moment D of bubble detachment. When t< 0, a small displacement is clearly observed and corresponds to the JM’s movement from B to D in the first stage in Figure 9a. The slopes ds 1/dt (from B to D) and ds 2/dt (from D to E) are quite different, indicating a switch in the main propulsion mechanism before and after bubble detachment.
The generation of this first displacement s 1 is attributed to the counteraction from the fluids in response to the deformation of the coalescing bubble. The coalescence and deformation process mainly exerts a repulsion force on the fluid on the bubble side, thus, the counteraction from the fluid propels the coalescing bubble and the JM as a whole to the side of the JM. During the first stage, the apparent propulsion speed of the JM according to the slope ds 1/dt is approximately 0.1 m s−1; in contrast, the mass centre of the coalescing bubble does not substantially shift. We also show the acceleration a = d2 s JM /dt 2 in Figure 9c, which manifests two positive peaks of accelerations. The first positive peak (at moment B) is caused by the propulsion in the first stage. The kinematic energy of the JM is a portion of the surface energy released from bubble coalescence, i.e. m JM a 1 × s 1 = ε × 4πσ (2R i 2 – R coa 2), where R i is the initial bubble radius, R coa is the bubble radius after coalescence and ε is the energy transfer efficiency. Our calculation shows that a 1 = 27451 m2 s−1 and ε is approximately 0.03, since part of the surface energy is transferred to the surrounding liquid flow and lost by viscous dissipation. During the later period (C to D) in stage 1, the surface wave of bubble deformation needs approximately τ/4 (τ = 4.1 µs here) to propagate from the two side apexes to the contact point with the JM.
The second displacement s 2 of the JM is caused by bubble detachment, which is a process of momentum conservation. The tendency of s 2 in Figure 9b can be approximately modelled using the ordinary differential equation describing the force balance,
 \begin{equation}m_{JM}\ddot{s}_{2}=-f_{d\_ JM},\end{equation}
where m
JM
is the mass of the JM and f
d_JM
= $6{\unicode[Arial]{x03C0}}$
µ
$6{\unicode[Arial]{x03C0}}$
µ $R_{JM}\dot{s}_{JM}$
(Soto et al. Reference Soto, Maddalena, Fraters, van der Meer and Lohse2018) is the drag force exerted on the JM. Equation (4.2) can be solved by using proper initial conditions from the experimental results, i.e. s
2(t = 0) = 2.7 µm,
$R_{JM}\dot{s}_{JM}$
(Soto et al. Reference Soto, Maddalena, Fraters, van der Meer and Lohse2018) is the drag force exerted on the JM. Equation (4.2) can be solved by using proper initial conditions from the experimental results, i.e. s
2(t = 0) = 2.7 µm, $\dot{s}_{2}(t=0)=$
0.6 m s−1. The measured displacements are compared with the solution of (4.2) in Figure 9b. We find that (4.2) is only effective within t< 20 µs after detachment and, after that, the experimental propulsion is lower than the theoretical prediction. This deviation is not surprising, since the unsteady flows near the JM and bubble are not accounted for in (4.2). Although we have not measured the flow field to determine the effect, the deviation is potentially attributed to the additional drag force caused by the bubble–fluid interaction. The acceleration a
2 at the beginning of stage 2 is even greater than a
1, and we find that a
2 = 67432 m2 s−1; this result reflects a stronger bubble–JM interaction during bubble detachment, which involves the effect of surface wave propagation. This bubble–JM interaction exerts a transient force of 4.34 × 10⁻⁶ N on the JM. After the detachment of the bubble at t = −6.7 µs, a negative peak of the acceleration of a
2 = −56315 m2 s−1 appears, which is caused by the liquid drag force.
$\dot{s}_{2}(t=0)=$
0.6 m s−1. The measured displacements are compared with the solution of (4.2) in Figure 9b. We find that (4.2) is only effective within t< 20 µs after detachment and, after that, the experimental propulsion is lower than the theoretical prediction. This deviation is not surprising, since the unsteady flows near the JM and bubble are not accounted for in (4.2). Although we have not measured the flow field to determine the effect, the deviation is potentially attributed to the additional drag force caused by the bubble–fluid interaction. The acceleration a
2 at the beginning of stage 2 is even greater than a
1, and we find that a
2 = 67432 m2 s−1; this result reflects a stronger bubble–JM interaction during bubble detachment, which involves the effect of surface wave propagation. This bubble–JM interaction exerts a transient force of 4.34 × 10⁻⁶ N on the JM. After the detachment of the bubble at t = −6.7 µs, a negative peak of the acceleration of a
2 = −56315 m2 s−1 appears, which is caused by the liquid drag force.
5. Conclusions
In summary, we investigated the coalescence of microbubbles using a double-bubble-powered micromotor based on a Pt-SiO2 Janus microsphere and investigated how bubble motion influences the propulsion of the micromotor. We found that the universal scaling law based on (3.8) could effectively describe all experimental data for a wide range of Ohnesorge numbers Oh = 0.01–1.35, by varying the liquid viscosity, bubble size and surface tension. This dimensionless scaling law indicates a cross-over from an inertially limited viscous regime manifesting linear scaling when $\tilde{t}$
< 1 to a 1/2 scaling of the inertial regime located at
$\tilde{t}$
< 1 to a 1/2 scaling of the inertial regime located at $\tilde{t}$
= 1–1000. For comparison, previous scaling
$\tilde{t}$
= 1–1000. For comparison, previous scaling $\frac{R_{n}}{R_{b}}=B\sqrt{\frac{t}{{\unicode[Arial]{x03C4}} }}$
from (3.2) was applied for the bubble coalescence process to capture the inertial behaviour of the neck growth. By monitoring the evolution of the curvature radius R
c
of the outer profile, we proposed that the transition of R
c
from a smooth increase to a sharp increase could effectively separate the neck coalescence and further deformation processes. Interestingly, this transition approximately occurred at R
c
= R
n
. In addition, we discussed the asymmetric neck growth due to boundary confinement from the JM, which is a prominent phenomenon in the application of bubble-propelled micromotors. We observed an approximate 1/3 behaviour of the neck evolution on the near side. The deviation from this 1/3 behaviour at a later stage reflects the effect of the surface tension from the far side, which is more significant when the viscosity is lower.
$\frac{R_{n}}{R_{b}}=B\sqrt{\frac{t}{{\unicode[Arial]{x03C4}} }}$
from (3.2) was applied for the bubble coalescence process to capture the inertial behaviour of the neck growth. By monitoring the evolution of the curvature radius R
c
of the outer profile, we proposed that the transition of R
c
from a smooth increase to a sharp increase could effectively separate the neck coalescence and further deformation processes. Interestingly, this transition approximately occurred at R
c
= R
n
. In addition, we discussed the asymmetric neck growth due to boundary confinement from the JM, which is a prominent phenomenon in the application of bubble-propelled micromotors. We observed an approximate 1/3 behaviour of the neck evolution on the near side. The deviation from this 1/3 behaviour at a later stage reflects the effect of the surface tension from the far side, which is more significant when the viscosity is lower.
The double-bubble-powered micromotor can harness energy from the bubble coalescence process and achieve propulsion from the bubble–liquid interaction. We found that the JM’s propulsion can be divided into two stages: in the first stage, the counteraction from the liquid due to bubble deformation results in a forward motion of the JM–bubble dimer; in the second stage, the JM is further propelled by momentum transfer during bubble detachment, whose displacement can be approximately modelled by a kinematic equation. We also highlight the high average propulsion speed of the JM during these two stages, which is approximately 0.25 m s−1. The results from this study provide physical insights into the design of fast and efficient bubble-powered microrockets.
Supplementary material
To view supplementary material for this article, please visit https://doi.org/10.1017/flo.2025.11.
Acknowledgments
We thank the Nanofab Lab of National Centre for Nanoscience and Technology for depositing the Pt layers.
Data availability
The data of this study are available from the corresponding author upon reasonable request.
Author contributions
Le.W. and F.Y. contributed equally to this work. Conceptualisation, Le.W; X.Z.; F.Y.; Li.W.; L.C.; D.G.; H.C.; M.H. Methodology, Le.W.; X.Z.; Li.W. Data curation, Le.W.; F.Y.; Li.W. Data visualisation, Le.W.; F.Y.; Li.W. Writing original draft, Le.W.; F.Y.; X.Z. Funding acquisition, X.Z.; F.Y.; H.C.; D.G.; L.W. All authors approved the final submitted draft.
Funding
The authors acknowledge the financial support from the National Key R&D Program of China (2022YFF0503504), the Strategic Priority Research Program of Chinese Academy of Sciences (Grant no. XDB0620102, XDA0470203), National Natural Science Foundation of China (Grant Nos. 12302357, 12472273, 11972351 and 12472273), the International Collaboration Program of Chinese Academy of Sciences (Grant No. 025GJHZ2023016MI), the China Postdoctoral Science Foundation (287749), Key Research and Development Program of Shaanxi Province (2021ZDLSF05-04), Zhongke Technology Achievement Transfer and Transformation Centre of Henan Province (2024151), and Natural Science Basic Research Plan in Shaanxi Province (2020JM-479).
Competing interests
The authors have no conflicts to disclose.
Ethical standards
The research meets all ethical guidelines, including adherence to the legal requirements of the study country.


 Open access