1. Introduction
Dhas & Roy (Reference Dhas and Roy2022) (Reference Dhas and RoyDR) recently presented a stability analysis for flow of a Brownian suspension down an inclined plane, as illustrated by figure 1(a). The flow is considered in the shallow limit, with the flow length  $l$ and film depth $h_0$ satisfying $h_0/l \ll 1$, allowing the simplifications of lubrication and boundary layer analyses. Here, $h_0$ is the uniform base state thickness seen in figure 1(b). The work by Reference Dhas and RoyDR predicts not only destabilizing effects of the particles to the classical (Benjamin Reference Benjamin1957; Yih Reference Yih1963) inertial instabilities of a film, but also a previously unknown instability at vanishing inertia.
An issue that features prominently in the work of Reference Dhas and RoyDR is shear-induced particle migration, which has long been a theme in suspension studies (Leighton & Acrivos Reference Leighton and Acrivos1987), and is associated with the normal stresses attributable to the particle phase (Morris & Boulay Reference Morris and Boulay1999). Due to variation in particle volume fraction $\phi$ caused by migration, the base state for the stability analysis is altered from the half-parabola velocity profile of the pure liquid. Migration in the analogous pressure-driven channel flow has been studied for Brownian suspensions (Frank et al. Reference Frank, Anderson, Weeks and Morris2003), and its effects are more pronounced for larger Péclet number, $Pe_p = \dot {\gamma } a^2/D_0$, with $D_0 = kT/6{\rm \pi} \mu _f a$ being the Stokes–Einstein–Sutherland diffusivity of a particle of radius $a$ in a liquid of viscosity $\mu _f$ with shear rate $\dot {\gamma }$. Analysis of suspension film stability involves a large parameter space, and this makes for a daunting problem. Specifically, the film Reynolds number $Re = \rho h_0 u_0/\mu _f$ (here $u_0$ is the mean axial velocity of the film) along with $\phi$ and $Pe_p$ are, at a minimum, necessary for the fully developed base state, while $a/h_0$ affects the rate of development of this state.
One touchstone for this study in prior analysis is the stability of a flowing film on a heated substrate (Goussis & Kelly Reference Goussis and Kelly1985). The base flow studied by Reference Dhas and RoyDR resembles this flow as both exhibit a viscosity stratification, with a lower viscosity near the plane wall. For the suspension, this is a result of migration towards the free surface and viscosity dependence on $\phi$ of the typical form $\mu (\phi ) = \mu _f (1-\phi /\phi _m)^{-2}$, with maximum packing fraction $\phi _m$. For the Brownian suspensions at $Pe_p \le 10$ described here, relatively modest variations in $\phi$ are seen, as indicated by figure 1(b) at $Pe_p = 1$, yet the variation has major implications for film stability. This suggests that the influence on non-colloidal suspensions, where $Pe_p \rightarrow \infty$ and migration is stronger, will be more pronounced.
2. Overview
2.1. Migration, base flow and surface corrugation
A distinguishing feature of the suspension film is that the axially invariant base state requires a significant length to allow migration towards the free surface to develop. An important basic result of Reference Dhas and RoyDR is that while details may vary, the primary consequences of migration are unaffected by the specific model chosen. The authors have implemented Brownian versions of the diffusive flux model (Khoshnood & Jalali Reference Khoshnood and Jalali2012) and the suspension balance model, in which particle flux is driven by the particle stress $\boldsymbol {\varSigma }^P$ as $\boldsymbol {J}\sim \boldsymbol {\nabla }\boldsymbol {\cdot } \boldsymbol {\varSigma }^P$ (Frank et al. Reference Frank, Anderson, Weeks and Morris2003). Full development of the flow is achieved when the particle flux normal to the inclined plane vanishes, $J_y =0$.
Figure 1(b) shows predictions from Reference Dhas and RoyDR at $Pe_p =1$ and an initially uniform concentration $\phi _0= 0.3$. As the flow proceeds axially, the film thins while $\phi$ increases near the free surface, in agreement with experiments at higher $Pe_p$ (Timberlake & Morris Reference Timberlake and Morris2005). The film thins because the near-wall viscosity becomes smaller than in the uniform-$\phi$ film. At larger $\phi _0$, the normal stresses driving migration increase, and the development length decreases. By contrast, the extent of migration and hence the development length both increase with $Pe_p$; this is simply understood by noting that when $Pe_p \rightarrow 0$, there is no migration because Brownian motion maintains a uniform $\phi$.
Surface corrugations are seen in film flows of suspensions. As shown by figure 2, features large relative to the particle size, and with broad wavenumber content, were found by Timberlake & Morris (Reference Timberlake and Morris2005). A postulate of Reference Dhas and RoyDR is that these corrugations represent the nonlinear saturation of waves predicted by the current linear stability analysis. These structures found at $Re< 0.01$ may stem from the non-inertial instability of § 2.3.
2.2. Stability analysis and modulation of the inertial instability
The coupled equations and associated boundary conditions describing the flow and particle conservation accounting for migration are analysed for the fully developed film. The linear stability analysis follows a standard approach: the variables are expressed as $X = X_b +\hat {X} \exp ({{\rm i}k(x - ct)})$, with $X_b$ the base flow value and $\hat {X}$ the infinitesimal magnitude of the perturbation. The equations are then linearized with respect to the perturbation to yield a set of modified Orr–Sommerfeld equations. These are similar to forms found in other viscosity-stratified free-surface flows (Goussis & Kelly Reference Goussis and Kelly1985), but this set is unique owing to normal stress and particle flux terms specific to suspensions. Detailed guidance to the dominant destabilizing effects is provided by Reference Dhas and RoyDR.
The addition of particles increases the suspension viscosity and thus an increase in the threshold $Re$, based on the pure fluid viscosity, for instability is seen with increasing $\phi$. This is seen in figures 3(a) and 3(b), where we see the neutral stability curves for the long-wave (surface, low-$Re$) and the short-wave (shear, higher-$Re$) modes, respectively; dotted black arrows show the increase in $Re$ for the low-$Pe_p$, and hence relatively uniform-$\phi$, state for both instabilities. The red arrows show the change in the neutral stability conditions with a change from $Pe_p =0.1$ to $Pe_p = 1$, where the base state is significantly more inhomogeneous due to shear-induced migration (see figure 1b). We see that very long-wave disturbances are predicted to grow at $Re<1$. As the authors note, this implies that the surface mode is destabilized at $Re$ below the value needed for instability of the pure liquid. This is a striking and exciting result, as it presages a zero-inertia instability seen in the long-wave surface mode. The shear mode is predicted to occur at much larger $Re$.
The basis for destabilization was explored through systematic removal of terms in the governing Orr–Sommerfeld equations, as elaborated by Reference Dhas and RoyDR in discussion of their figure 13 and table 3. The authors find that the dominant destabilizing effect, which causes the large majority of the shift associated with each red arrow in figure 3, results from a coupling of the $y$-directed variation of base-state volume fraction and velocity profiles to the perturbation in $\phi$. Base-state stratification is thus the source of the dominant destabilizing effect due to the particles, and this stratification is more pronounced as $Pe_p$ increases.
3. Summary and perspective
The free-surface suspension, flow stability analysis of Reference Dhas and RoyDR sheds light in a number of directions. At a practical level, the set of instabilities explored by Reference Dhas and RoyDR may play roles in flows of coatings, crystallizing magma and mud. The alteration of the low-$Re$ surface mode, and appearance of a zero-$Re$ surface instability, are predictions that warrant experimental study. In a broader context, the work of Reference Dhas and RoyDR serves as a foundation for a more general exploration of instability of suspension flows, providing guidance to various issues that will need to be considered in other flows.
In the instabilities described by Reference Dhas and RoyDR for the film, a central role is played by particle migration towards the free surface. This induces a continuous viscosity stratification, with increase towards the free surface in the neutrally buoyant case studied here. Establishing this coupling of migration, a basic rheophysical behaviour in suspensions, to the flow stability is a very satisfying finding. In their consideration of film flow, the authors have pointed to the importance of the critical layer, where the flow speed matches the wave speed. The finding of a lower bound on $Pe_p$ to see the zero-inertia instability is presumably based on a need for sufficient stratification due to migration; the influence of varying viscosity at the critical layer seems to be a key physical issue (Craik Reference Craik1969). The film flow was studied by Reference Dhas and RoyDR for a neutrally buoyant suspension with stratification solely due to migration, but immediately suggests study of the more general case of particles which rise or settle. These cases could exhibit a wide range of $\phi$ profiles in a non-colloidal ($Pe_p\rightarrow \infty$) suspension, and this may facilitate experimental study of the role of stratification. In their work, Reference Dhas and RoyDR chose not to consider larger $\phi$ in order to avoid a jammed condition at the interface, but the implications of such a ‘frozen’ layer seem intriguing. Further issues of interest include the role of finite-amplitude perturbations, including the natural fluctuations of $\phi$, and – as suggested by Reference Dhas and RoyDR – the nonlinear development of the linearly unstable modes.
Flows which yield to stability analysis often offer significant new understanding. While the pioneering examination of stability by Reference Dhas and RoyDR considered a shallow suspension film, the work opens the way to deep insight.


1. Introduction
Dhas & Roy (Reference Dhas and Roy2022) (Reference Dhas and RoyDR) recently presented a stability analysis for flow of a Brownian suspension down an inclined plane, as illustrated by figure 1(a). The flow is considered in the shallow limit, with the flow length $l$ and film depth $h_0$ satisfying $h_0/l \ll 1$, allowing the simplifications of lubrication and boundary layer analyses. Here, $h_0$ is the uniform base state thickness seen in figure 1(b). The work by Reference Dhas and RoyDR predicts not only destabilizing effects of the particles to the classical (Benjamin Reference Benjamin1957; Yih Reference Yih1963) inertial instabilities of a film, but also a previously unknown instability at vanishing inertia.
(a) A particle-laden film and (b) the predicted development of the height and $\phi$ profile for $\phi _0 = 0.3$ at $Pe_p = 1$, from a uniformly concentrated film at $x=0$. The axial coordinate $x$ is scaled by $h_i$, and the final thickness in (b) is the base-state $h_0$. From Dhas & Roy (Reference Dhas and Roy2022).
An issue that features prominently in the work of Reference Dhas and RoyDR is shear-induced particle migration, which has long been a theme in suspension studies (Leighton & Acrivos Reference Leighton and Acrivos1987), and is associated with the normal stresses attributable to the particle phase (Morris & Boulay Reference Morris and Boulay1999). Due to variation in particle volume fraction $\phi$ caused by migration, the base state for the stability analysis is altered from the half-parabola velocity profile of the pure liquid. Migration in the analogous pressure-driven channel flow has been studied for Brownian suspensions (Frank et al. Reference Frank, Anderson, Weeks and Morris2003), and its effects are more pronounced for larger Péclet number, $Pe_p = \dot {\gamma } a^2/D_0$, with $D_0 = kT/6{\rm \pi} \mu _f a$ being the Stokes–Einstein–Sutherland diffusivity of a particle of radius $a$ in a liquid of viscosity $\mu _f$ with shear rate $\dot {\gamma }$. Analysis of suspension film stability involves a large parameter space, and this makes for a daunting problem. Specifically, the film Reynolds number $Re = \rho h_0 u_0/\mu _f$ (here $u_0$ is the mean axial velocity of the film) along with $\phi$ and $Pe_p$ are, at a minimum, necessary for the fully developed base state, while $a/h_0$ affects the rate of development of this state.
One touchstone for this study in prior analysis is the stability of a flowing film on a heated substrate (Goussis & Kelly Reference Goussis and Kelly1985). The base flow studied by Reference Dhas and RoyDR resembles this flow as both exhibit a viscosity stratification, with a lower viscosity near the plane wall. For the suspension, this is a result of migration towards the free surface and viscosity dependence on $\phi$ of the typical form $\mu (\phi ) = \mu _f (1-\phi /\phi _m)^{-2}$, with maximum packing fraction $\phi _m$. For the Brownian suspensions at $Pe_p \le 10$ described here, relatively modest variations in $\phi$ are seen, as indicated by figure 1(b) at $Pe_p = 1$, yet the variation has major implications for film stability. This suggests that the influence on non-colloidal suspensions, where $Pe_p \rightarrow \infty$ and migration is stronger, will be more pronounced.
2. Overview
2.1. Migration, base flow and surface corrugation
A distinguishing feature of the suspension film is that the axially invariant base state requires a significant length to allow migration towards the free surface to develop. An important basic result of Reference Dhas and RoyDR is that while details may vary, the primary consequences of migration are unaffected by the specific model chosen. The authors have implemented Brownian versions of the diffusive flux model (Khoshnood & Jalali Reference Khoshnood and Jalali2012) and the suspension balance model, in which particle flux is driven by the particle stress $\boldsymbol {\varSigma }^P$ as $\boldsymbol {J}\sim \boldsymbol {\nabla }\boldsymbol {\cdot } \boldsymbol {\varSigma }^P$ (Frank et al. Reference Frank, Anderson, Weeks and Morris2003). Full development of the flow is achieved when the particle flux normal to the inclined plane vanishes, $J_y =0$.
Figure 1(b) shows predictions from Reference Dhas and RoyDR at $Pe_p =1$ and an initially uniform concentration $\phi _0= 0.3$. As the flow proceeds axially, the film thins while $\phi$ increases near the free surface, in agreement with experiments at higher $Pe_p$ (Timberlake & Morris Reference Timberlake and Morris2005). The film thins because the near-wall viscosity becomes smaller than in the uniform- $\phi$ film. At larger $\phi _0$, the normal stresses driving migration increase, and the development length decreases. By contrast, the extent of migration and hence the development length both increase with $Pe_p$; this is simply understood by noting that when $Pe_p \rightarrow 0$, there is no migration because Brownian motion maintains a uniform $\phi$.
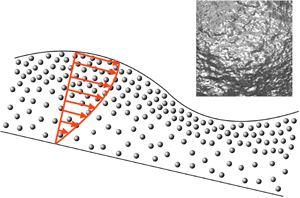
Surface corrugations are seen in film flows of suspensions. As shown by figure 2, features large relative to the particle size, and with broad wavenumber content, were found by Timberlake & Morris (Reference Timberlake and Morris2005). A postulate of Reference Dhas and RoyDR is that these corrugations represent the nonlinear saturation of waves predicted by the current linear stability analysis. These structures found at $Re< 0.01$ may stem from the non-inertial instability of § 2.3.
Surface corrugations in a film of $h_0= 2.1$ mm, of neutrally buoyant $180\ \mathrm {\mu }{\rm m}$ diameter spheres at uniform $\phi _0 = 0.3$ on a plane inclined at $\alpha = 34.6^\circ$ from horizontal. Lighting and camera orientation are shown at left, with flow from top to bottom (at $Re < 0.01$) of the imaged region, which is 3 cm tall and 2.4 cm wide. Adapted from Timberlake & Morris (Reference Timberlake and Morris2005).
2.2. Stability analysis and modulation of the inertial instability
The coupled equations and associated boundary conditions describing the flow and particle conservation accounting for migration are analysed for the fully developed film. The linear stability analysis follows a standard approach: the variables are expressed as $X = X_b +\hat {X} \exp ({{\rm i}k(x - ct)})$, with $X_b$ the base flow value and $\hat {X}$ the infinitesimal magnitude of the perturbation. The equations are then linearized with respect to the perturbation to yield a set of modified Orr–Sommerfeld equations. These are similar to forms found in other viscosity-stratified free-surface flows (Goussis & Kelly Reference Goussis and Kelly1985), but this set is unique owing to normal stress and particle flux terms specific to suspensions. Detailed guidance to the dominant destabilizing effects is provided by Reference Dhas and RoyDR.
The addition of particles increases the suspension viscosity and thus an increase in the threshold $Re$, based on the pure fluid viscosity, for instability is seen with increasing $\phi$. This is seen in figures 3(a) and 3(b), where we see the neutral stability curves for the long-wave (surface, low- $Re$) and the short-wave (shear, higher- $Re$) modes, respectively; dotted black arrows show the increase in $Re$ for the low- $Pe_p$, and hence relatively uniform- $\phi$, state for both instabilities. The red arrows show the change in the neutral stability conditions with a change from $Pe_p =0.1$ to $Pe_p = 1$, where the base state is significantly more inhomogeneous due to shear-induced migration (see figure 1b). We see that very long-wave disturbances are predicted to grow at $Re<1$. As the authors note, this implies that the surface mode is destabilized at $Re$ below the value needed for instability of the pure liquid. This is a striking and exciting result, as it presages a zero-inertia instability seen in the long-wave surface mode. The shear mode is predicted to occur at much larger $Re$.
$Re$.
Neutral stability curves for the surface (a) and shear (b) modes for $\phi _0 = 0.1$ (black curves) and $\phi _0 = 0.3$ (blue curves) at $Pe_p = 0.1$ (dashed curves) and $Pe_p =1$ (solid curves). Dotted black arrows highlight the change with increasing $\phi$; solid red arrows show the change due to increase of $Pe_p$ and stronger stratification. Adapted from Dhas & Roy (Reference Dhas and Roy2022).
The basis for destabilization was explored through systematic removal of terms in the governing Orr–Sommerfeld equations, as elaborated by Reference Dhas and RoyDR in discussion of their figure 13 and table 3. The authors find that the dominant destabilizing effect, which causes the large majority of the shift associated with each red arrow in figure 3, results from a coupling of the $y$-directed variation of base-state volume fraction and velocity profiles to the perturbation in $\phi$. Base-state stratification is thus the source of the dominant destabilizing effect due to the particles, and this stratification is more pronounced as $Pe_p$ increases.
2.3. Inertialess ( $Re =0$) instability
By taking the limit of $Re\rightarrow 0$, Reference Dhas and RoyDR show that there is instability in the absence of inertia. This novel prediction occurs above a critical Péclet number of $Pe_p \approx 0.7$. The maximum growth rate at $Re = 0$ is smaller than at $Re=20$, but the two are comparable above the critical $Pe_p$. Because the particle concentration is the sole destabilizing influence, the envelope of instability is larger – extending to shorter wavelengths – for $\phi _0=0.3$ than for $\phi _0 = 0.1$. A succinct physical explanation for this instability is not immediately clear. The presence of a viscosity gradient at the ‘critical layer’ where the flow speed equals the wave speed, through its effect on the curvature of the base flow profile as developed by Craik (Reference Craik1969), appears to play a central role.
3. Summary and perspective
The free-surface suspension, flow stability analysis of Reference Dhas and RoyDR sheds light in a number of directions. At a practical level, the set of instabilities explored by Reference Dhas and RoyDR may play roles in flows of coatings, crystallizing magma and mud. The alteration of the low- $Re$ surface mode, and appearance of a zero- $Re$ surface instability, are predictions that warrant experimental study. In a broader context, the work of Reference Dhas and RoyDR serves as a foundation for a more general exploration of instability of suspension flows, providing guidance to various issues that will need to be considered in other flows.
In the instabilities described by Reference Dhas and RoyDR for the film, a central role is played by particle migration towards the free surface. This induces a continuous viscosity stratification, with increase towards the free surface in the neutrally buoyant case studied here. Establishing this coupling of migration, a basic rheophysical behaviour in suspensions, to the flow stability is a very satisfying finding. In their consideration of film flow, the authors have pointed to the importance of the critical layer, where the flow speed matches the wave speed. The finding of a lower bound on $Pe_p$ to see the zero-inertia instability is presumably based on a need for sufficient stratification due to migration; the influence of varying viscosity at the critical layer seems to be a key physical issue (Craik Reference Craik1969). The film flow was studied by Reference Dhas and RoyDR for a neutrally buoyant suspension with stratification solely due to migration, but immediately suggests study of the more general case of particles which rise or settle. These cases could exhibit a wide range of $\phi$ profiles in a non-colloidal ( $Pe_p\rightarrow \infty$) suspension, and this may facilitate experimental study of the role of stratification. In their work, Reference Dhas and RoyDR chose not to consider larger $\phi$ in order to avoid a jammed condition at the interface, but the implications of such a ‘frozen’ layer seem intriguing. Further issues of interest include the role of finite-amplitude perturbations, including the natural fluctuations of $\phi$, and – as suggested by Reference Dhas and RoyDR – the nonlinear development of the linearly unstable modes.
Flows which yield to stability analysis often offer significant new understanding. While the pioneering examination of stability by Reference Dhas and RoyDR considered a shallow suspension film, the work opens the way to deep insight.
Declaration of interest
The author reports no conflict of interest.