





Introduction
As herbicide-resistant weed species are rapidly evolving and spreading (Heap Reference Heap2023), growers, agronomists, and government staff are becoming increasingly concerned about herbicide resistance (Height et al. Reference Height, Graham, Campbell, Hawkes, Schrader, Blessington and McKinnon2022). Growers believe that they are effective and capable of managing weeds on their own properties (Campbell et al. Reference Campbell, Height, Hawkes, Graham, Schrader, Blessington and McKinnon2023), but they are concerned about the spread of herbicide resistance to and from their properties and believe that there are significant benefits to be gained by working together to manage mobile weeds (Schrader et al. Reference Schrader, Graham, Campbell, Height and Hawkes2024). To this end, cropping industries and their growers are considering whether area-wide management, that is, growers coordinating their activities across property boundaries, could provide an effective model for collaborating to reduce the presence and spread of herbicide-resistant weeds (Bagavathiannan et al. Reference Bagavathiannan, Graham, Ma, Barney, Coutts, Caicedo, De Clerck-Floate, West, Blank, Metcalf, Lacoste, Moreno, Evans, Burke and Beckie2019).
For decades, area-wide management has been found to be effective for addressing other pest challenges, such as insect pests (Ayer Reference Ayer1997). For example, in the 1970s, a community program in the United States was designed to collectively scout and coordinate cotton bollworm (Helicoverpa armigera) and tobacco budworm (Chloridea virescens) control effectively and also restricted planting and plow-down dates. Together, these activities reduced larval populations, resulting in reduced insecticide use and increased yields and quality (Ayer Reference Ayer1997). More recently, Queensland fruit fly (Bactrocera tryoni) was successfully suppressed in northern Australia when all growers implemented rigorous baiting and pooled resources to treat citrus plants in town (Kruger Reference Kruger2016). Whereas area-wide management has been found to be effective for insect pests, questions remain about whether it would be effective for management of weed issues. This is because area-wide management is believed to be most beneficial when pests are highly mobile (Ervin and Frisvold Reference Ervin and Frisvold2016). The more mobile the pest, the more interdependent the problem becomes for growers and the greater the benefits for collaborating. Therefore, one of the most fundamental questions that needs to be answered about whether area-wide management projects are likely to deliver significant benefits to growers is: how mobile are herbicide resistant weeds across farm boundaries? This paper aims to answer this question for flaxleaf fleabane [Conyza bonariensis (L.) Cronquist; syn.: Erigeron bonariensis L.], a weed of considerable concern to growers across three cropping regions in Australia (Schrader et al. Reference Schrader, Graham, Campbell, Height and Hawkes2024).
Conyza bonariensis is native to South America but has become invasive in many countries across the world, including Australia. This species has high fecundity, producing very high numbers of seeds (Werth et al. Reference Werth, Thornby and Walker2012). More than 370,000 seeds per plant have been reported, although only around 6% of seeds remain viable after 3 yr (Wu et al. Reference Wu, Walker, Rollin, Tan, Robinson and Werth2007). This species is considered to have high dispersal capacity due to its wind-dispersed (and potentially water-dispersed) seeds (Wu Reference Wu2007). Fleabane is self-compatible, and it had been assumed that outcrossing was rare in this species, but genetic data indicate higher levels of genetic diversity than would be expected from an obligately self-pollinated species (Minati et al. Reference Minati, Preston and Malone2020). This species is allohexaploid, and each subgenome contains three different copies of the glyphosate target-site gene EPSPS. This makes it difficult for this species to evolve glyphosate resistance by target-site mutations, as multiple copies of the gene must independently evolve resistance mutations to confer resistance (Hereward et al. Reference Hereward, Werth, Thornby, Keenan, Chauhan and Walter2018). The evolution of glyphosate resistance through non–target site mechanisms is therefore more likely in this species, although target-site mutations have been reported (Aves Reference Aves2017). Glyphosate resistance was first detected in Queensland in 2006 (Walker et al. Reference Walker, Bell, Robinson and Widderick2011), and a study found that by 2018 all of 61 randomly collected populations of C. bonariensis from the northern New South Wales and Queensland grain-cropping region tested resistant to glyphosate (Broster et al. Reference Broster, Jalaludin, Widderick, Chambers and Walsh2023).
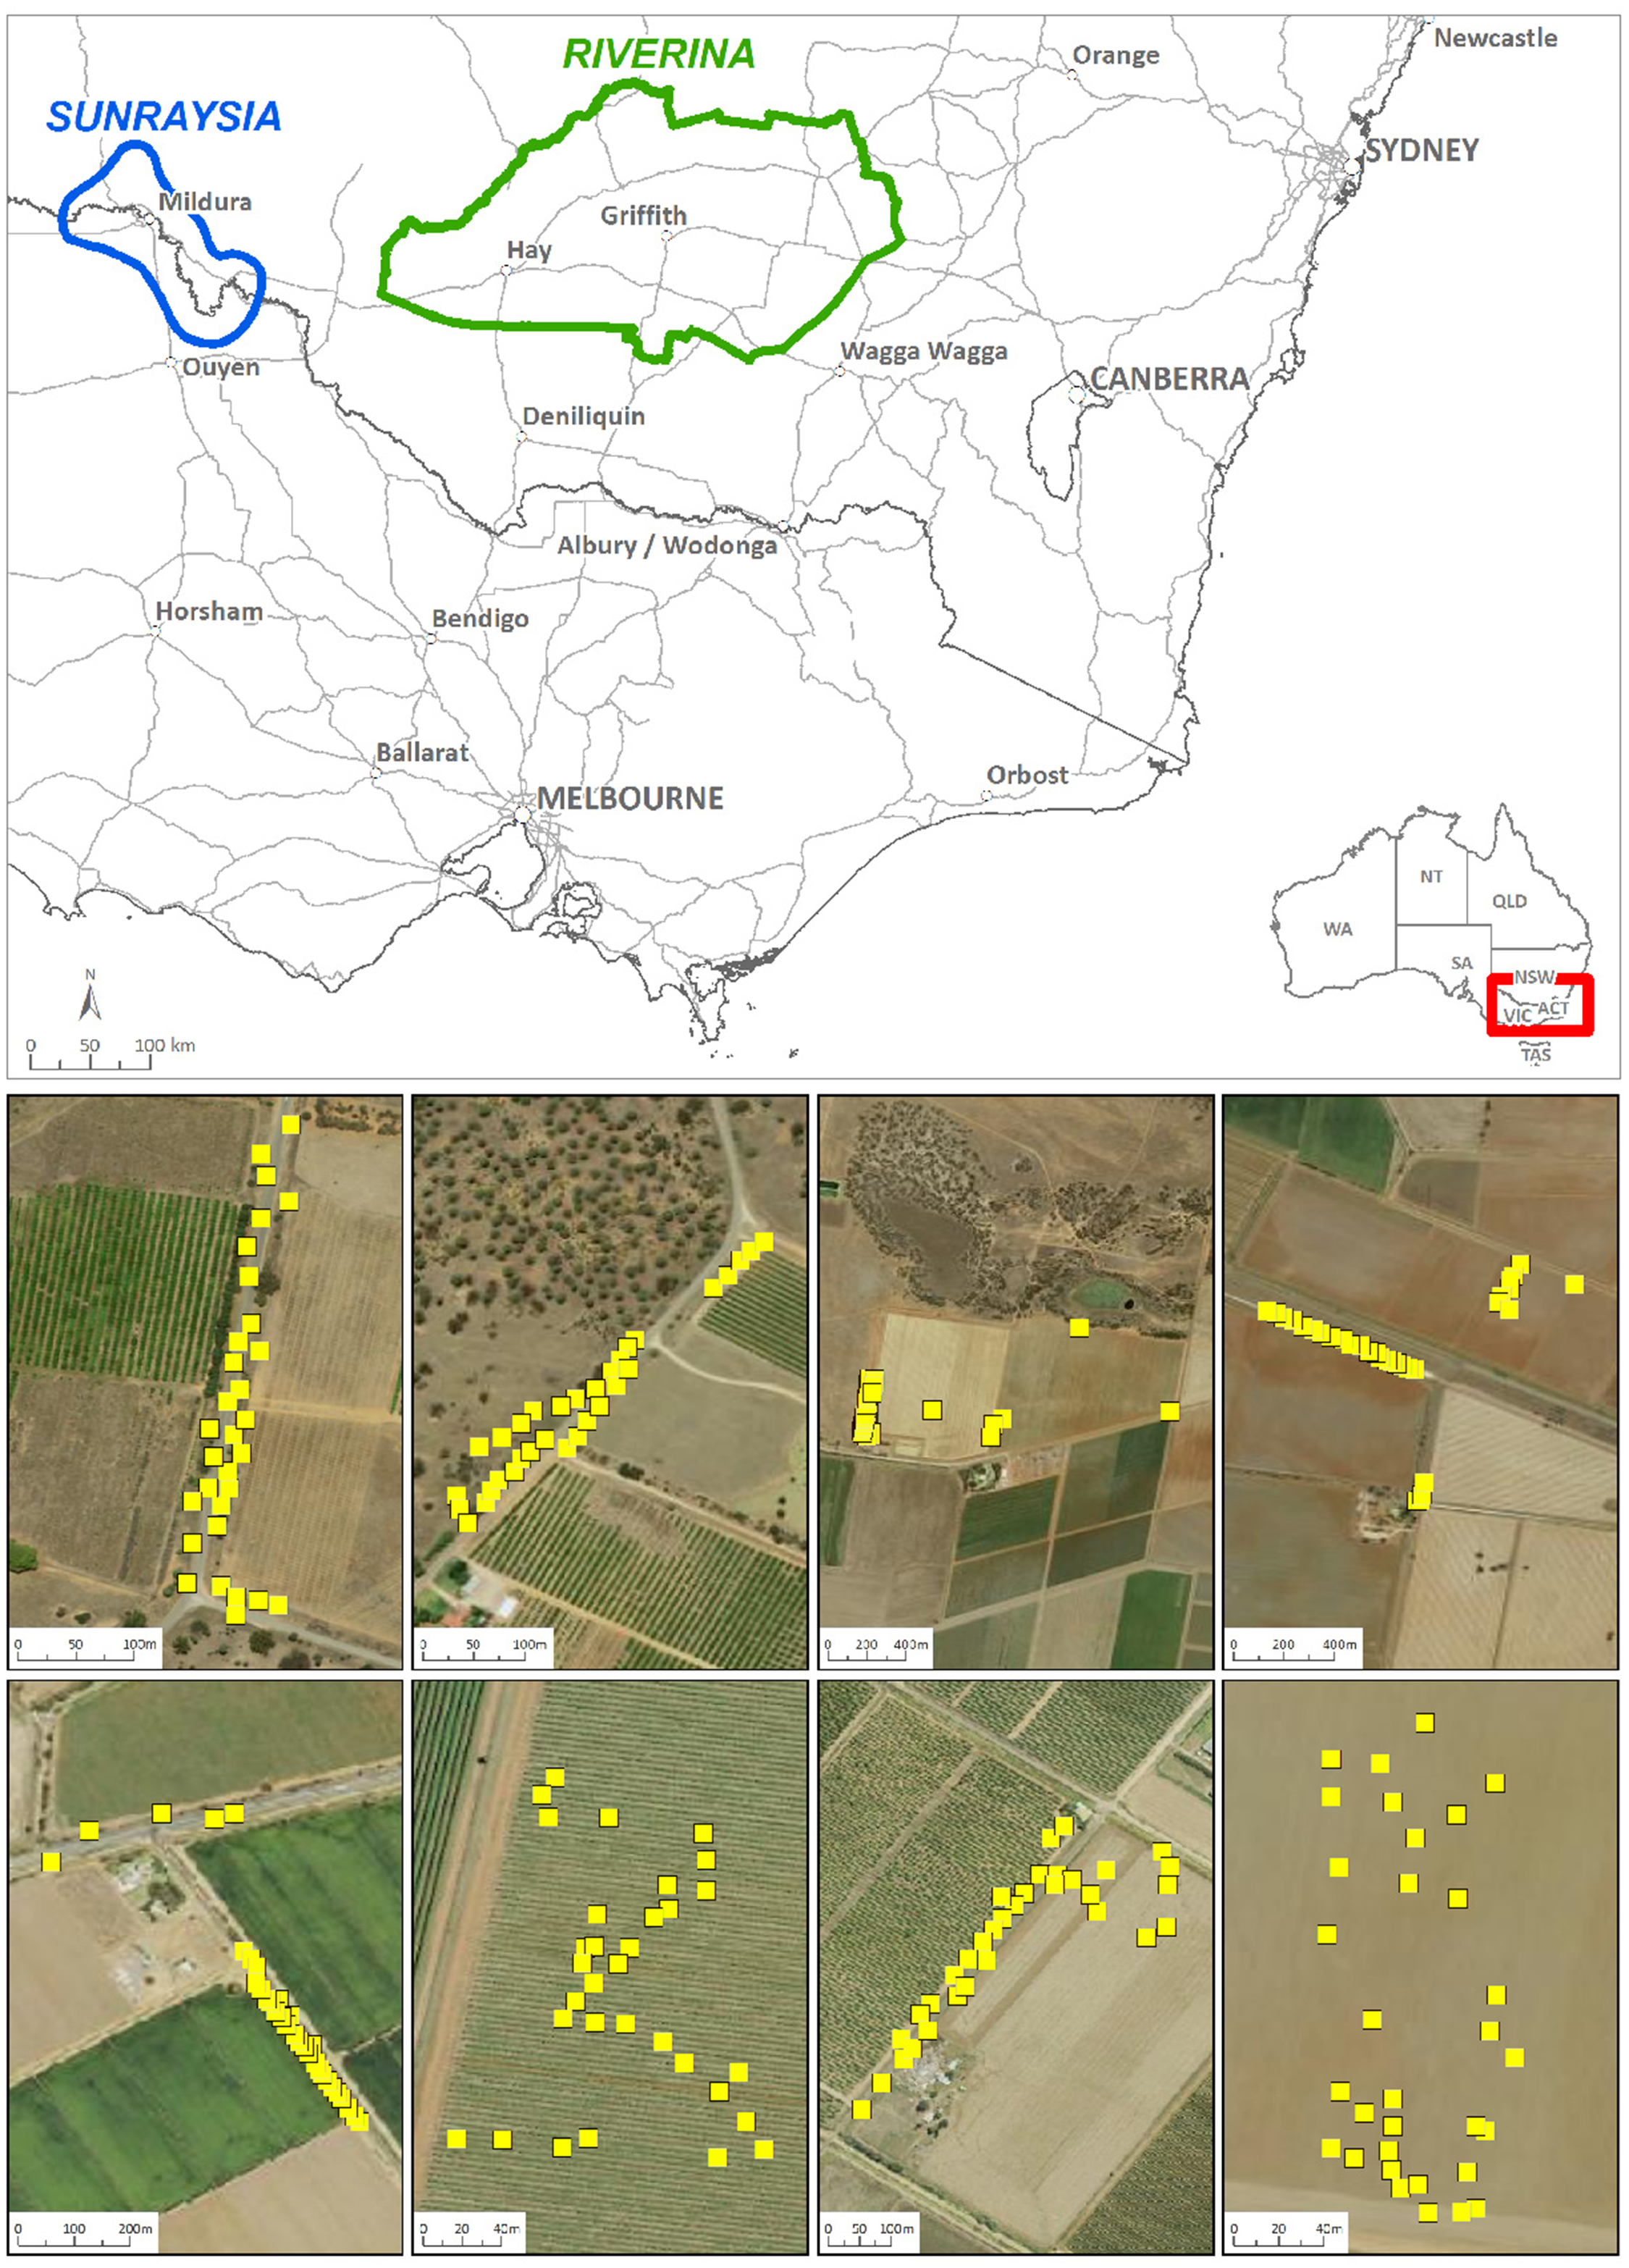
Movement of weed seed and pollen spreads herbicide resistance, but the small size of seed and pollen makes identifying the extent of weed movement challenging using traditional approaches. This study was designed to assess the movement of C. bonariensis across two agricultural regions (the Riverina and Sunraysia regions, Australia; Figure 1) using genetics. We sampled C. bonariensis populations in each region across two seasons, and this design allowed us to assess the extent of gene flow across each region, to compare the genetic relatedness of populations across the two regions and assess dispersal distances using parentage analysis. We also investigated the spatial distribution of glyphosate resistance in these two regions to explore the relationship between movement and the spread of resistance.
Top, map showing the location of the two regions, Riverina and Sunraysia. Bottom, figure illustrating Conyza bonariensis sample collection from farm paddocks and roadsides; yellow squares indicate the location of an individual plant collected for population genetics analysis.
Materials and Methods
Herbicide-Resistance Screening
Seeds of individual C. bonariensis plants were collected across each of the study areas (Riverina and Sunraysia) in the summers of 2019/2020 and 2020/2021. The location of each sample was determined by GPS, and the land use for the location and surrounding land use were recorded. Seeds were sown onto potting mix and watered. The pots were placed in a temperature-controlled glasshouse (minimum: 15 C; maximum: 25 C). Once seedlings had germinated, they were transplanted into potting soil in pots with four plants per pot.
When the seedlings had reached the 6- to 8-leaf rosette stage, they were treated with glyphosate (WeedMaster ARGO, Melbourne, Nufarm, Australia) at 1,080 g ae ha−1 in 109 L ha−1 water by a moving-boom laboratory pesticide applicator (Boutsalis et al. Reference Boutsalis, Gill and Preston2012). This rate had previously been determined to control susceptible C. bonariensis seedlings (Aves et al. Reference Aves, Broster, Weston, Gill and Preston2020). There were three replicate pots for each sample (seeds from a single plant) where sufficient seedlings germinated. Seedlings were assessed for survival at 28 d after glyphosate application, and plants with new green leaves were considered to have survived. Samples where all seedlings were killed by the herbicide application were considered susceptible, and those with survivors were considered resistant to glyphosate. The presence of spatial relationships between resistant and non-resistant samples was analyzed using the ArcGIS spatial autocorrelation function and Moran’s I as a test of local and global clustering.
Sampling for Genetic Analysis
The sampling for genetic analysis was conducted separately from the sampling for resistance screening. Conyza bonariensis samples were collected across the Riverina and Sunraysia regions at both farm and roadside sites in 2020, and the same sites were sampled again in 2021 (Figure 1). Each site within the study area was a location where plants were sampled and less than 2.5 km by 2.5 km in size (see Figure 1 for examples). At each site, 32 individuals were sampled, and leaf material was placed directly into silica gel for DNA preservation. In 2020, only limited samples were available in the Sunraysia region due to extreme drought conditions, and these were collected from four sites (18 to 29 individuals per site). In the Riverina region, samples were collected from 10 sites in each year, and 11 sites were sampled in Sunraysia in 2021. The sites sampled in Sunraysia were different in 2021 compared with 2020, with the exception of site 4, which was the same. Site 1 in 2021 was also quite close to site 1 in 2020.
DNA Extraction
DNA was extracted from all samples using a CTAB buffer and spin column extraction based on the spin column method in Ridley et al. (Reference Ridley, Hereward, Daglish, Raghu, McCulloch and Walter2016). Each sample was ground with stainless steel and silica beads in a Qiagen TissueLyser, Qiagen, Hilden, Germany. Then, 500 µl of 2% CTAB buffer (2% cetyl trimethyl ammonium bromide, 1.4 M NaCl, 20m M EDTA, 100m M Tris-HCl) and 2 µl of proteinase K were added to each sample and incubated overnight at 56 C. The following day, 4 µl of RNAse A was added to each sample followed by 30-min incubation at 37 C. Samples were cooled on ice, and then 500 µl (1X) of chloroform–isoamyl alcohol (24:1) was added. Samples were mixed by rotation for 5 min and then centrifuged at high speed for 5 min. The aqueous phase was carefully moved to a new tube (300 µl), and equal volumes of ethanol and 4 M guanidine HCL was added (300 µl each); then the sample was mixed by rotation for 5 min. The mixture was then added to a silica column (Epoch Life Science, Missouri City, TX, USA) and centrifuged for 1 min at high speed. After the eluate was discarded, 500 µl of wash buffer (10 mM Tris-HCl pH 7.5, 80% ethanol) was added to each column and centrifuged for 1 min. A second wash step was performed with 500 µl of wash buffer after the eluate from the first wash was discarded; this was centrifuged for 1 min, the waste discarded, followed by a further 2 min of centrifugation to dry any residual ethanol from the membrane. Finally, 100 µl of elution buffer (10 mM Tris-Cl, pH 8.5) was added to each silica column and incubated for 5 min followed by 1 min of centrifugation to collect the DNA.
Genotyping by Sequencing
Genome-wide single-nucleotide polymorphism (SNP) data were generated using a genotyping-by-sequencing method. The protocol and adaptor regime are based on the methods of Elshire et al. (Reference Elshire, Glaubitz, Sun, Poland, Kawamoto, Buckler and Mitchell2011), Poland et al. (Reference Poland, Brown, Sorrells and Jannink2012), and Peterson et al. (Reference Peterson, Weber, Kay, Fisher and Hoekstra2012), with barcodes based on Caporaso et al. (Reference Caporaso, Lauber, Walters, Berg-Lyons, Huntley, Fierer, Owens, Betley, Fraser, Bauer, Gormley, Gilbert, Smith and Knight2012); for details, see Hereward et al. (Reference Hereward, Smith, Gloag, Brookes and Walter2025). Samples were double digested with the enzymes MspI and PstI. We then ligated 96 unique forward barcodes, and three different 96-well plates of reverse barcodes to the samples so that every sample had a unique forward and reverse inline barcode combination. Each plate of 96 samples was then pooled and size selected on a Blue Pippin (Sage Science, Beverly, MA, USA) to 300 to 400 bp. Each of these pools was PCR amplified to complete the adaptors and add i7 indices. Full details of the methods can be found online at https://www.jameshereward.org/GBS.html. We pooled 288 individuals per sequencing lane and sequenced the libraries with PE150 Illumina sequencing at Novogene (Beijing, China).
The sequence data were demultiplexed and filtered using STACKS v. 2.62 (Catchen et al. Reference Catchen, Hohenlohe, Bassham, Amores and Cresko2013). The data were then mapped to a reference genome for C. bonariensis (JPH, unpublished data) using the Burrows-Wheeler algorithm (BWA-MEM) in −M mode (Li and Durbin Reference Li and Durbin2009). As C. bonariensis is allohexaploid, the use of the reference genome should allow SNPs from the three subgenomes to be separated by mapping. We used Samtools to sort the mapping files and compress them (Danecek et al. Reference Danecek, Bonfield, Liddle, Marshall, Ohan, Pollard, Whitwham, Keane, McCarthy, Davies and Li2021) and then used STACKS to call SNPs using the reference map pipeline (Catchen et al. Reference Catchen, Hohenlohe, Bassham, Amores and Cresko2013). A VCF file of the genotype data was generated in STACKS. This VCF file was further filtered using vcftools (Danecek et al. Reference Danecek, Auton, Abecasis, Albers, Banks, DePristo, Handsaker, Lunter, Marth, Sherry, McVean and Durbin2011) and the R package snpfiltR (DeRaad Reference DeRaad2022), which uses vcfR (Knaus and Grünwald Reference Knaus and Grünwald2017). Initially, any SNP with a minor allele count below three (one heterozygote and one homozygote) was removed to conservatively remove any singleton SNPs that were likely to be errors without discarding rare alleles (Linck and Battey Reference Linck and Battey2019). We set a minimum depth of 5 and kept only biallelic SNPs and those with a quality score higher than 39. To remove paralogous loci, we removed any markers with a maximum depth greater than 100. We also removed any markers with an allele balance below 0.25 or above 0.75; before this filtering step, we plotted the allele balance to assess how well the process of mapping to the reference separated the three subgenomes The distribution of allele balance was consistent with all SNPs being diploid (one peak at 50%) and therefore supported all three subgenomes having been separated by the assembly and mapping. We then filtered the data for missing data in three steps. First, any marker missing more than 50% data was discarded to remove the markers most affected by missing data. Second, any individual that had missing data at more than 80% of the markers was discarded to remove the individuals that had bad-quality genotyping. Finally, any marker missing more than 10% data was discarded to produce a final dataset with relatively little missing data. To remove physically linked SNP markers (for running structure and the parentage analysis) we thinned the dataset to 1 SNP per 1,000 bp.
Population Genetics and Parentage Analysis
We calculated pairwise and overall FST to measure population differentiation for the 2020 samples and the 2021 samples separately using the Weir and Cockerham method implemented in the R package hierfstat and generated bootstrap values with 10,000 permutations (Goudet Reference Goudet2005; Weir and Cockerham Reference Weir and Cockerham1984). We also calculated the inbreeding coefficient FIS following the method of Nei (Reference Nei1987) as implemented in hierfstat and plotted FIS per population using the gl.report.heterozygosity function of the R package dartR (Gruber et al. Reference Gruber, Unmack, Berry and Georges2018; Mijangos et al. Reference Mijangos, Gruber, Berry, Pacioni and Georges2022).
A principal component analysis (PCA) was conducted using the adegenet package in R (Jombart Reference Jombart2008) to show the genetic distance and clustering of samples across sites. We then assessed gene flow and genetic clustering by performing a STRUCTURE analysis for each species in each region. This program uses a Bayesian algorithm to assign individuals to each of K hypothetical populations based on allele frequencies (Pritchard et al. Reference Pritchard, Stephens and Donnelly2000). Initially, we performed four replicate runs of each value of K hypothetical populations from 1 to 10, and we assessed the most likely value of K using the Evanno method implemented in STRUCTURE harvester (Earl and vonHoldt Reference Earl and vonHoldt2012; Evanno et al. Reference Evanno, Regnaut and Goudet2005). We then performed 10 runs of the program structure using different starting seeds for the most likely value of K, which was three hypothetical populations. We ran STRUCTURE for all the samples together and then separately for the Riverina and Sunraysia regions. The algorithm was run using the admixture model and with 100,000 iterations of burn-in followed by 1,000,000 iterations. We then combined and permuted the 10 runs with CLUMPP (Jakobsson and Rosenberg Reference Jakobsson and Rosenberg2007) and plotted the combined data using distruct (Rosenberg Reference Rosenberg2004), both implemented in Clumpak (Kopelman et al. Reference Kopelman, Mayzel, Jakobsson, Rosenberg and Mayrose2015).
We assessed genotypic diversity and identified multilocus genotypes using the R package poppr (Kamvar et al. Reference Kamvar, Tabima and Grünwald2014). We then clone corrected the overall dataset using poppr to remove individuals with identical genotypes. We used this clone-corrected dataset to assess parents using Colony (Jones and Wang Reference Jones and Wang2010). We conducted parentage analysis independently for each region. We set the 2021 samples as offspring and duplicated the 2020 data with one set designated as the putative fathers and the other as the putative mothers. We used a medium run, used the inbreeding option, and allowed polygamy. We then merged the results for the paternity and maternity, removing any duplicates and any parent–offspring match with less than 0.95 probability.
Results and Discussion
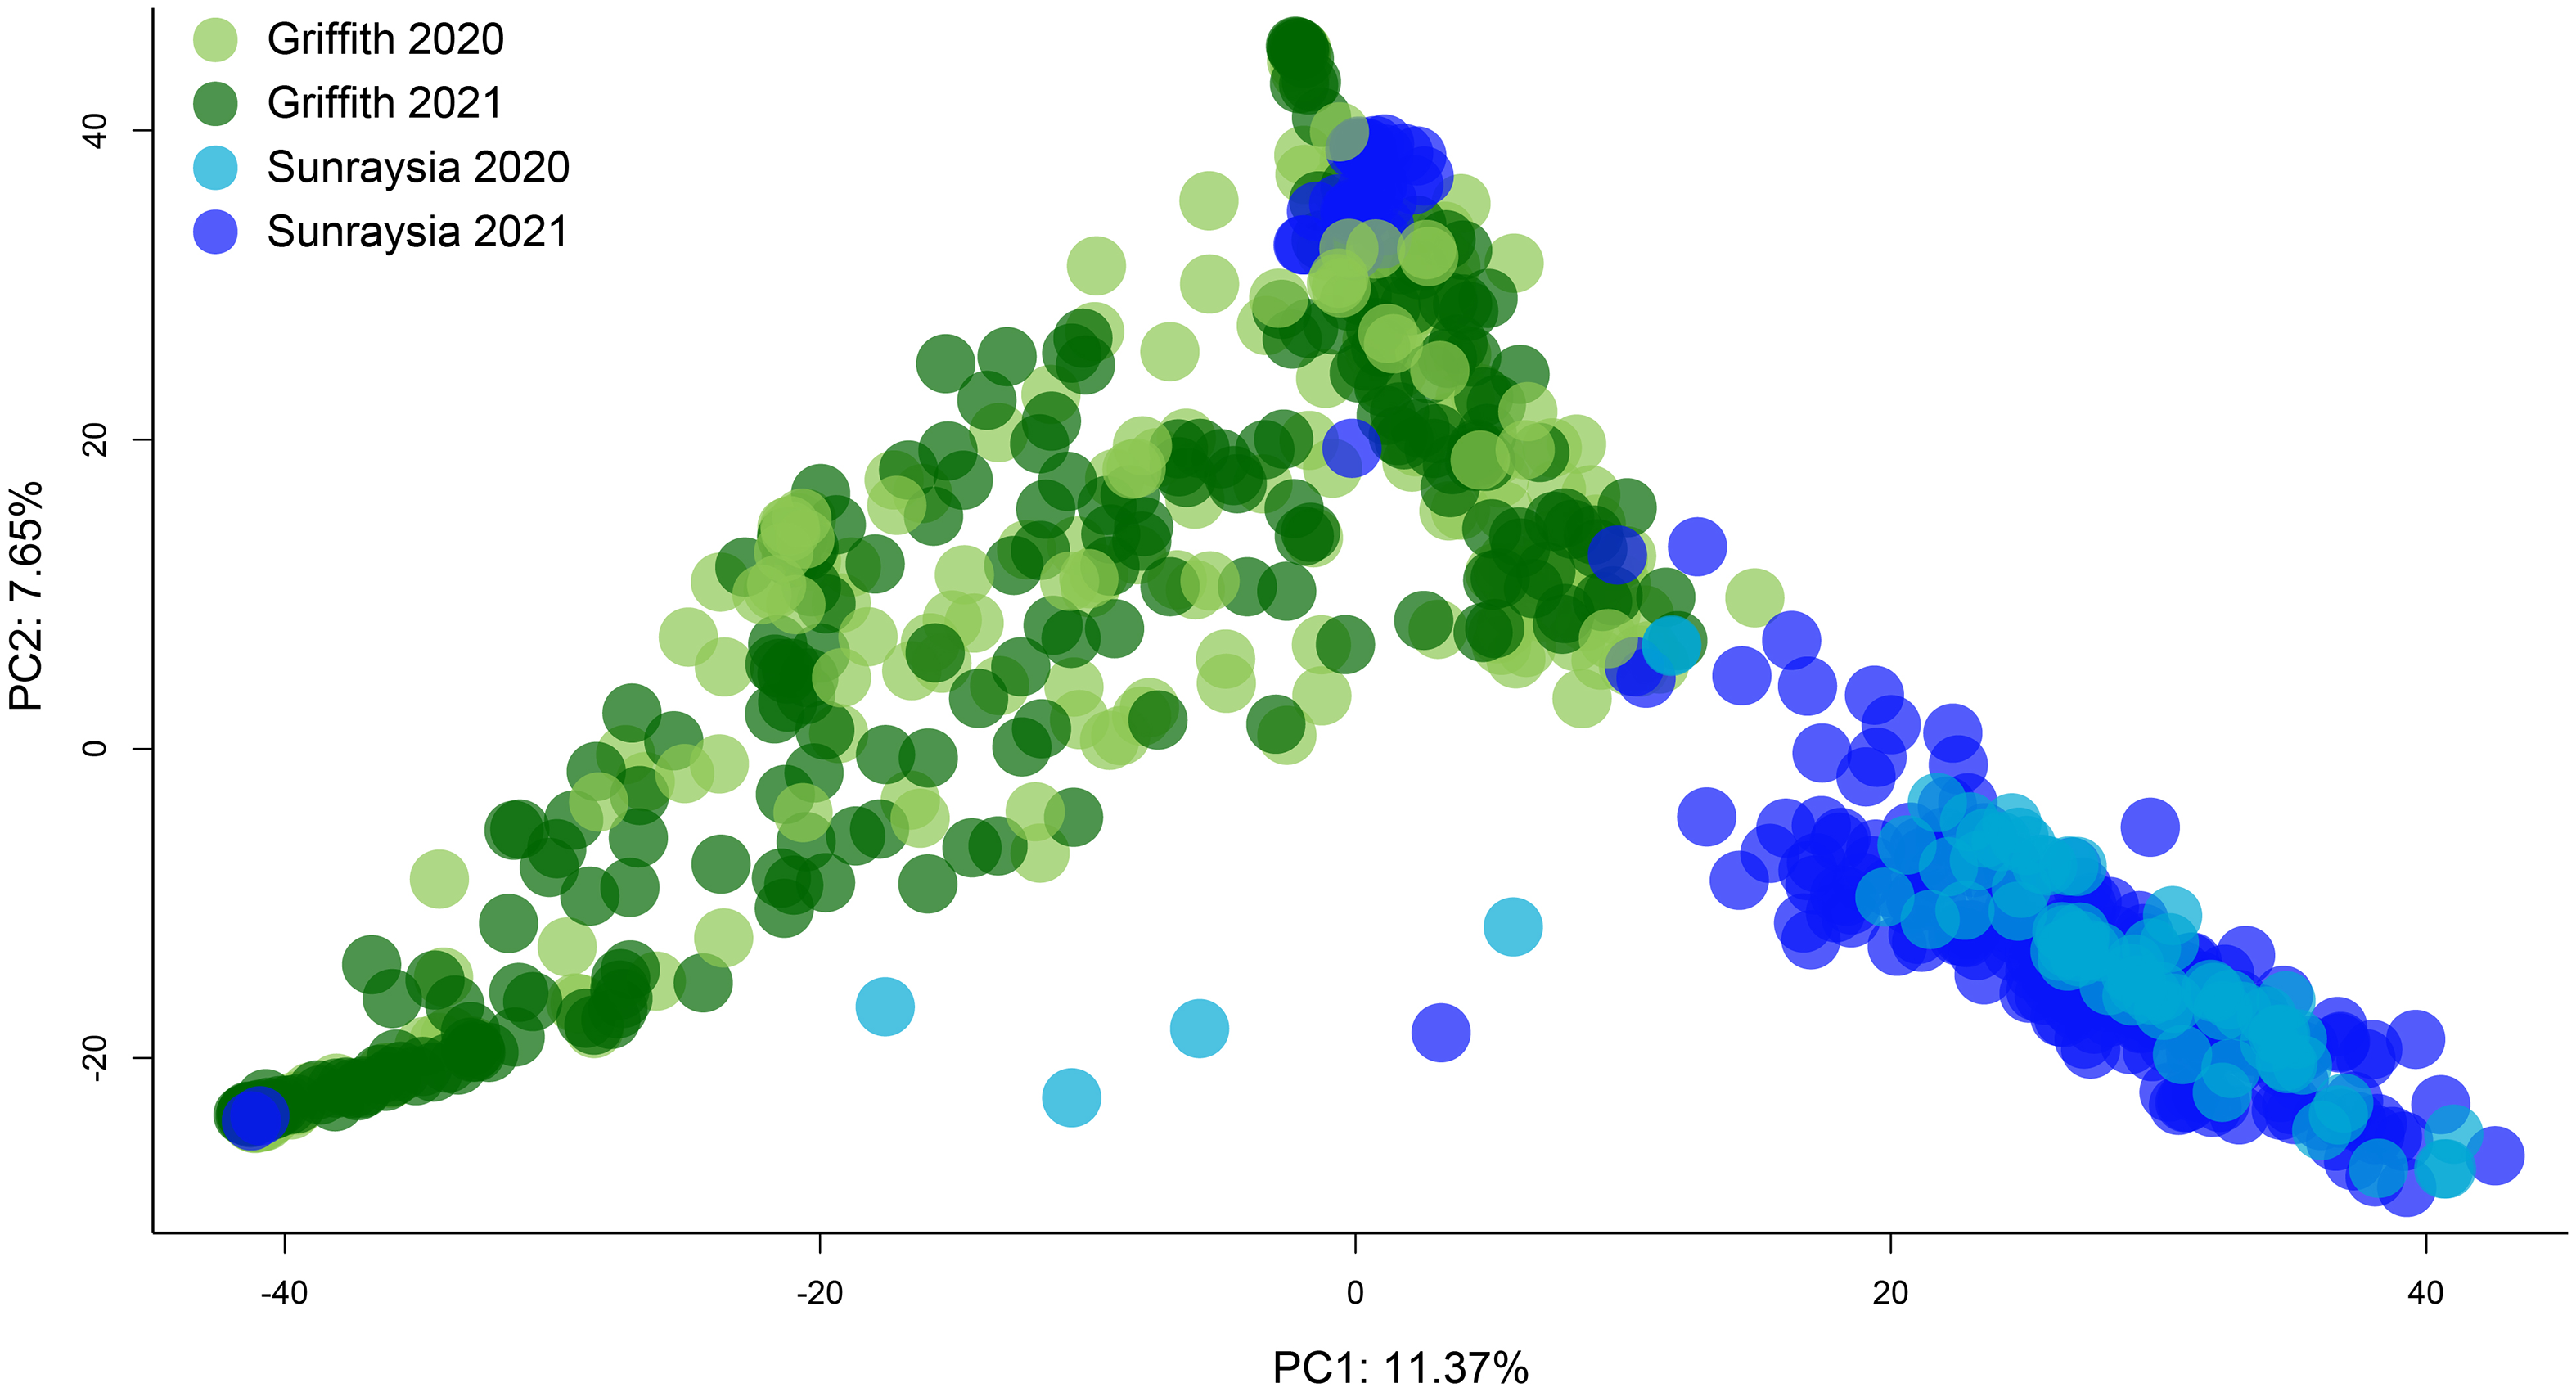
Our results demonstrate the utility of population genetics and parentage analysis for uncovering dispersal in weed species. We find evidence for long-distance dispersal with populations in Sunraysia in 2021 clustering with samples from the Riverina (Figure 2) and evidence for one multilocus genotype being found in both regions more than 350 km apart. We found multilocus genotypes spread across sites spanning 71 km in the Riverina region (Figure 3), representing the result of self-fertilization perhaps spanning multiple generations. We found significant population structure within the Riverina region (Figure 4), but less so in Sunraysia (Figure 5), with the exception of individuals that appear to be the result of long-distance dispersal. The parentage analysis revealed multiple parent–offspring matches covering distances up to 36 km in the Riverina region (Figure 6) and 71 km in the Sunraysia region (Figure 7).
Top, genetic clustering (principal component analysis [PCA] axes 1 and 2) for all Conyza bonariensis samples collected from both regions in 2020 and 2021; inset shows the eigenvalues. Samples from the two regions largely form two distinct genetic clusters, although some samples collected from Sunraysia in 2021 were placed in the same cluster as the samples from the Riverina. Bottom, plot of the inbreeding coefficient, FIS, by population, showing the observed heterozygosity (Ho), the unbiased expected heterozygosity (uHe), and the inbreeding coefficient (FIS) for each population sampled; numbers in brackets indicate the number of individuals genotyped in that population.
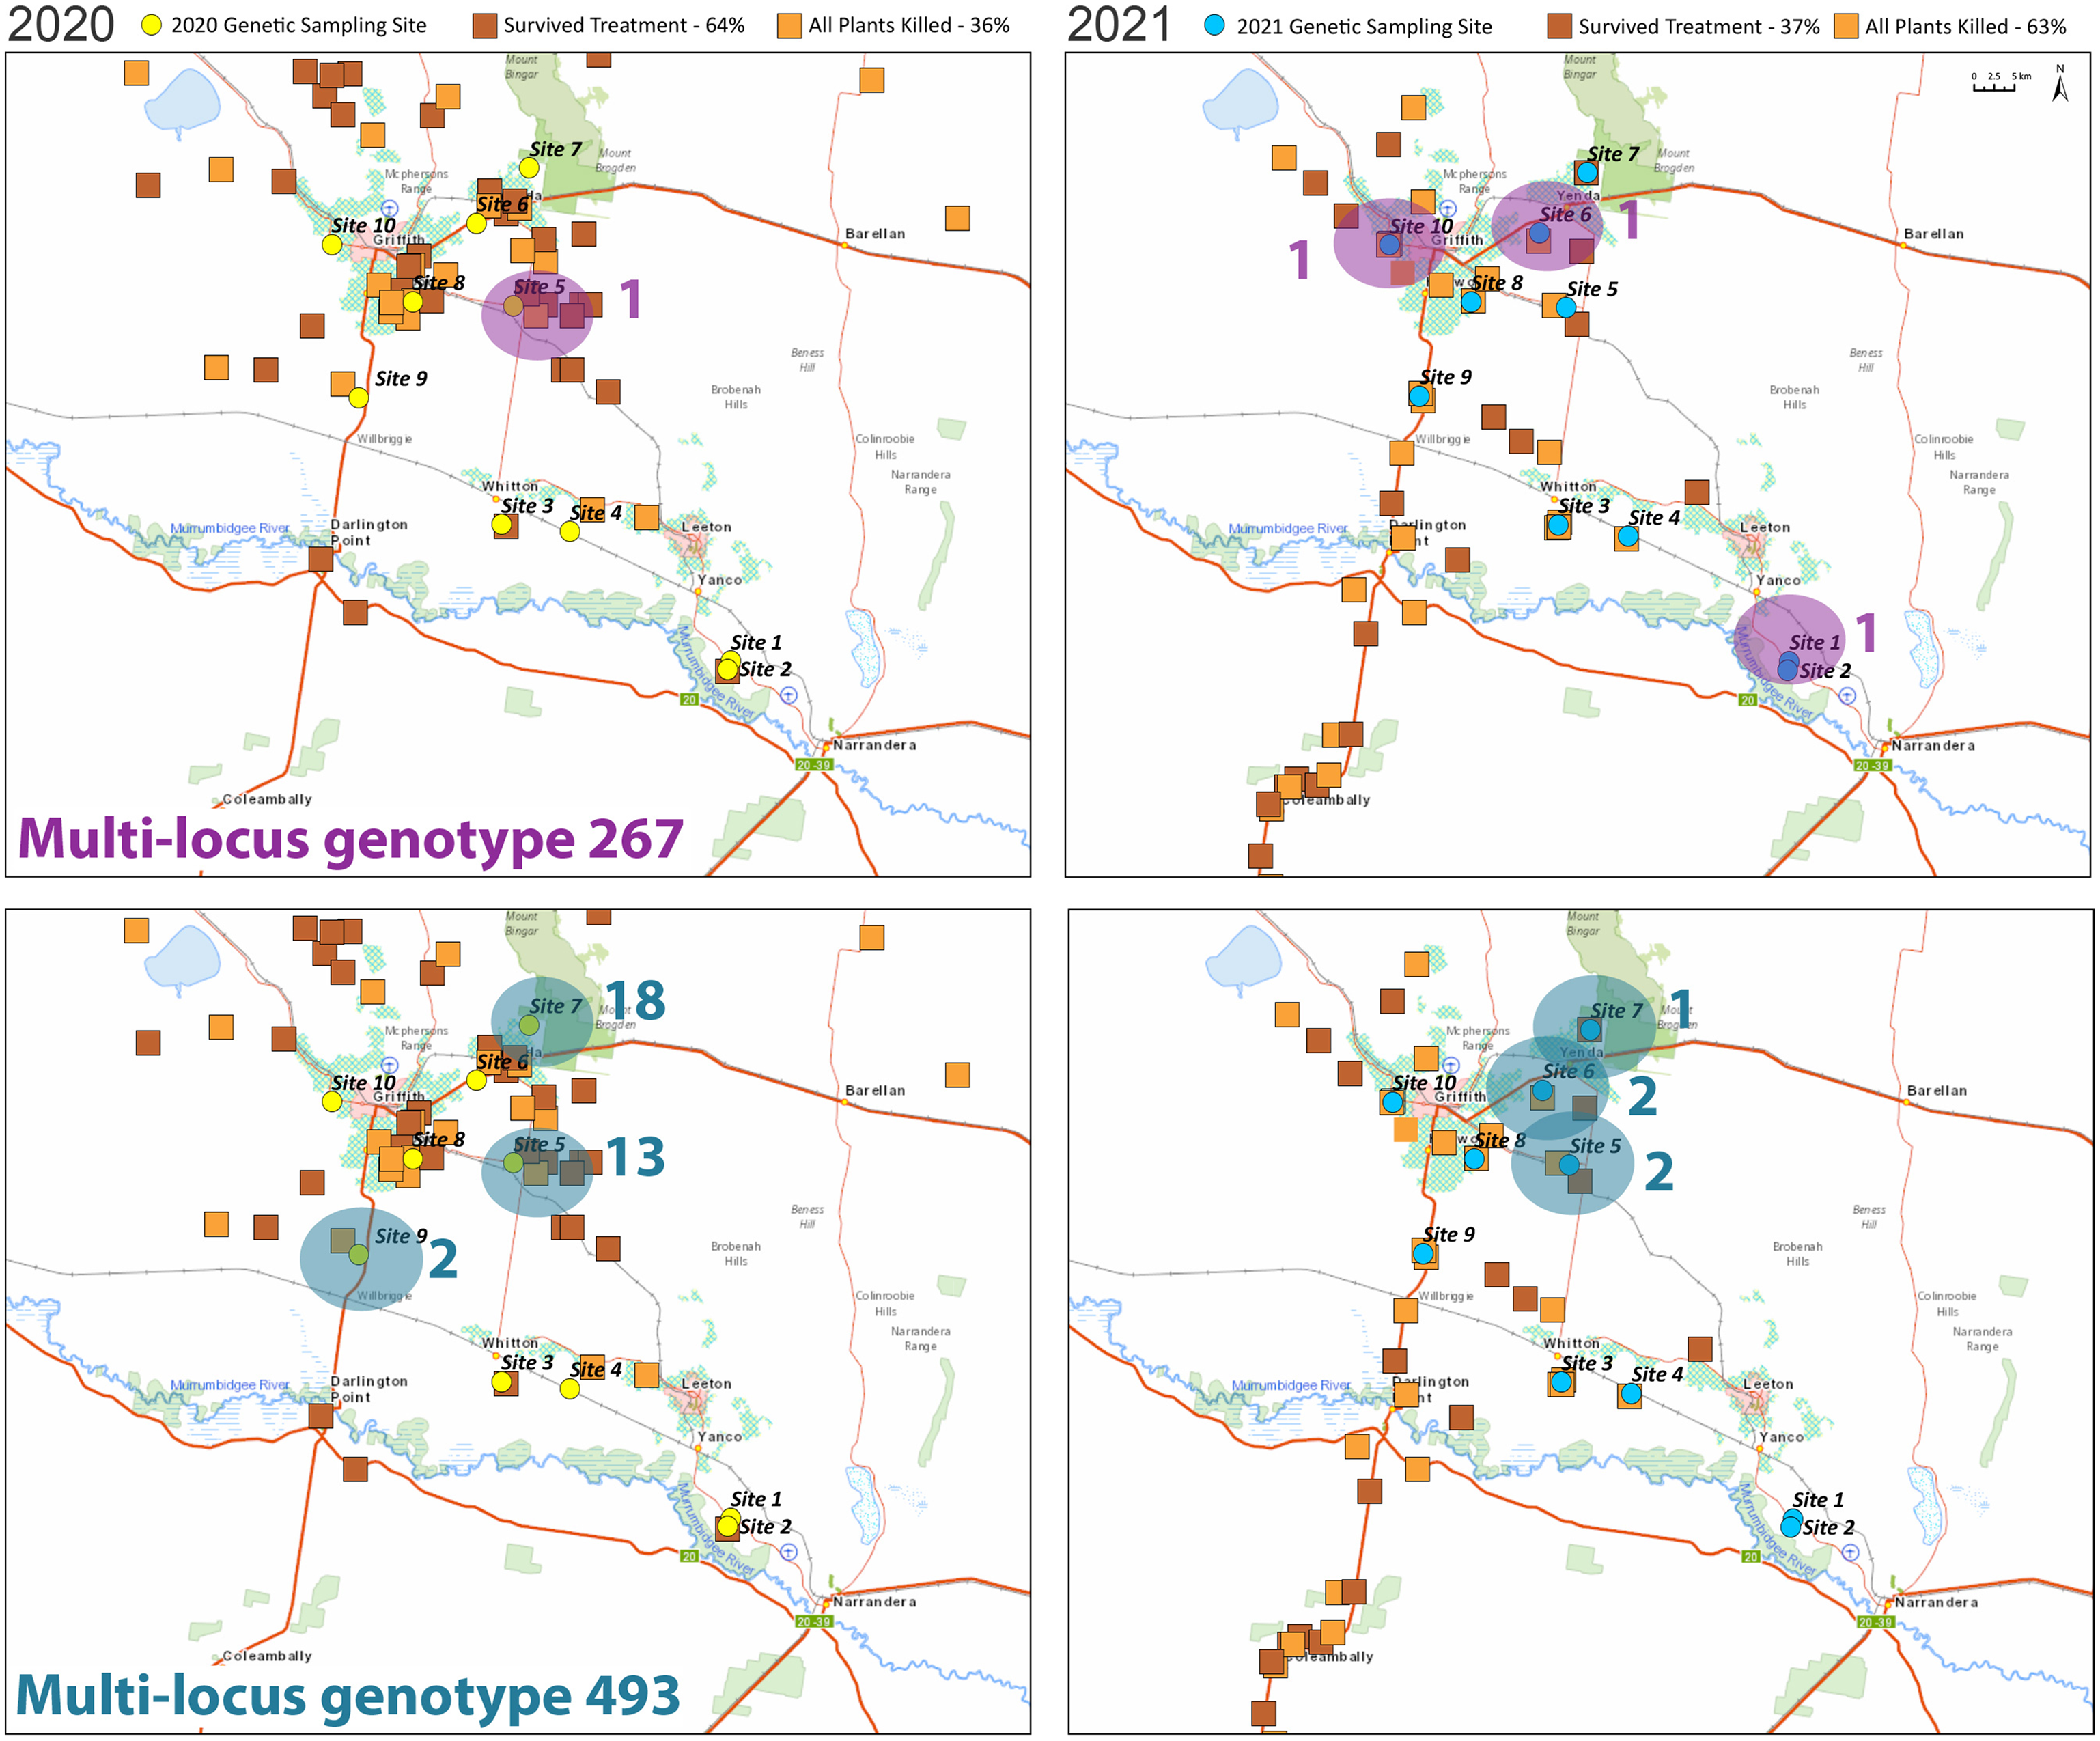
Maps showing the distribution of two of the multilocus genotypes in the Riverina region and glyphosate resistance (orange squares). Multilocus genotype 267 was found in one site in the Riverina in 2020 and three sites in 2021 (top), multilocus genotype 493 was found in three sites in 2020 and three in 2021 (bottom). The oval shapes show sites where the multilocus genotype was present, and the numbers indicate how many individuals at that site had that multilocus genotype.
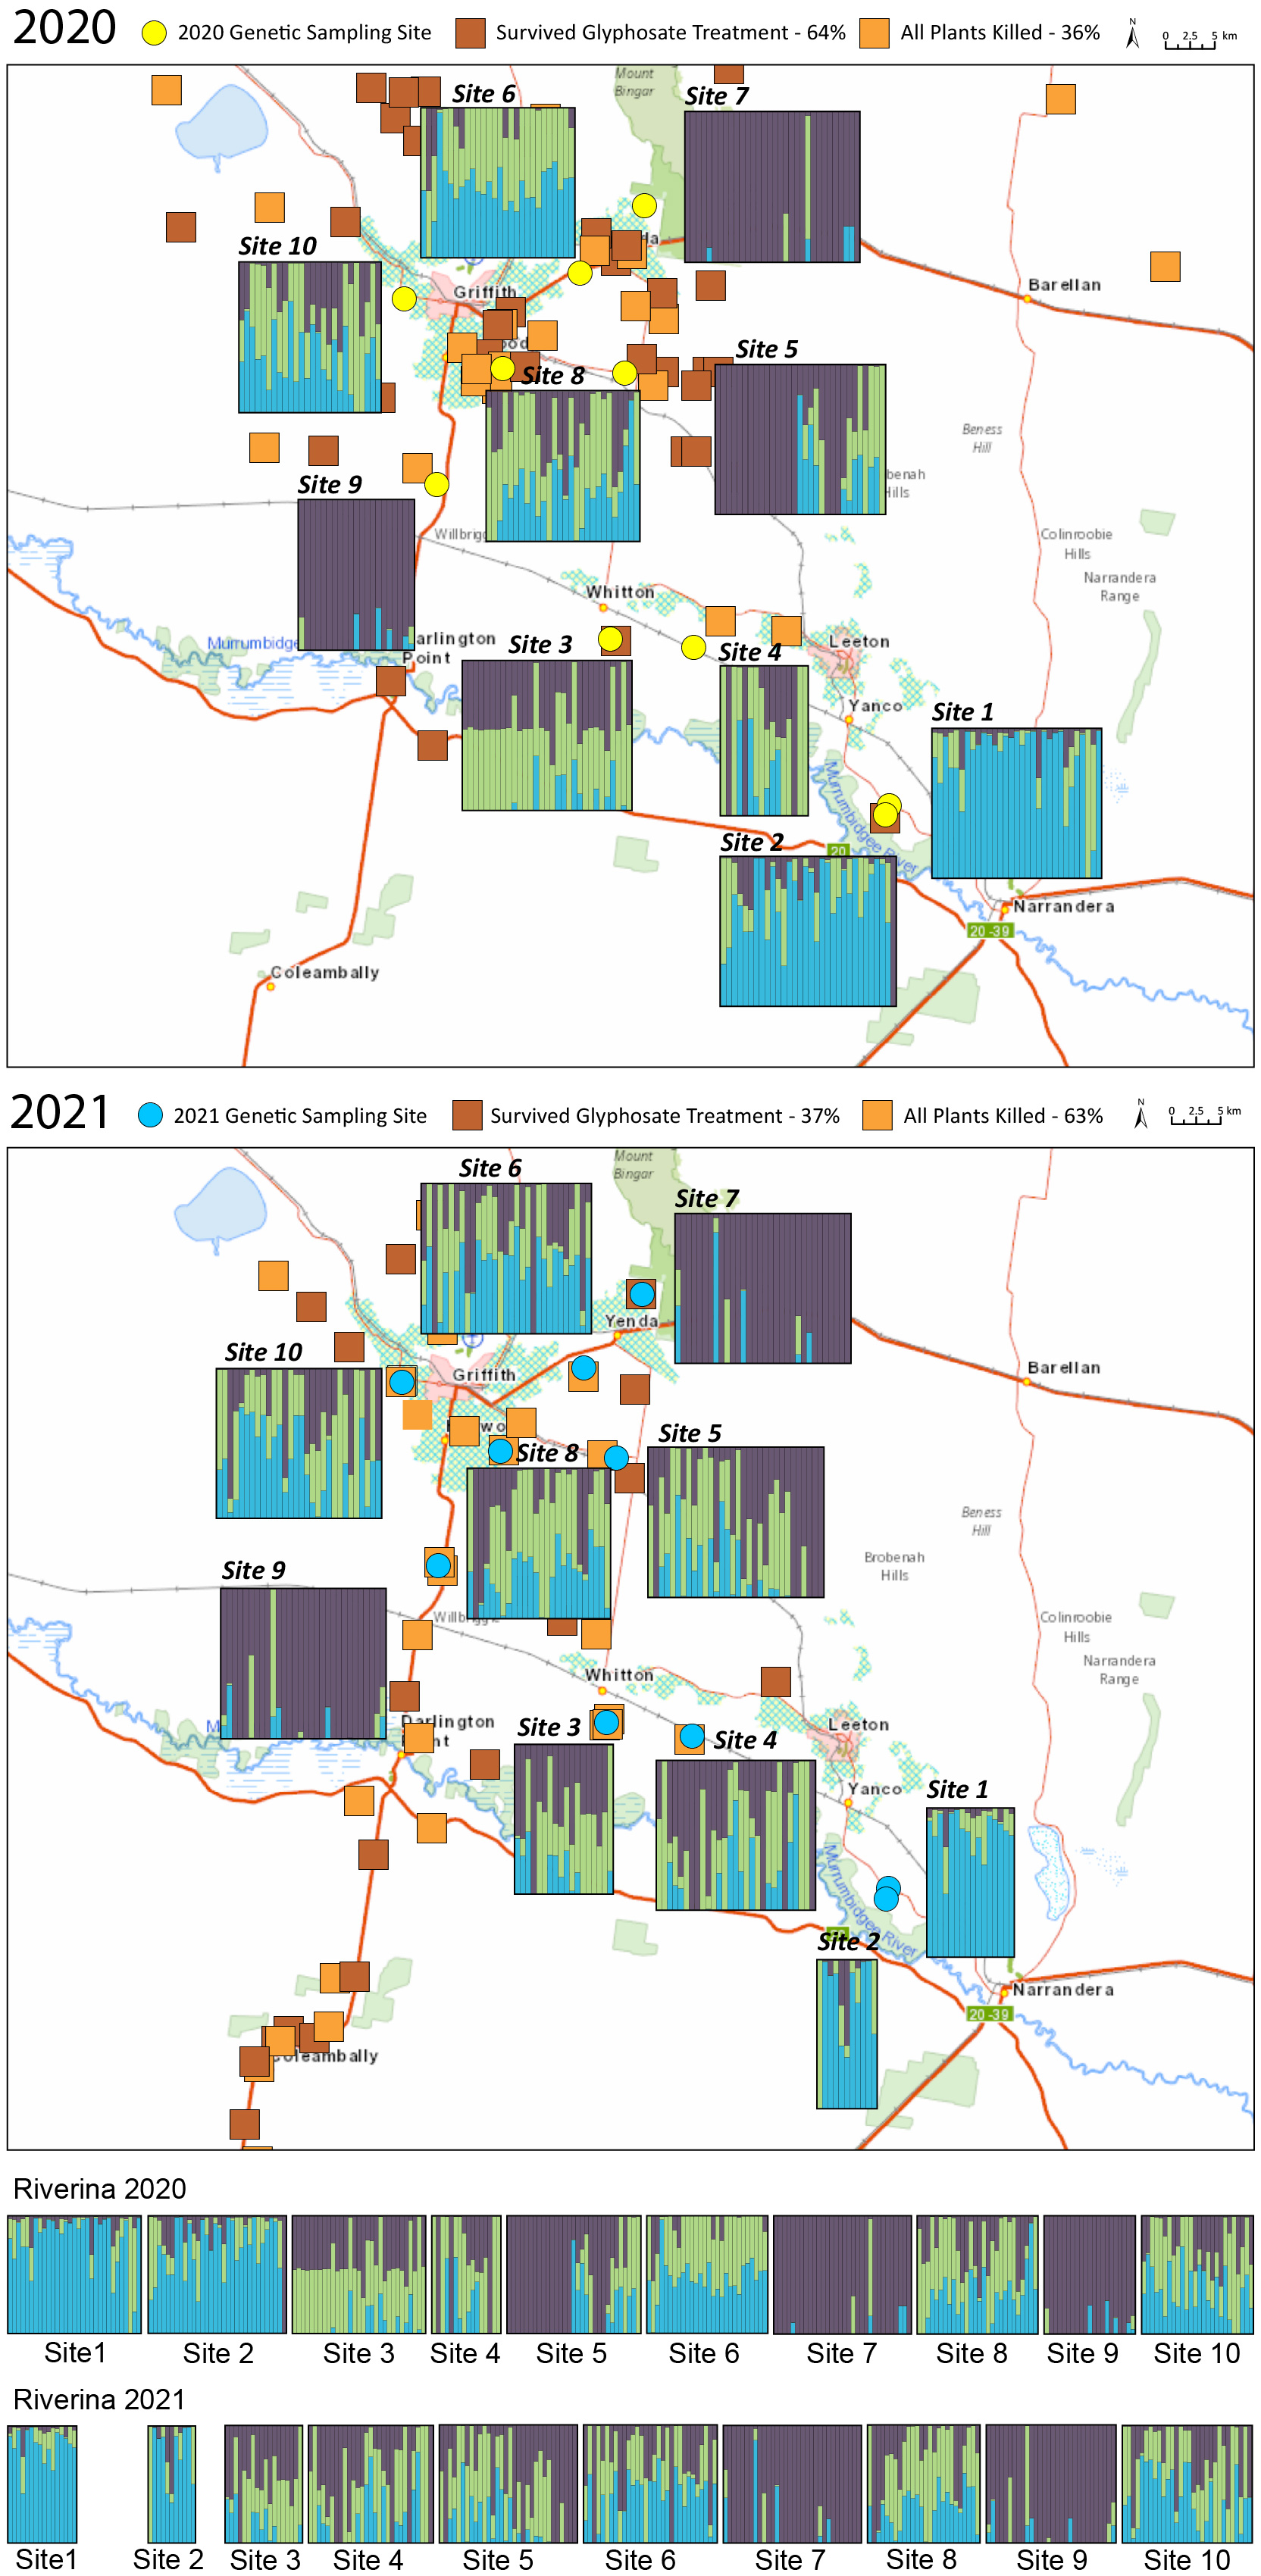
Maps showing the results of the STRUCTURE analysis and herbicide-resistance screening for all samples from the Riverina in the 2020 season (top) and 2021 season (middle). Results of the resistance screening are represented by the light and dark orange squares. For the structure plots, each bar represents one individual weed; the colors within each bar represent the posterior probability of assignment of that individual to each of three different clusters. The structure results are also shown for each year by site (bottom); the genetic structure was very similar across the two seasons.
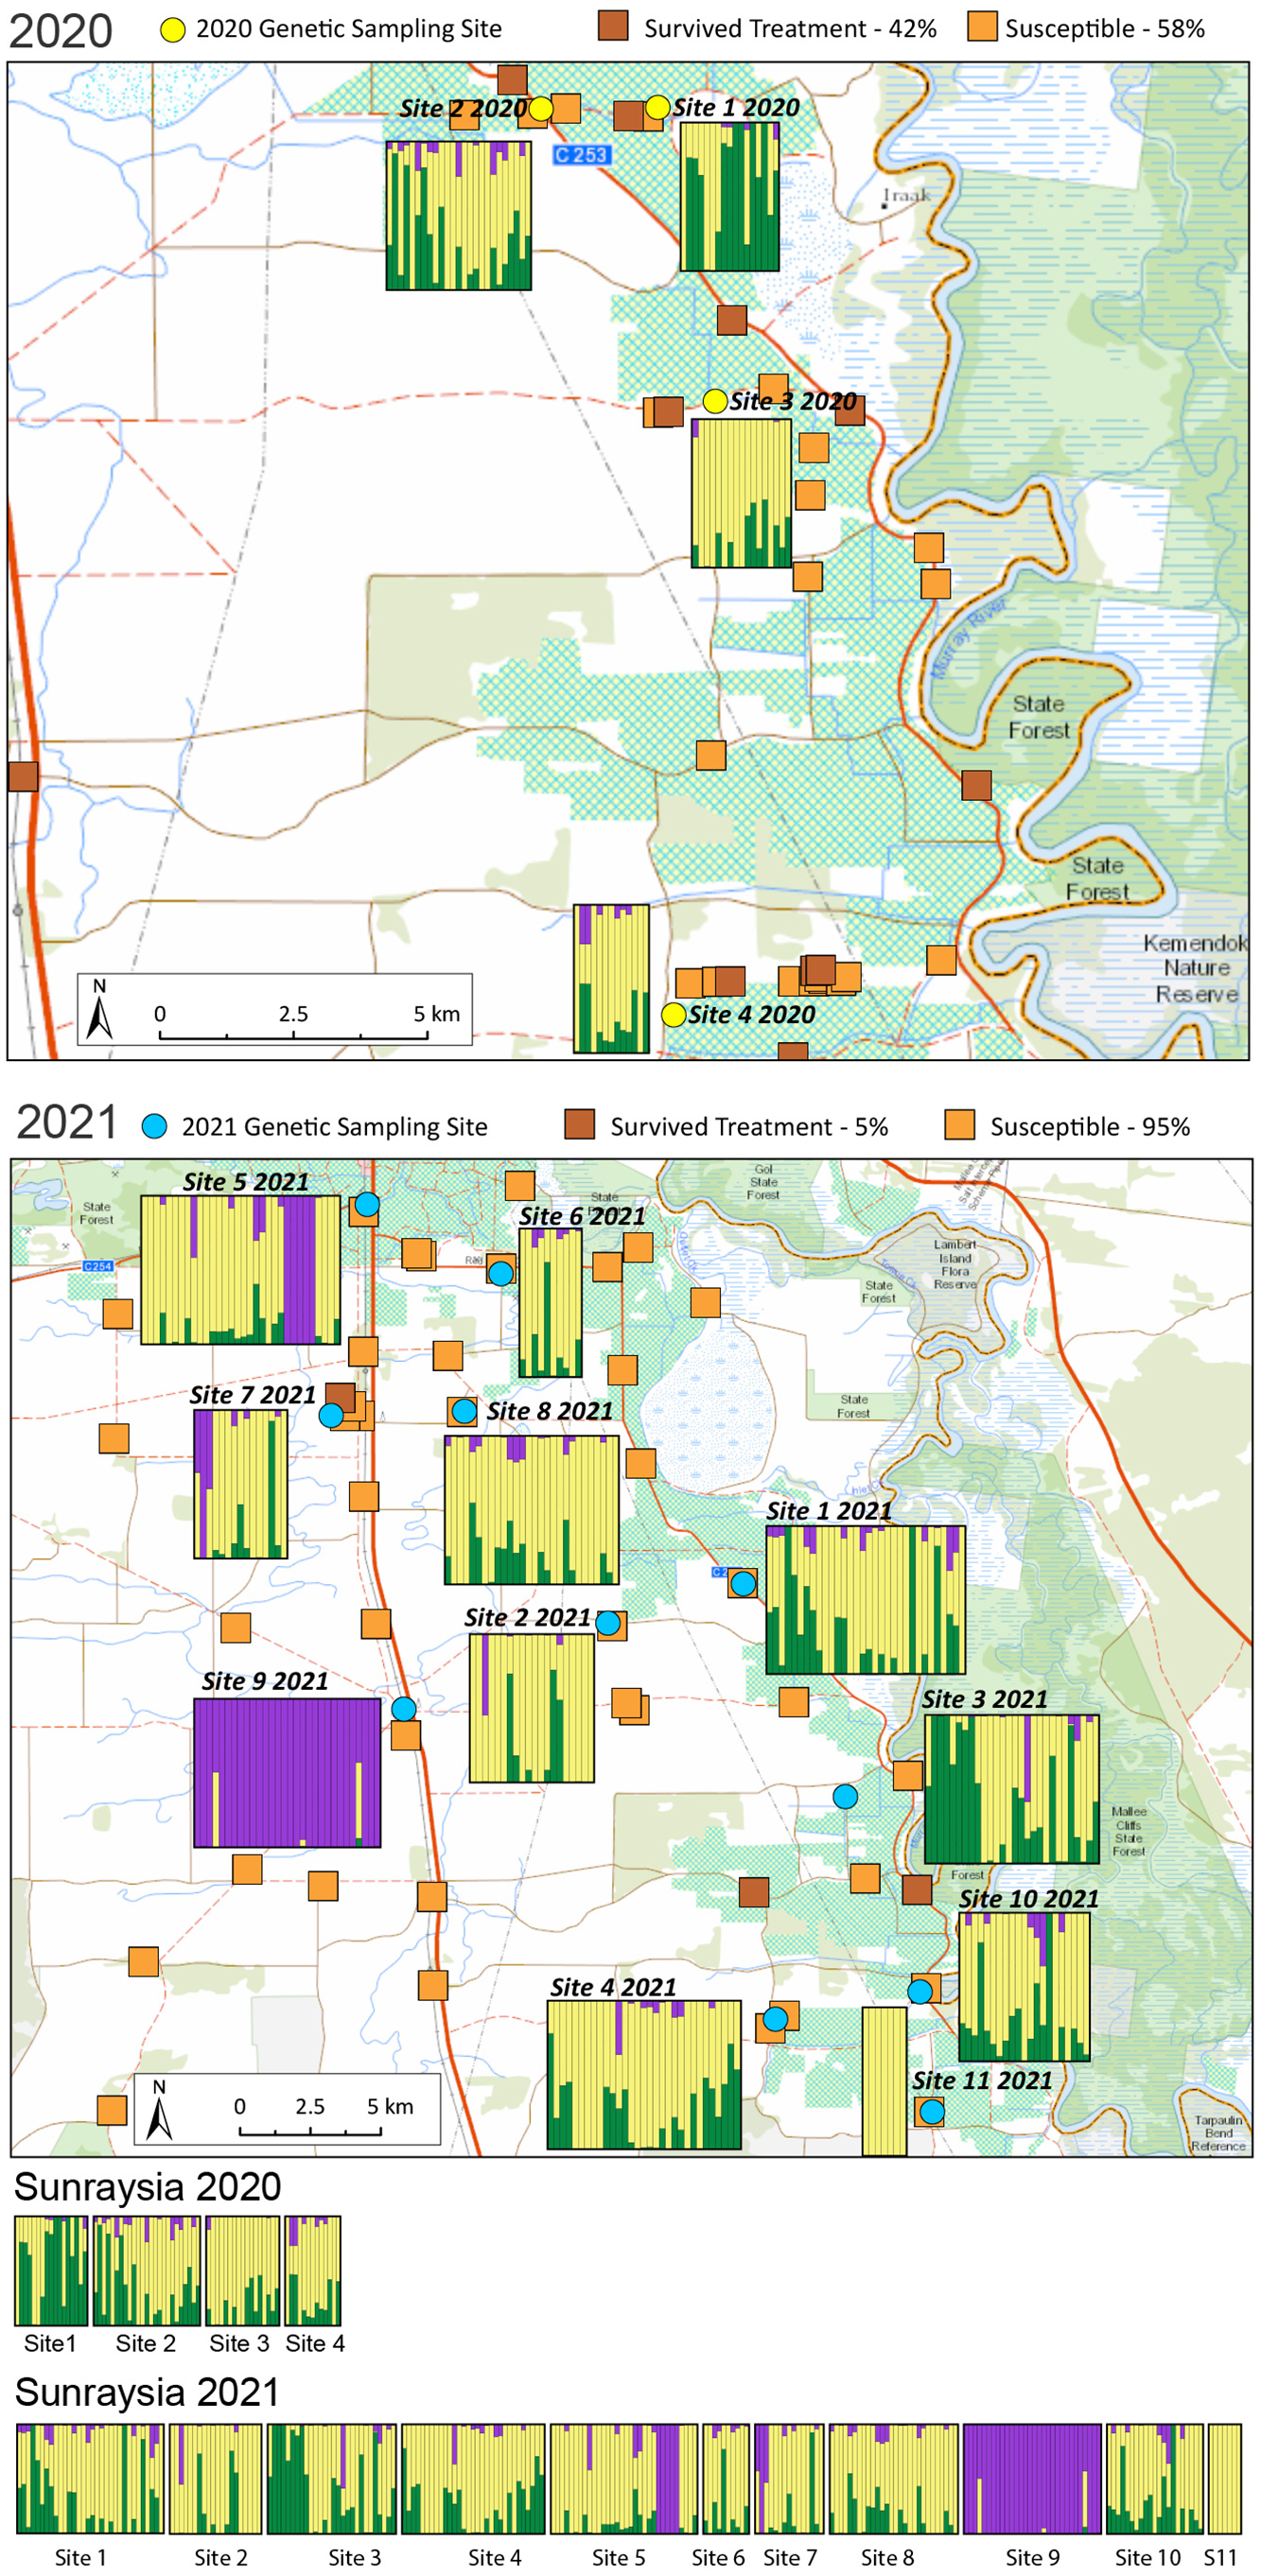
Map showing the results of the STRUCTURE analysis and herbicide-resistance testing for all samples from Sunraysia in the 2020 season (top) and 2021 season (middle). Results of the resistance screening are represented by the light and dark orange squares. For the structure plots, each bar represents one individual weed; the colors within each bar represent the posterior probability of assignment of that individual to each of three different clusters. Structure plots also shown for each season (bottom).
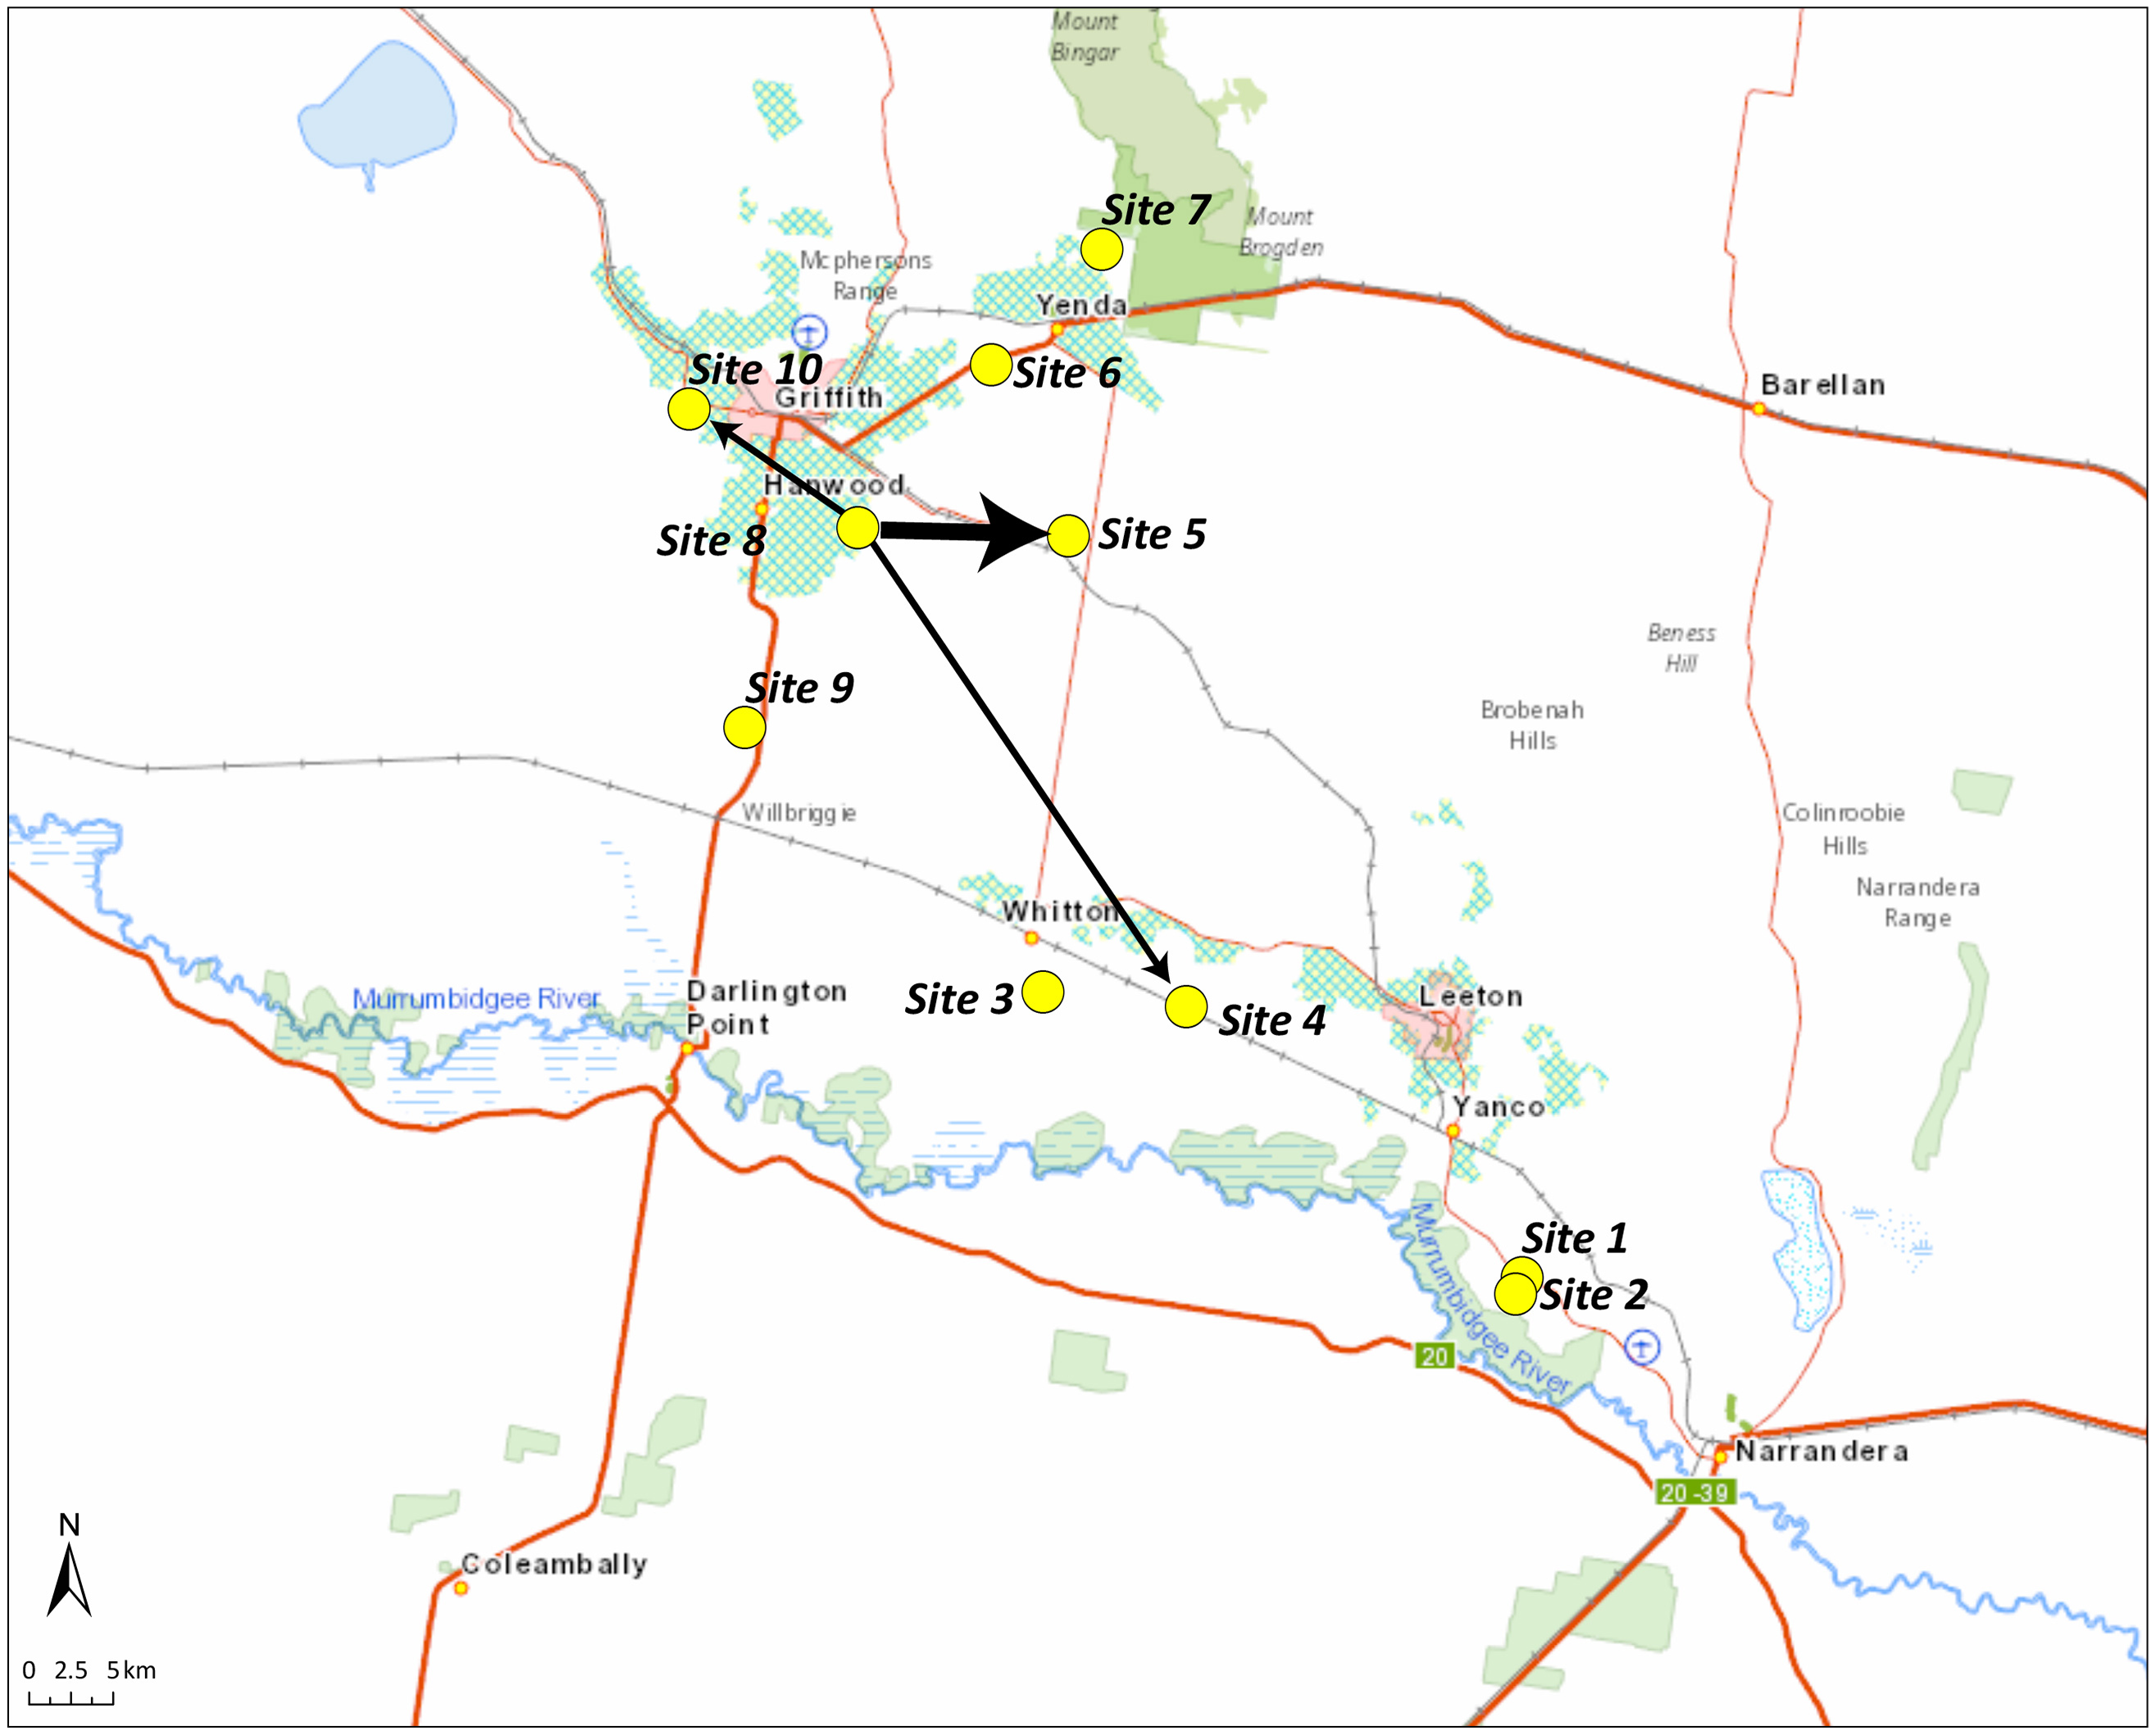
Inference of movement based on parentage analysis of Conyza bonariensis samples collected in the Riverina region in 2021 (offspring) and 2020 (parents). Arrows indicate direction of movement from a parent site to an offspring site; the size of the arrow indicates the number of parent–offspring connections.
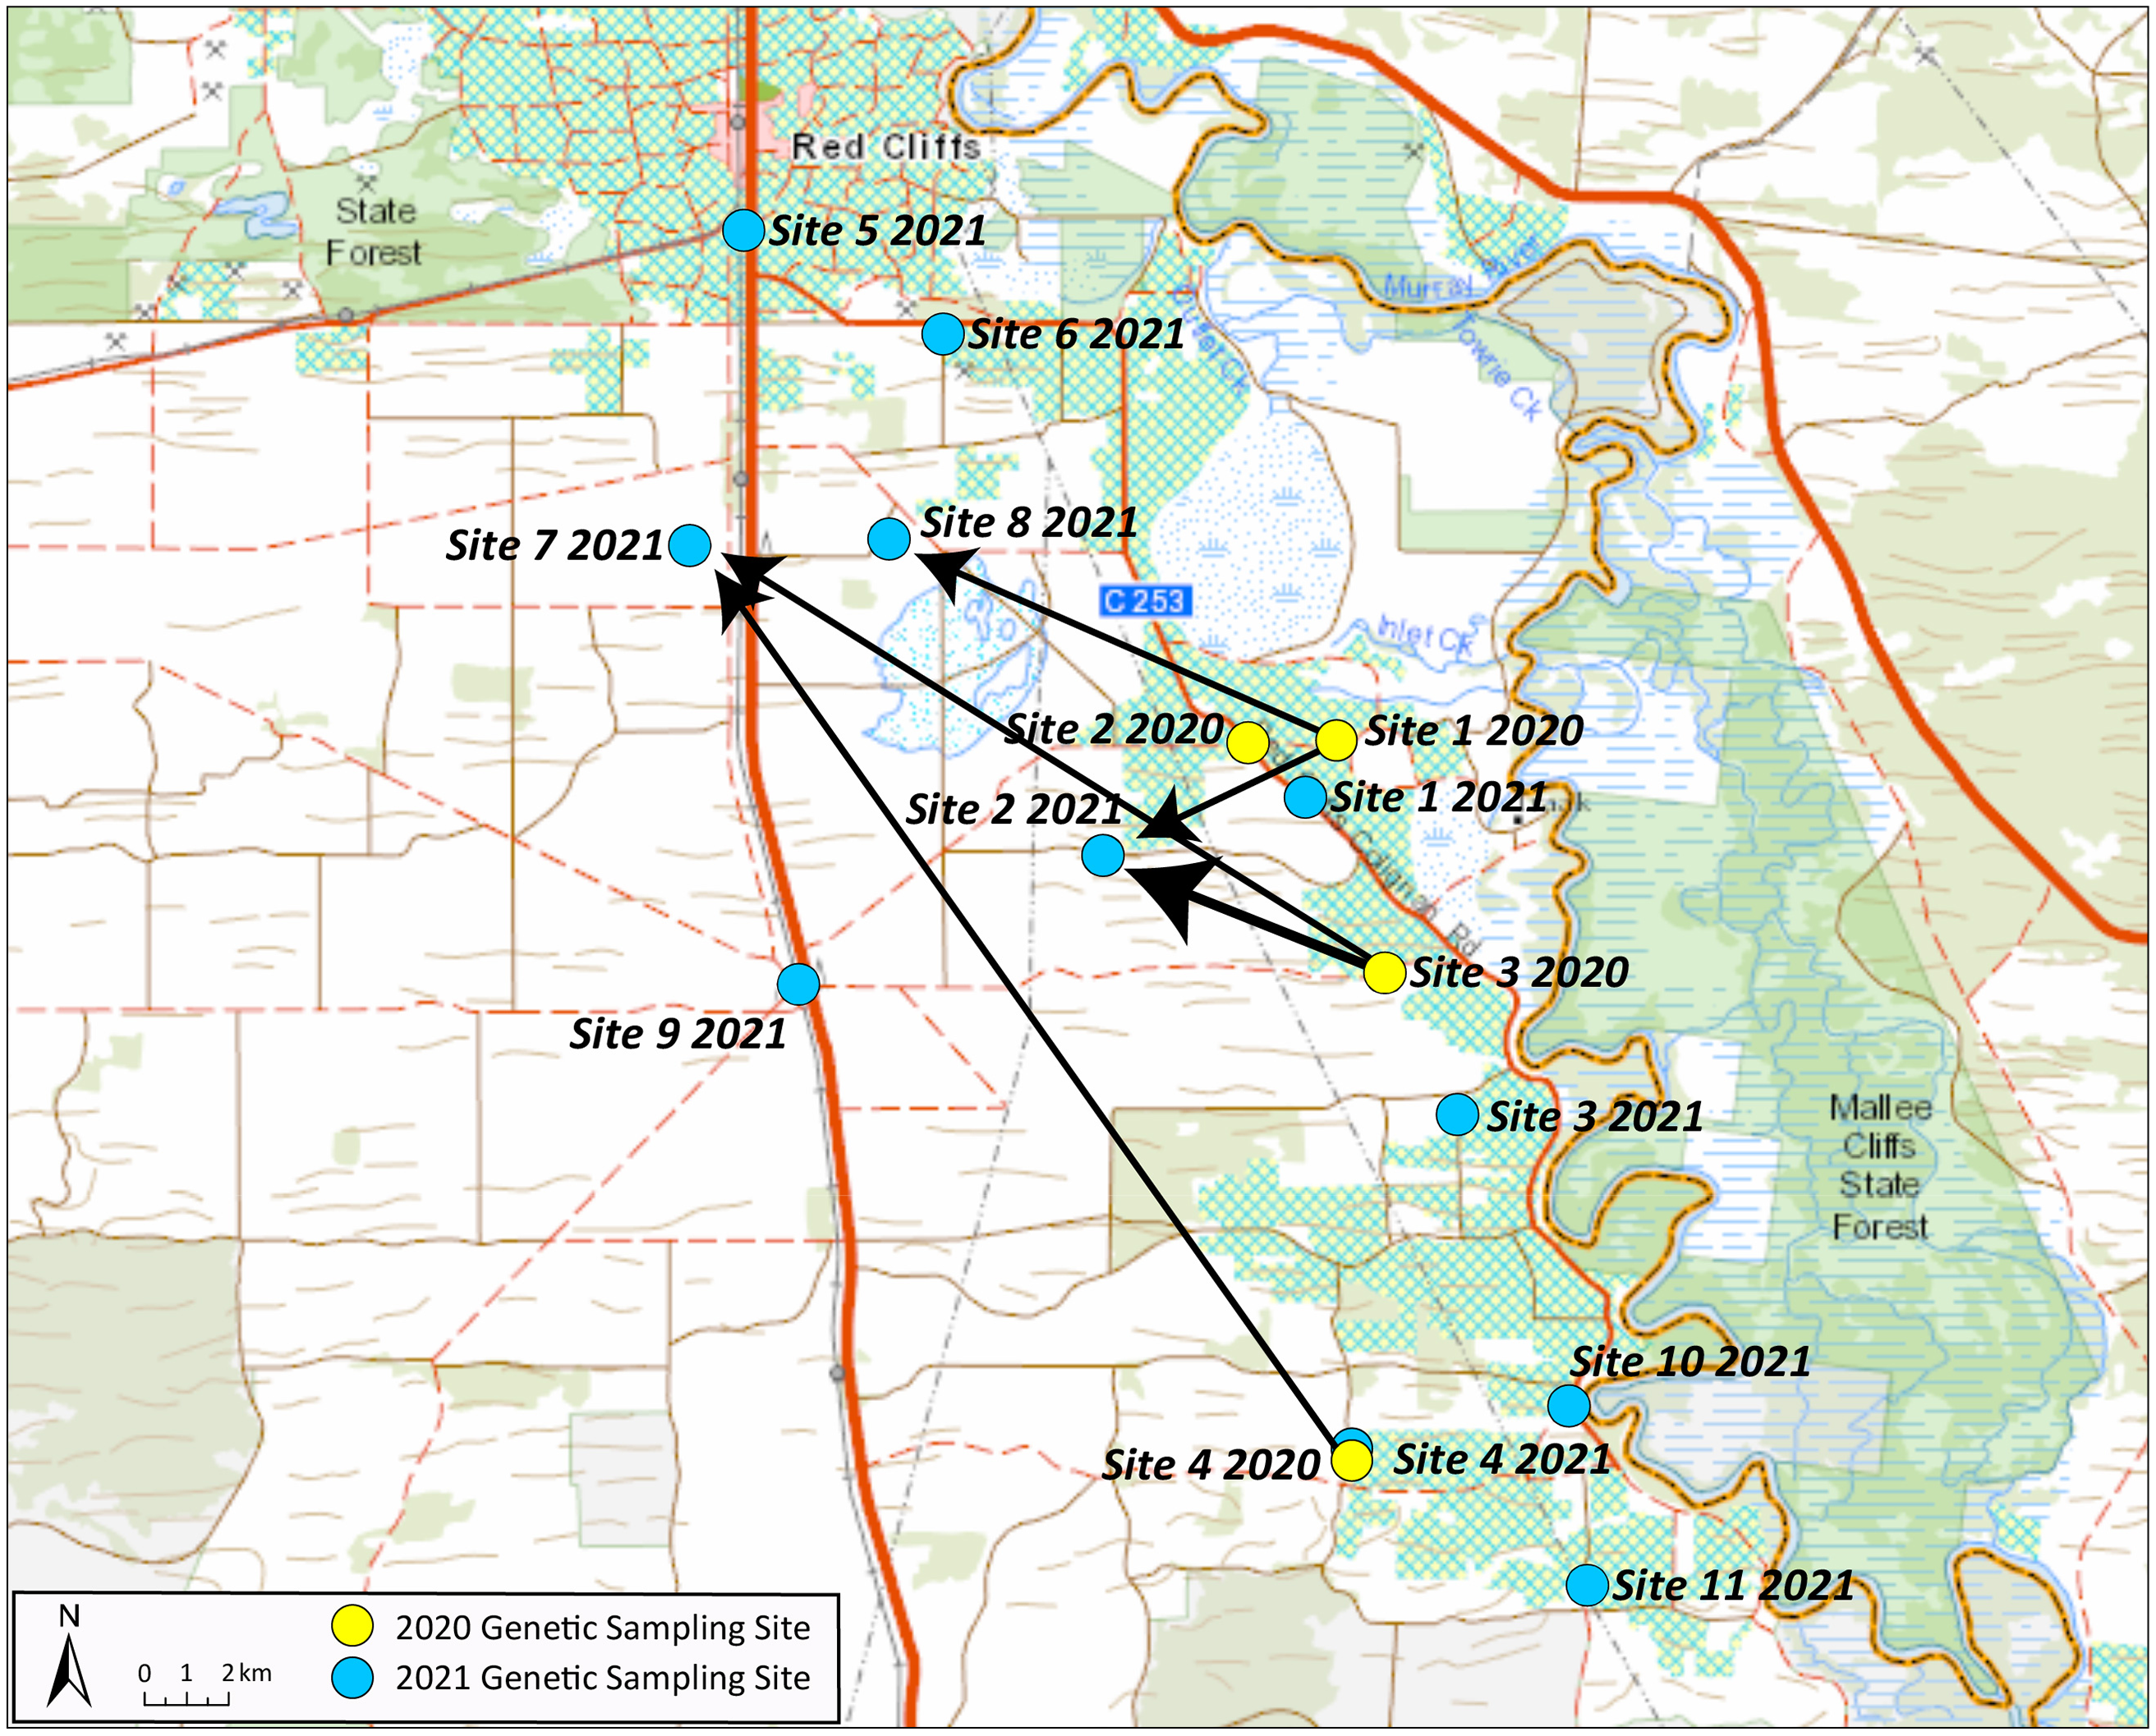
Inference of movement based on parentage analysis of Conyza bonariensis samples collected in the Sunraysia region in 2021 (offspring) and 2020 (parents). Arrows indicate direction of movement from a parent site to an offspring site; the size of the arrow indicates the number of parent–offspring connections.
Herbicide Resistance
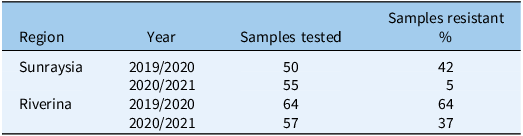
The glyphosate-resistance survey identified glyphosate resistance in each region and in each year of the survey (Table 1). For samples collected in 2019/2020, there was a high frequency of resistance to glyphosate in both regions; however, many samples remained susceptible to the herbicide. For samples collected in 2020/2021, resistance to glyphosate was high in Riverina, but low in Sunraysia. Sunraysia had drought conditions in 2019, so C. bonariensis was mainly present on roadsides and irrigation channels, areas where weeds are frequently controlled by glyphosate. More rainfall occurred in spring of 2021, resulting in C. bonariensis occurring over more land uses. This could explain the decline in resistance observed in Sunraysia in the 2020/2021 samples. Glyphosate resistance in C. bonariensis was not found to be significantly spatially structured in any year or site (P > 0.1). This included no significant subregional or localized clustering of susceptible or resistant sampled populations (Figures 3, 4, and 6) so resistance can be assumed to be randomly distributed spatially. We found no evidence that a resistant population made susceptibility less likely in nearby sampled populations. Crucially, in both regions, the frequency of resistance is well below 100% and fluctuated across seasons, which means there is an opportunity for efforts to reduce overall rates of herbicide resistance in a region.
Percentage of Conyza bonariensis samples collected from Sunraysia and Riverina across 2 years that were resistant to glyphosate.
Population Structure
For the population genetics and parentage analysis, 3,573 SNP markers were retained in the full dataset and 1,056 in the single SNP dataset (thinned to 1 SNP per 1,000 bp) after filtering. As previously reported for Amplified Fragment Length Polymorphism data (Minati et al. Reference Minati, Preston and Malone2020), we recovered high genotypic diversity in C. bonariensis populations in our SNP data, with 865 unique multilocus genotypes found from a total of 939 samples retained after filtering. This indicates that some degree of outcrossing occurs in the populations sampled. The high values we recorded for the inbreeding coefficient FIS indicate that outcrossing is likely to occur at very low frequencies in this species (Figure 2), as also reported in California by Okada et al. (Reference Okada, Hanson, Hembree, Peng, Shrestha, Stewart, Wright and Jasieniuk2015). Herbicide resistance is therefore primarily spread by seeds in C. bonariensis rather than by pollen.
When all populations from both regions were compared together in a PCA, samples from the Riverina region were mostly genetically distinct from samples from the Sunraysia region. There were two clusters evident in the PCA plot, with most samples from the Riverina placed in the cluster to the left of the plot and most from Sunraysia placed in a separate cluster to the right (Figure 2). Some individuals collected in Sunraysia in 2021 were placed in the same cluster as the samples from the Riverina. Of the overall variance in the data, 11.37% was explained by PC1 and 7.65% explained by PC2. FIS values were high for all populations, indicating high levels of inbreeding consistent with self-fertilization, but there was variation between populations in the value of FIS (Figure 2).
The majority of the multilocus genotypes found were present in two individuals from the same site, but seven of them were found at multiple sites (Supplementary Data Table S1). We plotted the distribution of the two most common multilocus genotypes across sites in the Riverina region (Figure 3). One of these (MLG 493) was detected at sites separated by 34 km in the Riverina region, and one individual was even detected in the Sunraysia region (more than 350 km away) in 2021. The other (MLG 267) was found at three sites in the Riverina in 2021, with the furthest of these being 71 km apart (Figure 3). These multilocus genotypes that are found at different sites represent individuals that share a common ancestor through self-fertilization and are therefore evidence of movement that may have occurred across several generations.
Despite the evidence we find for long-distance dispersal, we found surprisingly high genetic population structure in C. bonariensis between the Sunraysia and Riverina regions, but especially within the Riverina region. Significant population structure was also detected in a population genetics analysis of C. bonariensis populations in California (Okada et al. Reference Okada, Hanson, Hembree, Peng, Shrestha, Stewart, Wright and Jasieniuk2015). Other studies on outcrossing species have found contrasting results, with blackgrass populations (Alopecurus myosuroides Huds.) in the United Kingdom having essentially no population structure (Dixon et al. Reference Dixon, Comont, Slavov and Neve2021), and a similar lack of structure in kochia [Bassia scoparia (L.) A.J. Scott] (Martin et al. Reference Martin, Benedict, Wei, Sauder, Beckie and Hall2020). In contrast, Palmer amaranth (Amaranthus palmeri S. Watson), also an obligate-outcrossing species, had relatively high population structure at the scale of three U.S. states, although not all these samples were collected contemporaneously (Küpper et al. Reference Küpper, Manmathan, Giacomini, Patterson, McCloskey and Gaines2018). The high population structure we detect in C. bonariensis may in part be due to self-fertilization reducing the effect of dispersal on the genetics of local populations.
When samples from the Riverina were analyzed in a STRUCTURE analysis, K = 3 was the most likely number of populations inferred using the Evanno method (Evanno et al. Reference Evanno, Regnaut and Goudet2005). There was considerable genetic differentiation across the region, and this was related to geography, with sites 1 and 2 (near to Narrandera) being mostly assigned to a distinct cluster from the other sites (Figure 4). The overall pairwise FST values were quite high (0.245 for 2020 and 0.163 for 2021), indicating high levels of population differentiation. The measures of inbreeding were also high (FIS = 0.723 for 2020 and 0.753 for 2021). The assignment to clusters was very similar across seasons when sites sampled in the 2020 season were compared with the same sites sampled in the 2021 season (Figure 4), although sites 3, 4, 5, and 6 had slightly different admixture proportions in 2021 compared with 2020. This suggests that the populations present in 2021 had largely come from the plants present at the same site in the previous year rather than moving extensively across sites (Figure 4). Overall, these results indicate that local-scale movement may be a more important driver of C. bonariensis population genetics than long-distance dispersal in this region.
Only four sites could be sampled from the Sunraysia region in 2020 due to drought conditions; the overall assignment of these populations was similar in the structure analysis, but site 1 had a higher proportion of assignment to one of the hypothetical populations (Figure 5). In the samples from 2021, the population sampled from site 9 and five individuals from site 5 were assigned to a different cluster compared with the other sites (Figure 5). These individuals were the same as the ones assigned to the Riverina cluster in the PCA (Figure 2). The rest of the samples from 2021 generally had the same assignment as the populations sampled in 2020 (Figure 5). Pairwise FST values were lower for the 2020 season (FST = 0.08), indicating very little genetic differentiation across the four sites sampled in that year, but the mean pairwise FST was higher in the 2021 season (FST = 0.187) and similar to the values for the Riverina region, with this being driven by the differentiation of individuals at sites 5 and 9. The inbreeding coefficient FIS was slightly higher for the Sunraysia sites than for the Riverina (FIS = 0.802 in 2020 and 0.815 in 2021). There was much less evidence of local geographic population genetic structure in this region compared with the Riverina, but this may be due to the drought conditions having reduced populations in the 2020 season and a greater role of reestablishment from the seedbank and local dispersal in reestablishing populations in the subsequent season.
Parentage Analysis and Movement
The parentage analysis of C. bonariensis samples in the Riverina region found 14 instances of parent–offspring matches with greater than 0.95 probability. Eight of these consisted of parents and offspring collected from the same site, but six of them had an offspring found in a different site from the parent, indicating intergenerational dispersal. Of these, four represented a parent in site 8 and an offspring in site 5, one a parent in site 8 and an offspring in site 4, and one a parent in site 8 and offspring in site 10 (Figure 6). The greatest distance between these sites was 36 km. In the Sunraysia region, the parentage analysis revealed nine parent–offspring matches with greater than 0.95 probability, and three of these were from the same sites, with the other six representing intergenerational dispersal (Figure 7). Two of these had a parent in site 3 in 2020 and an offspring in site 2 in 2021, and the greatest distance between sites with a parent–offspring match was between sites 4 and 7, which are 71 km apart (Figure 7).
The dispersal capacity of C. bonariensis has been investigated previously in a field experiment in Western Australia, where a single plant produced about 6,000 seeds that were allowed to naturally disperse (Borger et al., Reference Borger, Doncon and Hashem2010). In the following year, 366 progeny were recorded; of these, ∼17% were found within 20 m of the parent plant, but 81% were found more than 100 m away, and the farthest was 1,842 m. In this study, we detected greater distances, highlighting the ability of genetic methods to detect greater dispersal distances than ecological approaches. In another experiment, radio-controlled airplanes were used to sample seeds of the related species, horseweed [Erigeron canadensis L.; syn: Conyza canadensis (L.) Cronquist], at different altitudes (Shields et al. Reference Shields, Dauer, VanGessel and Neumann2006). In that study, viable E. canadensis seeds were recovered as high as 140 m above the ground, leading to estimates of possible dispersal trajectories ranging from 70 to 500 km depending on wind speeds. The distances we find in the present study fit with these predictions of wind-dispersal trajectories for E. canadensis.
Our results suggest that perhaps local dispersal may be a more important driver of C. bonariensis population genetics than long-distance dispersal, although we did detect evidence of long-distance dispersal between regions in our data. The extremely high seed production and self-fertilization rates of C. bonariensis may mean that a few long-distance dispersal events tend not to contribute as significantly to local population dynamics, the short life of the seedbank also leads to rapid population turnover in this species; however, the spread of glyphosate resistance across Queensland cropping regions within 12 yr of its first detection highlights the importance of weed movement in spreading herbicide resistance in this species (Broster et al., Reference Broster, Jalaludin, Widderick, Chambers and Walsh2023; Walker et al. Reference Walker, Bell, Robinson and Widderick2011).
In summary, the results show not only the importance of local-scale movement but also evidence of significant long dispersal distances in C. bonariensis in the two regions. The study also provides evidence for spread of herbicide resistance through mobility, while also identifying that a significant proportion of glyphosate-susceptible plants remain in each region. These findings provide much needed information for growers and advisors considering the value of engaging in area-wide action and/or seed set prevention to reduce overall weed costs. Past research has found that fewer than one-third of growers are concerned about the spread of herbicide resistance from their property to neighboring properties (Schrader et al. Reference Schrader, Graham, Campbell, Height and Hawkes2024). Growers who were less concerned about the spread of herbicide resistance were less likely to work with others to manage weeds. This suggests that raising awareness about the extent to which C. bonariensis spreads may encourage more consideration of both area-wide and farm-scale implications, leading to more action to control mobile weeds by growers, with the result being reduced incidence and spread of mobile weeds and herbicide resistance (through preventing seed set of herbicide-resistant individuals), with benefits within and beyond the boundaries of individual farms.
Supplementary material
To view supplementary material for this article, please visit https://doi.org/10.1017/wsc.2025.10019
Data availability
The raw data, reference genome, bam files, genotype files, and scripts can be found at The University of Queensland (UQ) espace doi: https://doi.org/10.48610/ac1b1c7 (Hereward Reference Hereward2025).
Acknowledgments
We would like to acknowledge Iva Quarisa, Tanja Morgan, and Michael Moodie for their hard work collecting samples for this study and the collaboration of members of the IREC and Mallee Sustainable Farming organizations.
Funding statement
This project was funded through the Australian Government’s Rural R&D for Profit program, GRDC, and CRDC, with additional support from CSIRO, AgriFutures, Universities of Queensland, Adelaide, and Wollongong, Mallee Sustainable Farming, Millmerran Landcare Group, and IREC Inc.
Competing interests
The authors declare no conflicts of interest.


 Open access

