


1. Introduction
1.1. Context and motivation
Rising gas bubbles in liquid are ubiquitous in environmental and engineering applications. Typical examples are bubbles in sparking wine fizzing up, bubble column reactors (Risso Reference Risso2018; Mathai, Lohse & Sun Reference Mathai, Lohse and Sun2020; Ni Reference Ni2024), bubble curtains (Beelen & Krug Reference Beelen and Krug2024) and air bubbles entrained in ocean water through breaking waves (Deike Reference Deike2022; Mostert, Popinet & Deike Reference Mostert, Popinet and Deike2022). Bubbles control the mass transfer between the gas and liquid phases due to either the large interface area created by submerged bubbles or their collapse at depth (Deike & Melville Reference Deike and Melville2018). Many of the flows surrounding gas bubbles are turbulent, so that knowing how turbulence affects the bubble dynamics is important to model bubble-mediated mass and energy transfer (Risso Reference Risso2018; Deike Reference Deike2022; Farsoiya et al. Reference Farsoiya, Magdelaine, Antkowiak, Popinet and Deike2023b).
Before discussing the effects of turbulence, we briefly summarise the dynamics of a bubble rising in a quiescent medium. The problem can be described as a gas bubble of diameter  $d$ rising in a quiescent liquid medium, characterised by terminal rising speed $w_b$, viscosity $\mu _l$, density $\rho _l$, surface tension $\sigma$ and gravity $g$. A bubble rising in a still liquid follows a straight vertical line and switches to a zigzag or helical trajectory after exceeding a critical set of parameters, i.e. Galileo number $Ga=\rho _l \sqrt {g d} d / \mu _l$ and Bond number $Bo=\rho _l g d^2 / \sigma$, which describe the ratio of inertial to viscous forces and the ratio of buoyancy forces to capillary forces, respectively. Note that the onset of this path instability of zigzag or helical trajectory can happen before the wake instability, which reflects that the mechanism of the path instability can be linked to purely the coupling between the dynamics of the bubble and the liquid through the interfacial boundary conditions (Mougin & Magnaudet Reference Mougin and Magnaudet2001; Ern et al. Reference Ern, Risso, Fabre and Magnaudet2012; Cano-Lozano, Bohorquez & Martínez-Bazán Reference Cano-Lozano, Bohorquez and Martínez-Bazán2013; Tchoufag, Fabre & Magnaudet Reference Tchoufag, Fabre and Magnaudet2014; Cano-Lozano et al. Reference Cano-Lozano, Martinez-Bazan, Magnaudet and Tchoufag2016; Will et al. Reference Will, Mathai, Huisman, Lohse, Sun and Krug2021; Bonnefis et al. Reference Bonnefis, Sierra-Ausin, Fabre and Magnaudet2024).
The terminal rise velocity of a bubble in a quiescent medium is determined by the balance between the buoyancy and drag force, and is written as  $w_b=\sqrt {4 d g /(3 C_d)}$, where $C_d$ is the drag coefficient. The drag force is viscous or inertial depending on the quiescent bubble Reynolds number $Re_q= {\rho _l w_b d}/{\mu _l}$. Increasing the size of a gas bubble in a specific liquid leads to an increase in the $Re_q$, which by itself is known to reduce the drag coefficient $C_d$ for a bubble of spherical shape (Moore Reference Moore1963). However, if a bubble transits to an ellipsoid, the resultant expansion in the frontal area and increased likelihood of wake separation will cause an increase in the drag coefficient $C_d$ for a given $Re_q$ (Clift, Grace & Weber Reference Clift, Grace and Weber2005). Combining the effects of the reduction in drag coefficient $C_d$ with increasing Reynolds number $Re_q$ for spherical bubbles and the increase in $C_d$ due to the transition to an ellipsoidal shape will lead to first a decrease and then an increase in the drag coefficient $C_d$. This transition happens at different $Re_q$ values for different liquid properties (Loth Reference Loth2008; Cano-Lozano et al. Reference Cano-Lozano, Martinez-Bazan, Magnaudet and Tchoufag2016). Semi-empirical formulae have been proposed to describe the rise velocity, expressed as the drag coefficient being a function of controlling parameters, the bubble Reynolds number and a non-dimensional number including gravity and surface tension, either the Bond or Morton number (Clift et al. Reference Clift, Grace and Weber2005; Loth Reference Loth2008). Separately, the terminal velocity is also affected by surface contamination through immobilisation of the bubble surface (Magnaudet & Eames Reference Magnaudet and Eames2000; Farsoiya et al. Reference Farsoiya, Popinet, Stone and Deike2024).
Turbulence has been demonstrated to affect the mean rise velocity for bubbles with sizes smaller than the Kolmogorov microscale, by altering the sampling positions of the bubble in the turbulent flow, with preferential concentration in vortex centre or downward flows (Mathai et al. Reference Mathai, Lohse and Sun2020). The preferential sampling is interpreted as occurring due to two mechanisms, vortex trapping and lift force. Vortex trapping reduces the rise velocity of a bubble by preferentially driving and keeping the bubble to the core of the vortices under pressure gradients. The velocity reduction in the rise velocity is maximised, up to  $35\,\%$ (Spelt & Biesheuvel Reference Spelt and Biesheuvel1997; Poorte & Biesheuvel Reference Poorte and Biesheuvel2002), when the Stokes number $St\sim 1$, which evaluates the ratio of the viscous response time of the bubble to the flow change $\tau _b$ to the Kolmogorov timescale $\tau _{\eta }$ (Mazzitelli & Lohse Reference Mazzitelli and Lohse2004; Calzavarini et al. Reference Calzavarini, Kerscher, Lohse and Toschi2008; Aliseda & Lasheras Reference Aliseda and Lasheras2011). This mechanism works efficiently for small bubbles with diameter $d$ comparable to the Kolmogorov length scale $\eta$, as $St \equiv \tau _b/\tau _{\eta } = \rho _ld^2 / 36 \mu _l \tau _\eta = 1/36(d/\eta )^2$. Bubbles with $St \ll 1$ immediately respond to the velocity change of the surrounding flow and behave like fluid tracers, therefore exhibiting no preferential sampling in the flow, whereas bubbles with $St \gg 1$ have high inertia, meaning they tend to maintain their rise motion and move through the vortex. Lift force reduces the rise velocity by moving an uprising bubble horizontally towards the downward flow side of the vortex (Mazzitelli, Lohse & Toschi Reference Mazzitelli, Lohse and Toschi2003; Salibindla et al. Reference Salibindla, Masuk, Tan and Ni2020; Masuk, Salibindla & Ni Reference Masuk, Salibindla and Ni2021). The influence of lift force is shown to be effective for weak turbulent perturbation of the bubble trajectory ( $Fr \lesssim 0.5$, with $Fr=u'/\sqrt {gd}$, $u'$ the root-mean-square velocity) but ceases to be dominant as $Fr \gtrsim 0.5$ (Spelt & Biesheuvel Reference Spelt and Biesheuvel1997; Ruth et al. Reference Ruth, Vernet, Perrard and Deike2021), with the inclusion of the lift force in the point bubble simulation results in only a marginal reduction in the rise velocity (Snyder et al. Reference Snyder, Knio, Katz, Le and Olivier2007; Ruth et al. Reference Ruth, Vernet, Perrard and Deike2021).
Nonlinear drag has been shown to be a significant factor affecting the rise velocity of larger bubbles, with sizes in the inertial subrange of the turbulence, through the combined effects of the nonlinear drag–velocity relationship (coupling the velocity components) and the turbulence-induced fluctuations in the bubble velocity (Ruth et al. Reference Ruth, Vernet, Perrard and Deike2021). For particle Reynolds number  $Re_p=|\boldsymbol {U}_s|d/\nu _l\ll 1$, where $\boldsymbol {U}_s=\tilde {\boldsymbol {u}}_b-\boldsymbol {u}$ is the slip velocity of the particle (or bubble $\tilde {\boldsymbol {u}}_b$) relative to the surrounding flow $\boldsymbol {u}$, the drag force is dominated by the viscosity and varies linearly with the slip velocity. However, as the Reynolds number increases beyond the Stokes flow regime $Re_p>1$, the drag–velocity relationship starts to become nonlinear, with drag varying as the square of the slip velocity when inertial forces dominate (Loth Reference Loth2008). Experiments show that, under the nonlinear drag regime, the reduction in rise velocity increases in magnitude with increasing turbulence intensity, for both large air bubbles with $Re_p\in [60, 2000]$ (Prakash et al. Reference Prakash, Tagawa, Calzavarini, Mercado, Toschi, Lohse and Sun2012; Ruth et al. Reference Ruth, Vernet, Perrard and Deike2021) and light solid particles with $Re_p\in [10, 80]$ (Kawanisi, Nielsen & Zeng Reference Kawanisi, Nielsen and Zeng1999). The phenomenological model proposed in Ruth et al. (Reference Ruth, Vernet, Perrard and Deike2021) introduced a nonlinear drag $\boldsymbol {F}_d\propto -|\boldsymbol {U}_s|\boldsymbol {U}_s$ that reflects the nonlinear drag–velocity relationship and couples the dynamics between the vertical and the horizontal motions. Consequently, velocity fluctuations in both horizontal and vertical directions increase the time-averaged drag along the vertical motion, slowing down the bubble rises and leading to the scaling $\tilde {w}_b/w_b\propto 1/Fr$. Although preferential sampling has been observed for sub-Kolmogorov bubbles with Stokes number of order unity, nonlinear drag applies to bubbles of sizes within the inertial subrange.
Direct numerical simulations (DNS) with a fully resolved treatment of the interaction between turbulence and deformable bubbles remain limited. Loisy & Naso (Reference Loisy and Naso2017) studied the rise of a deformable bubble of the size of the Taylor microscale,  $d=\lambda \approx 10\eta$, through isotropic turbulence ( $Re_{\lambda }=\rho _l\lambda u^{\prime } / \mu _l=30$) with DNS. The greatest reduction in rise velocity was found when $Fr=0.9$ among the three chosen values, $0.5$, $0.9$ and $1.6$. They interpreted the velocity reduction as an effect of preferential sampling but do not quantitatively characterise the link between preferential sampling and slowdown. Reichardt, Tryggvason & Sommerfeld (Reference Reichardt, Tryggvason and Sommerfeld2017) studied the rise of large bubbles in turbulence ( $Re_{\lambda }<10$) generated by applying a pseudo-spectral forcing method and revealed a reduction of the rise velocity up to $38\,\%$ at their maximum turbulence intensity $Fr=0.12$. Note that although most experimental and numerical studies report velocity reduction in turbulence, an increase in the rise speed in turbulence for air bubbles was discussed by Salibindla et al. (Reference Salibindla, Masuk, Tan and Ni2020) and for light droplets by Friedman & Katz (Reference Friedman and Katz2002).
Although most experiments indicate that turbulence typically reduces the speed at which bubbles rise, the occasional conflicting findings and interpretations found in the literature, along with the limited systematic DNS studies and comparison between quiescent and turbulent scenarios, underscore the motivation for this study. To what extent and how the turbulence influences the rise dynamics of bubbles with sizes within the turbulence inertial range remains debated. Compared with experiments, DNS allows for proper homogeneous and isotropic turbulence (HIT) with no vertical structure in the mean flow. Moreover, DNS allows simulations to be performed matching exactly the conditions between the quiescent and turbulent configurations, with direct access to the slip velocity in a fully coupled bubble–turbulence flow and the ability to systematically vary the deformability of the bubble at a fixed turbulence or bubble inertia non-dimensional number. This paper presents a DNS study of bubbles in the inertial subrange rising in HIT, focusing on the effects of the turbulence intensity and the bubble deformability. By systematically sweeping the relevant non-dimensional parameters, we demonstrate that the rise velocity reduction in turbulence  $\tilde {w}_b/w_b$ can be described mainly as a function of the Froude number.
1.2. Dimensional analysis
We consider a gas bubble of diameter  $d$, viscosity $\mu _b$ and density $\rho _b$ rising in a quiescent liquid medium, characterised by a terminal rising speed $w_b$, viscosity $\mu _l$, density $\rho _l$, surface tension $\sigma$ and gravity $g$. The problem can be defined by five non-dimensional groups. We consider low ratios of viscosity $\mu _b/\mu _l \ll 1$ and density $\rho _b/\rho _l \ll 1$, so that the terminal rise velocity can be written as
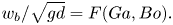 \begin{equation} {w_b}/{\sqrt{gd}} = F(Ga, Bo). \end{equation}
Here the Galileo number  $Ga = {\rho _l \sqrt {gd}\,d}/{\mu _l}$ represents the relative importance of buoyancy and viscous forces. The Galileo number is linked to the quiescent bubble Reynolds number, with the former using an estimated rise speed $\sqrt {gd}$ and the latter using the actual rise speed $w_b$ as the characteristic speed. The Bond number $Bo = {\rho _l g d^2}/{\sigma }$ evaluates the relative importance of buoyancy forces and surface tension and should account for bubble deformability due to buoyancy.
Alternatively, another set of dimensionless numbers can be chosen, which will be used when comparing our DNS results with experiments and semi-empirical formulae (Loth Reference Loth2008) for quiescent rising velocity. The three independent dimensionless numbers to describe the rise dynamics in quiescent flow can be chosen as the drag coefficient  $C_d = {4dg}/{3w_b^2}$, the quiescent bubble Reynolds number $Re_q = {\rho _l w_b d}/{\mu _l}$ and the Morton number $Mo = {g\mu _l^4}/{\rho _l\sigma ^3}$, which lacks a direct physical interpretation but is conveniently used to compare liquid properties in experiments.
Turning to a bubble rising in turbulence, two more quantities are introduced to describe HIT, the root mean square of the velocity fluctuations  $u'$ and the Taylor microscale $\lambda$ (Perrard et al. Reference Perrard, Rivière, Mostert and Deike2021; Ruth et al. Reference Ruth, Vernet, Perrard and Deike2021), introducing two non-dimensional variables that characterise the bubble interacting with the turbulent flow. We consider the Froude number $Fr=u'/\sqrt {gd}$, which describes the turbulence intensity as the ratio between a typical turbulent fluctuation velocity $u'$ and a typical quiescent rising speed; and a non-dimensional bubble size $d^* = d /\lambda$ which describes whether the bubble is in the inertial or viscous subrange. The velocity reduction in turbulence can then be expressed as
 \begin{equation} {\tilde{w}_b}/w_b = H(Ga, Bo, Fr, d^*). \end{equation}
 Alternative non-dimensional numbers can be considered to understand the problem from different perspectives, and various interchangeable dimensional parameters can be formulated and will be related to those chosen in (1.2). In particular, the turbulence is usually characterised by a Reynolds number. The Reynolds number based on the Taylor microscale can be written as  $Re_{\lambda }=\rho _l\lambda u'/\mu _l$ and is related to $Ga$,
$Ga$,  $Fr$ and $d^*$ by $Re_{\lambda }=Ga\,Fr/d^*$. The turbulent Weber number for bubble diameter within the inertial subrange, $We=\epsilon ^{2 / 3} d^{5 / 3} /(\sigma / \rho _l)$, gives the ratio between the turbulent inertial stresses and the Laplace pressure from surface tension. With the dissipation rate being $\epsilon =15\mu _lu'^2/\rho _l\lambda ^2$, the Weber number can be written as $We=(15\mu _lu'^2/\rho _l\lambda ^2)^{2 / 3} d^{5 / 3} /(\sigma / \rho _l)=6.1Bo\,Ga^{-2/3}(Fr\,d^*)^{4/3}$, accounting for bubble deformation due to turbulence. The Weber number $We$ indicates whether the bubble might break in the turbulent flow, and we here consider stable bubbles, with a $We$ number below a critical value (see Rivière et al. Reference Rivière, Mostert, Perrard and Deike2021).
The Stokes number describes the ratio of the viscous response time of a bubble to changes in the flow field to the Kolmogorov time scale of the flow, and for small bubbles can be written as  $St \equiv \rho _ld^2 / 36 \mu _l \tau _\eta = 1/36(d/\eta )^2 = 0.11 Ga\,Fr\,d^*$. Using this definition, for most of the bubbles with sizes within the inertial subrange in our simulations, the Stokes number is around 10, which implies that the bubble has significant inertia compared with the viscous force of the surrounding flow. As eluded to in the introduction, preferential sampling in both vortex centre and downward flows is important for sub-Kolmogorov bubbles with $d^*\approx \eta /\lambda \ll 1$ and $St\sim 1$, whereas we consider bubbles within the inertial subrange ( $0.5< d^*<3$, $St\approx 10$). We recently proposed that for large bubbles, with large $St$ and sizes within the inertial subrange, inspired by experimental data from Ruth et al. (Reference Ruth, Vernet, Perrard and Deike2021), preferential sampling is not effective and that the observed slowdown can actually be modelled by a nonlinear drag effect. Although the Stokes number is traditionally useful for bubbles near the Kolmogorov length scale $\eta$, its definition becomes ambiguous for large, finite-size bubbles in the inertial subrange due to different response times and flow time scales. The above classical definition assumes point-like bubbles and low Reynolds numbers, which does not hold for our case. Corrections, as discussed in Homann & Bec (Reference Homann and Bec2010), Gibert, Xu & Bodenschatz (Reference Gibert, Xu and Bodenschatz2012) and Mathai et al. (Reference Mathai, Calzavarini, Brons, Sun and Lohse2016), account for finite size and Reynolds number effects, which would lower our estimated Stokes number. Given this ambiguity, we suggest that the non-dimensional numbers $d^*$ and Froude number, which better capture the dynamics of large bubbles in turbulence, are more appropriate indicators for this system.
Here, we focus on the effects of bubble inertia (quantified by the  $Ga$ number) and buoyancy-induced bubble deformation (quantified by the $Bo$ number) on the quiescent rise dynamics and how turbulence with different intensities (quantified by the $Fr$ number) affect the rise dynamics. The effects of the bubble diameter $d^*$ are also tested and are demonstrated to be minor as long as the bubble is within the inertial subrange.
2. Approach
We perform three-dimensional DNS of a single gas bubble that is free to move and deform in a quiescent or turbulent liquid medium using the open-source software Basilisk (Popinet Reference Popinet2009, Reference Popinet2018). For each bubble rising in the turbulence case, there is a corresponding quiescent case with the same parameters except that the surrounding flow is initially set to be quiet instead of turbulent.
A fully resolved treatment of the interaction between the surrounding flow and the bubble is achieved by directly solving the two-phase, incompressible Navier–Stokes equations. The incompressible Navier–Stokes equations are solved in both phases, with appropriate interface conditions, including continuity of velocity and shear stress, and a jump in normal stress due to surface tension, through which the coupled force between the bubble and the fluid is resolved directly. A one-fluid formulation that combines the incompressible Navier–Stokes equations in both phases and interface conditions, with surface tension and gravity accounted, is solved with a momentum-conserving scheme. The interface is reconstructed by a sharp geometric volume of fluid method, and the domain is discretised by a spatial adaptive octree grid that saves computational time while resolving the different length scales of the problem. Details of the numerical methods are provided in previous studies, as well as validation of the accuracy of the solver for complex multiphase flow, including bubble deformation in turbulence (Perrard et al. Reference Perrard, Rivière, Mostert and Deike2021), bubble and drop breakup in turbulence (Rivière et al. Reference Rivière, Mostert, Perrard and Deike2021, Reference Rivière, Ruth, Mostert, Deike and Perrard2022; Farsoiya et al. Reference Farsoiya, Liu, Daiss, Fox and Deike2023a), bubble gas transfer in turbulence (Farsoiya et al. Reference Farsoiya, Magdelaine, Antkowiak, Popinet and Deike2023b) and breaking waves (Mostert et al. Reference Mostert, Popinet and Deike2022).
In all simulations presented here, the density ratio is  $\rho _b/\rho _l = 1/850$ and the dynamical viscosity ratio $\mu _b/\mu _l = 1/25$, close to air and water conditions. We describe in the following the numerical configurations in quiescent and turbulent flows.
2.1. Bubble rise in a quiescent medium
A spherical bubble is placed in the domain with the ratio of the initial radius to the box size 0.067 (or 0.033) and the volume ratio 0.0012 (or 0.00016). The domain is discretised by an adaptive mesh grid with a concentration of grid cells at the interface and in the near wake. The maximum refinement level of the adaptive mesh grid, denoted as  $L$, determines the smallest grid size in the domain, allowing us to compare with a fixed grid size equivalent to $(2^L)^3$ grid points. The level of refinement around the interface is $L=9$ or $10$, with at least 68 points across the initial bubble diameter and we have verified grid convergence in the mean rise velocity in quiescent and turbulent flows (see Appendix A).
The flow in both phases is initially set to zero. We analyse the bubble rise dynamics due to the buoyancy and extract the drag coefficient based on the grid-converged terminal rise speed, which is verified against experimental results and semi-empirical relationship (Loth Reference Loth2008) as described in the following.
2.2. Bubble rise in turbulence
The simulations of bubble rise in turbulence are performed in two steps, with the creation of the turbulent flow and then insertion of the bubble, following Perrard et al. (Reference Perrard, Rivière, Mostert and Deike2021), Rivière et al. (Reference Rivière, Mostert, Perrard and Deike2021), Farsoiya, Popinet & Deike (Reference Farsoiya, Popinet and Deike2021) and Farsoiya et al. (Reference Farsoiya, Liu, Daiss, Fox and Deike2023a,Reference Farsoiya, Magdelaine, Antkowiak, Popinet and Deikeb). The turbulence is generated by a volumetric force that is locally proportional to the velocity at every point of the real space in the liquid phase. Rosales & Meneveau (Reference Rosales and Meneveau2005) have demonstrated that this approach results in a turbulent field that exhibits statistics comparable to those achieved using a spectral code, and leads to a well-characterised homogeneous isotropic turbulent flow. The evolution of turbulence statistics, including kinetic energy, dissipation rate and turbulent Reynolds number  $Re_\lambda$, are monitored until reaching a statistically stationary regime. The second-order structure functions exhibit a well-defined inertial range, aligning with HIT scaling found in the literature, as verified in Perrard et al. (Reference Perrard, Rivière, Mostert and Deike2021), Rivière et al. (Reference Rivière, Mostert, Perrard and Deike2021) and Farsoiya et al. (Reference Farsoiya, Popinet and Deike2021, Reference Farsoiya, Liu, Daiss, Fox and Deike2023a,Reference Farsoiya, Magdelaine, Antkowiak, Popinet and Deikeb). This approach has been used to study bubble rising (Loisy & Naso Reference Loisy and Naso2017), bubble deformation (Perrard et al. Reference Perrard, Rivière, Mostert and Deike2021), breakup (Rivière et al. Reference Rivière, Mostert, Perrard and Deike2021; Farsoiya et al. Reference Farsoiya, Liu, Daiss, Fox and Deike2023a) and gas exchange (Farsoiya et al. Reference Farsoiya, Magdelaine, Antkowiak, Popinet and Deike2023b) in turbulence. A bubble is inserted after the turbulent stationary state is reached, and the flow in the inner phase is initially set to zero. Grid convergence on the instantaneous velocity signals and trajectories of the bubble is verified for individual realisations in Appendix A. For each turbulent run, the simulation is long enough with $\Delta t /\sqrt {d/g} \approx 100$ to ensure the statistical convergence of the mean rise speed. We have verified that the turbulence properties agree with the classic turbulence results (Pope Reference Pope2000) and are not changed significantly by the inserted bubble as the gas–liquid volume ratio is small, see Appendix B, therefore validating our approach to study drops and bubbles in homogeneous and isotropic flow in the presence of gravity.
2.3. Parameter space and validation of the quiescent bubble rise configuration
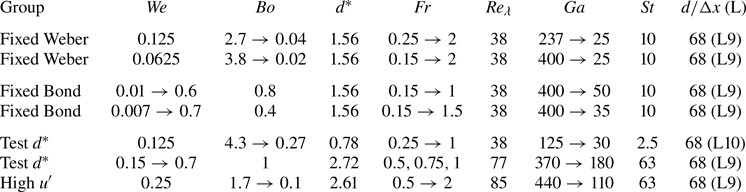
The simulation parameters are summarised in table 1. We consider a bubble rising in a quiescent medium for a wide range of bubble inertia  $Ga \in [25, 440]$ and deformability $Bo \in [0.02,4.3]$. The parameter space considered in terms of $Ga$ and $Bo$ spans various types of trajectories, from straight paths to unstable helicoidal or zigzag paths (Cano-Lozano et al. Reference Cano-Lozano, Martinez-Bazan, Magnaudet and Tchoufag2016). Bubbles rising under a wide range of turbulence intensity with $Fr$ varying between $0.15$ and $2$, are systematically compared with their corresponding quiescent case $Fr=0$. When varying $Fr$, one of the two groups characterising deformation, $We$ or $Bo$, is kept constant, whereas the other is varying over two orders of magnitude. All simulations are at $Bo$ and $We$ below breakup threshold. The bubbles considered in this study are bubbles with sizes within the inertial subrange $d^*=d/\lambda =O(1)$, with the majority being $d^*=1.56$. We test the effects of bubble size $d^*$ by considering $d^*=0.78$ and $2.72$ by changing the bubble diameter $d$ and the length scales of the turbulence $Re_\lambda$, in particular the Taylor microscale $\lambda$.
Parameters of the simulations of bubble rising in turbulence with various  $We$,
$We$,  $Bo$,
$Bo$,  $d^*$, $Fr$,
$Fr$,  $Re_{\lambda }$, $Ga$,
$Ga$,  $St$, the initial drop-to-grid-size ratio $d/\Delta x$ and maximum refinement level $L$.
$L$.
The typical number of grid points at  $L=9$ is approximately 500 000, compared with an equivalent $\approx$134 million uniform grid points, representing a reduction by a factor of about 200 in the number of grid points. The reduction of the number of grid points thanks to the adaptive mesh grid is central to achieving a large parameter sweep, together with the high resolution on the interface. There is a minimum of three grid points within the boundary layer, characterised by a thickness $\delta = d/\sqrt {Ga}$, and the Kolmogorov length scale $\eta$ is well-resolved with at least four grid points. As discussed in more details in the following, studying mean rise velocity in turbulent conditions require relatively long simulations to achieve a well-defined statistically stationary terminal rise velocity. A typical simulation in quiescent conditions uses 80 cores for a total of 16 000 CPU hours and, in turbulence conditions, uses 120 cores and 24 000 CPU hours. The total computational cost of the present study is 1 680 000 CPU hours.
We start by presenting a brief analysis of the bubbles rising in a quiescent medium, and validate our results against the experimental and theoretical work in the literature. We discuss the rising trajectory and rise speed of a bubble in a quiescent medium. Figure 1(a,b) shows the velocity signals and trajectories of two typical cases of bubbles released from rest in quiescent flow. The instantaneous vertical component  $w_b(t)$ first accelerates driven by the buoyancy and then approaches a steady state value due to the force balance with the drag. The high $Ga$–
$Ga$– $Bo$ case shows significant oscillations both for the horizontal components and the vertical component of the velocity signal after the bubble gains enough rise speed, featuring a transition from the initial stable rectilinear trajectory to the unstable spiral trajectory. At the transition, the vertical speed of the bubble bottoms out when the horizontal speed peaks, which indicates the coupling between vertical and horizontal motions. In contrast, the low $Ga$–
$Ga$– $Bo$ case shows a vertical velocity signal gradually approaching the steady value and a consistent rectilinear trajectory.
Rise dynamics of a bubble in a quiescent medium. (a,b) Velocity components and trajectories of two typical cases of bubble rise in quiescent flow. The two chosen cases are indicated in the  $Ga$–
$Ga$– $Bo$ plot in (c) by the two asterisks with corresponding colours. (c) Randomness (colour coding) and path instability (symbol fillings) of bubble trajectories. Symbols represent DNS data, with filled being spiral or zigzagging trajectories and empty being recliner trajectories. The black solid line is the path instability onset curve from Cano-Lozano et al. (Reference Cano-Lozano, Bohorquez and Martínez-Bazán2013). The colour-coded trajectory randomness is characterised by the standard deviation of the horizontal speed of the bubble, i.e. $\sigma _h = \sqrt {\sigma _{u_b}^2+\sigma _{{v_b}}^2}$. (d) Colour-coded bubble rise speed in a quiescent medium. (e) Comparison of DNS and experimental fitting from Loth (Reference Loth2008). Drag coefficient as a function of the quiescent bubble Reynolds number, with the colour scale denoting the Morton number associated with different types of liquid. (f) Moving to turbulence, the turbulence intensity $Fr$ of the corresponding turbulent cases.
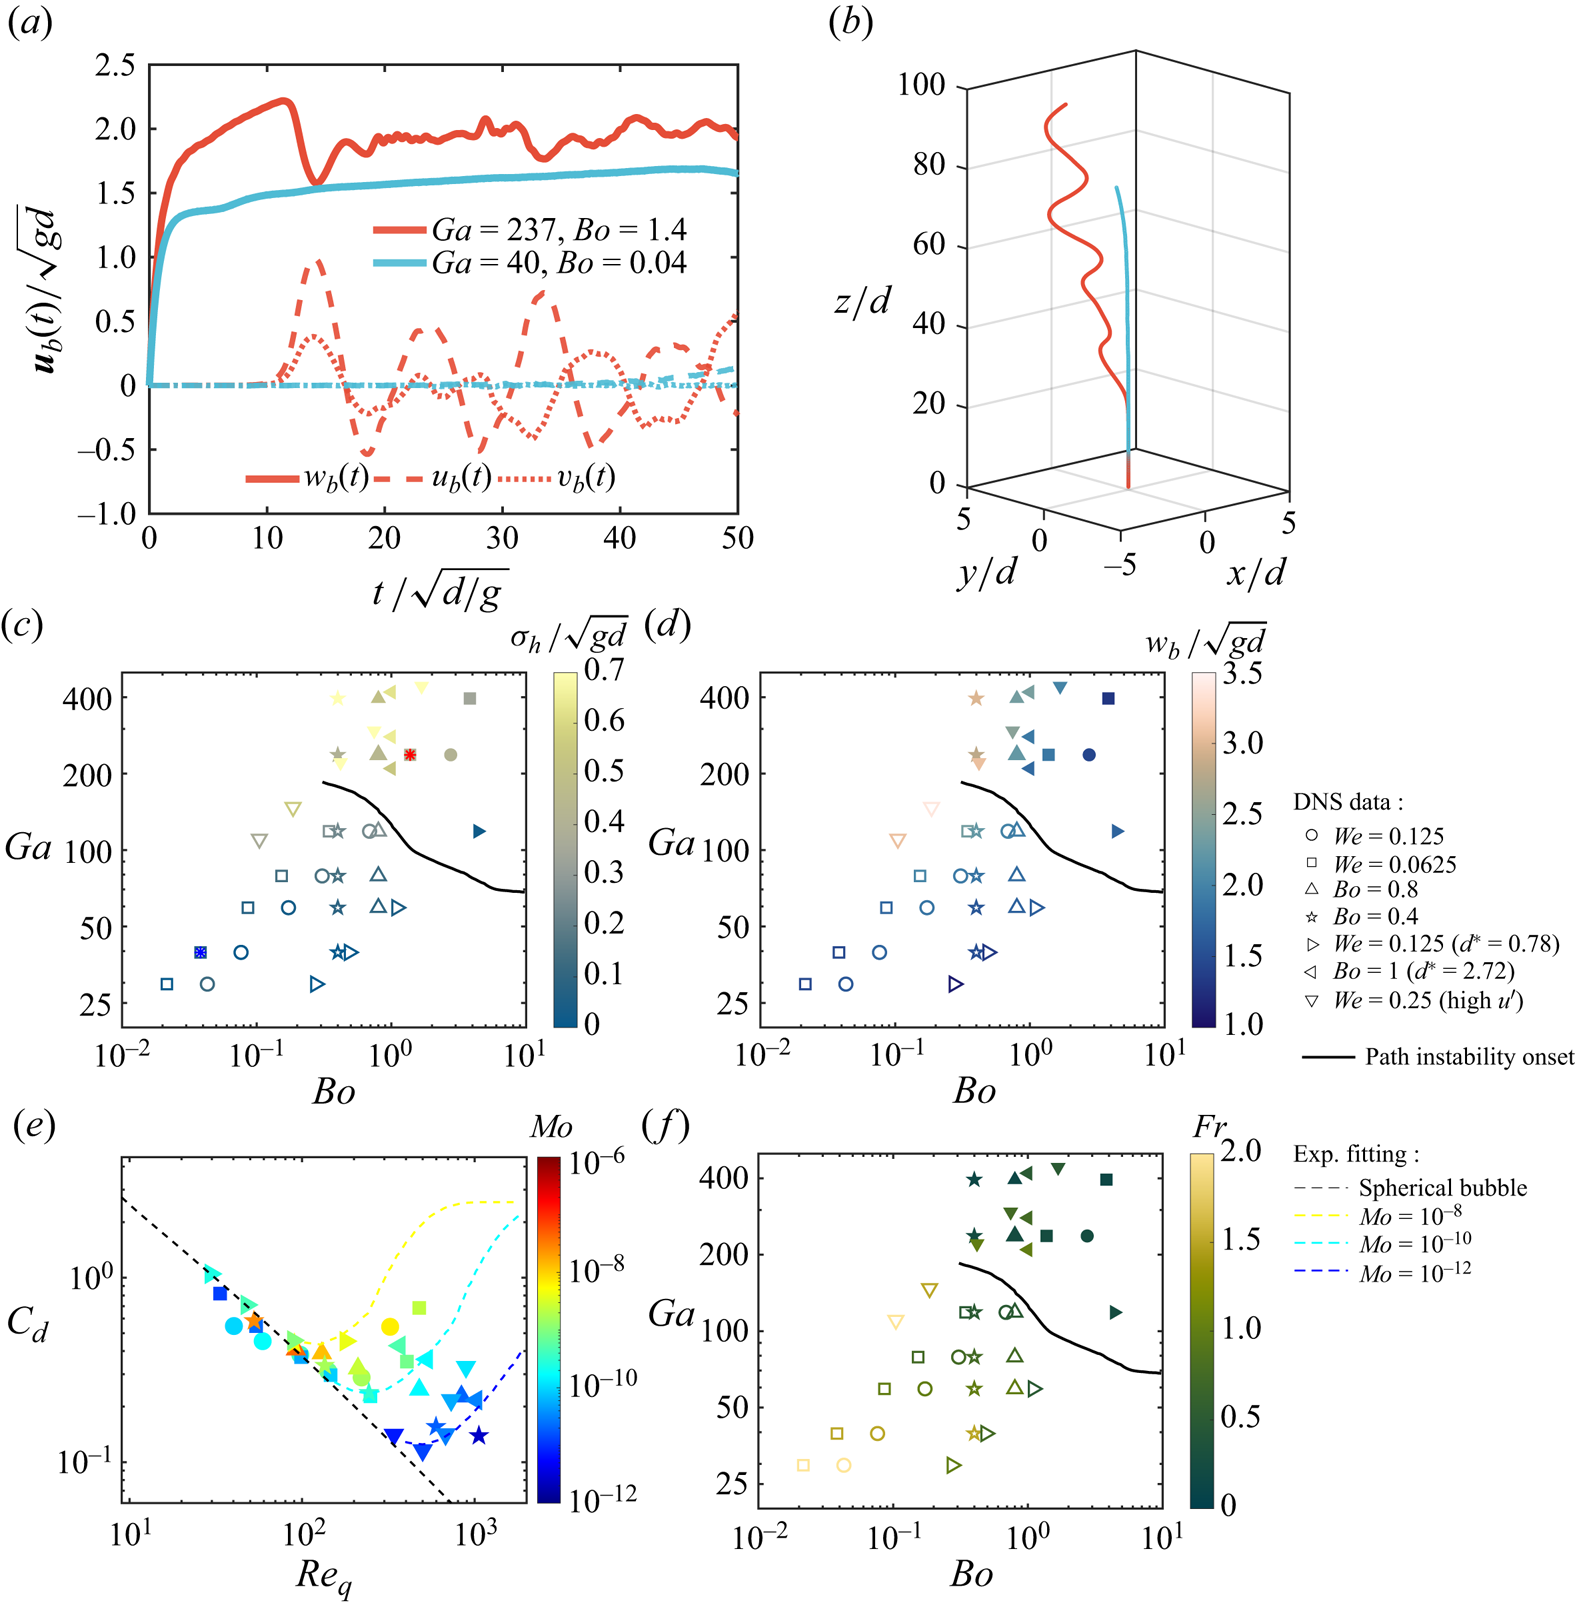
Figure 1(c) shows where our DNS are located in the  $Ga$–
$Ga$– $Bo$ phase diagram, together with the trajectory randomness (quantified by the standard deviation of the horizontal velocity normalised by $\sqrt {gd}$) colour coded. Whether the path is rectilinear or demonstrate path instability is indicated by the empty (stable) or filled (unstable) symbols. The path instability of our DNS data agrees well with the path instability onset curve from the numerical results of Cano-Lozano et al. (Reference Cano-Lozano, Bohorquez and Martínez-Bazán2013), which assumes a frozen deformed bubble shape. A bubble with stronger inertia $Ga$ and buoyancy-induced deformation $Bo$ is more likely to rise in a spiral or zigzagging trajectory. Although large bubble inertia is associated with unstable wakes behind the bubble, the path instability is observed at $Ga$ below the wake instability threshold, therefore pure dynamical coupling between the bubble and the surrounding fluid could cause the path instability (Cano-Lozano et al. Reference Cano-Lozano, Bohorquez and Martínez-Bazán2013; Tchoufag et al. Reference Tchoufag, Fabre and Magnaudet2014; Cano-Lozano et al. Reference Cano-Lozano, Martinez-Bazan, Magnaudet and Tchoufag2016; Bonnefis et al. Reference Bonnefis, Sierra-Ausin, Fabre and Magnaudet2024). Due to this coupling, flow disturbances affect bubble motion through the surface distributions of interfacial stresses, whereas the movements of the bubble influence the fluid motion via the boundary conditions at the bubble surface. There is an overall trend of larger trajectory randomness for cases in the phase map where trajectories become spiral or zigzagging.
Figure 1(d) summarises the terminal rise speed of a bubble rising in a quiescent medium. The terminal rise speed is averaged over a time window that is after the bubble speed saturates and contains enough oscillation periods for unstable cases (see Appendix A). Increasing the inertia  $Ga$ leads to an increase in the rise speed $w_b/\sqrt {gd}$ for a bubble of spherical shape. The deformation caused by the buoyancy $Bo$ transits the bubble shape from a sphere to an ellipsoid that creates a larger frontal area and helps induce wake separation, which increases the drag and thus slows down the bubble rising.
We compare the DNS results with the experimental fitting proposed by Loth (Reference Loth2008) in figure 1(e). To compare with Loth (Reference Loth2008), the problem is reformulated as the drag coefficient being a function of the quiescent bubble Reynolds at different liquid Morton numbers (colour coded). The range of the bubble Reynolds number in this study is between 20 and 1000. The DNS results are in good agreement with the fitting for clean spherical bubbles
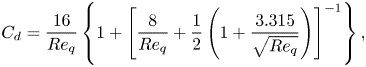 \begin{equation} C_d =\frac{16}{Re_q}\left\{1+\left[\frac{8}{Re_{q}}+\frac{1}{2}\left(1+\frac{3.315}{\sqrt{Re_{q}}}\right)\right]^{{-}1}\right\}, \end{equation}
and implicit semi-empirical formula for deformed bubbles at different Morton numbers (Loth Reference Loth2008).
Finally, figure 1(f) shows the turbulence intensity  $Fr$ of the corresponding turbulent cases, with matching parameters (in terms of $Ga$,
$Ga$,  $Bo$), with the only change being the surrounding flow.
3. Bubble rise dynamics in turbulence
We now qualitatively discuss the bubble rise dynamics in turbulence for varying controlling parameters. We first discuss the effect of increasing turbulence intensity at fixed ( $Ga$,
$Ga$,  $Bo$) numbers; then the effect of increasing deformability for various values of $Fr$ numbers; and, finally, discuss statistical properties of the rise velocity, slip velocity and sampled fluid velocity.
3.1. Effect of the turbulence intensity for fixed parameters
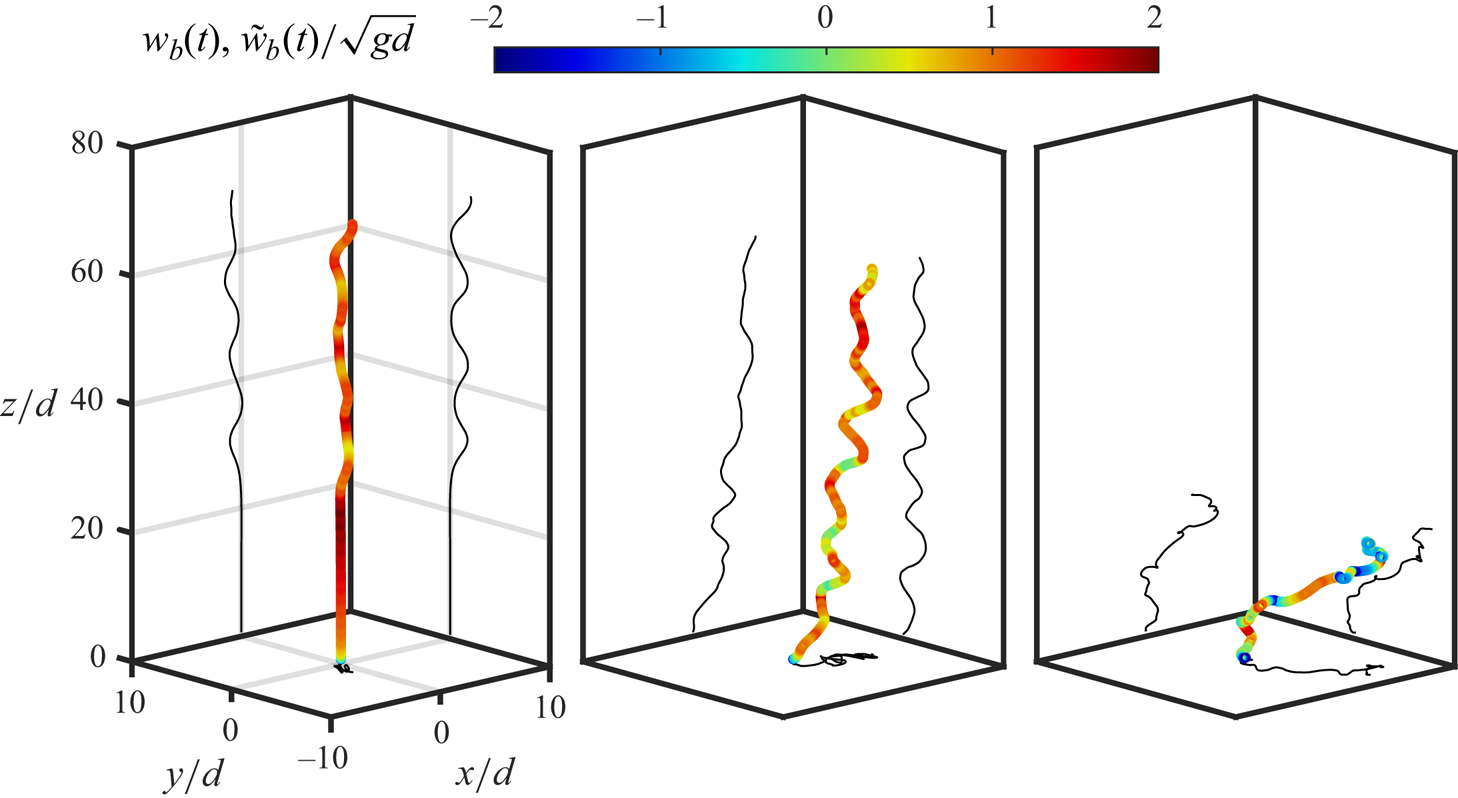
Figure 2 shows how increasing turbulence intensity impacts the rising trajectory and mean rise velocity for a given  $Ga$ and $Bo$ number. The trajectories are recorded over the same time, with the trajectories colour coded by the instantaneous rise speed and increasing turbulence intensity (left to right, $Fr$ from 0, 0.25 to 0.75). The chosen $Ga$ and $Bo$ values $Ga=237$ and $Bo=2.7$ lead to an unstable path in the quiescent configuration ( $Fr=0$) and a spiralling motion as seen in figure 2(a). Compared with the base quiescent case, turbulence introduces additional disturbances to the bubble trajectory, which transits the bubble trajectory to a spiralling mode at an earlier time for the lower turbulence intensity (figure 2b, middle panel, $Fr=0.25$). The horizontal oscillations keep a similar temporal frequency, although the turbulence amplifies the oscillation amplitude and introduces additional smaller high-frequency components. The vertical rise speed is reduced most when the bubble has a large horizontal motion as can be inferred from the colour coding of the spiralling trajectory. Moving to higher turbulence intensity ( $Fr=0.75$) randomises the rise speed and trajectory completely, and the memory of the quiescent oscillation frequency appears forgotten. Based on the rise distances, turbulence slows the bubble rise down, with higher intensity slowing down the bubble more.
Bubble rise trajectories in quiescent and increasing turbulence intensities  $Fr=0$, 0.25 and 0.75 for fixed $Ga=237$ and $Bo=2.7$. The instantaneous vertical speed is colour coded. Trajectories are shown over the same elapsed time $t/\sqrt {d/g}\in [0,47]$.
3.2. Effect of deformability for increasing turbulence intensity
We now discuss the effect of deformability and turbulence intensity on the rise dynamics. Figure 3 shows rising trajectories of bubbles in turbulence for increasing turbulence intensity from top to bottom (increasing  $Fr$ number) whereas deformability increases from left to right (increasing $Bo$ number). The trajectories are colour coded by the instantaneous vertical speed (normalised by the corresponding quiescent terminal rise speed).
Bubble rising trajectories for different turbulence intensity and deformation extent shown in a box of  $30d\times 30d\times 100d$. The colour code visualises the instantaneous bubble vertical velocity $\tilde {w}_b(t)$ in turbulence normalised by the terminal rising speed $w_b$ of the same bubble in the quiescent medium. All trajectories are recorded over the same time span with $\Delta t / \sqrt {d/g}=40$. The bubble shape at the end of each trajectory is displayed in the top left corner, enlarged for clarity. The projections of the trajectories are shown in horizontal and vertical planes. The Galileo numbers from top to bottom are 237, 79 and 40.
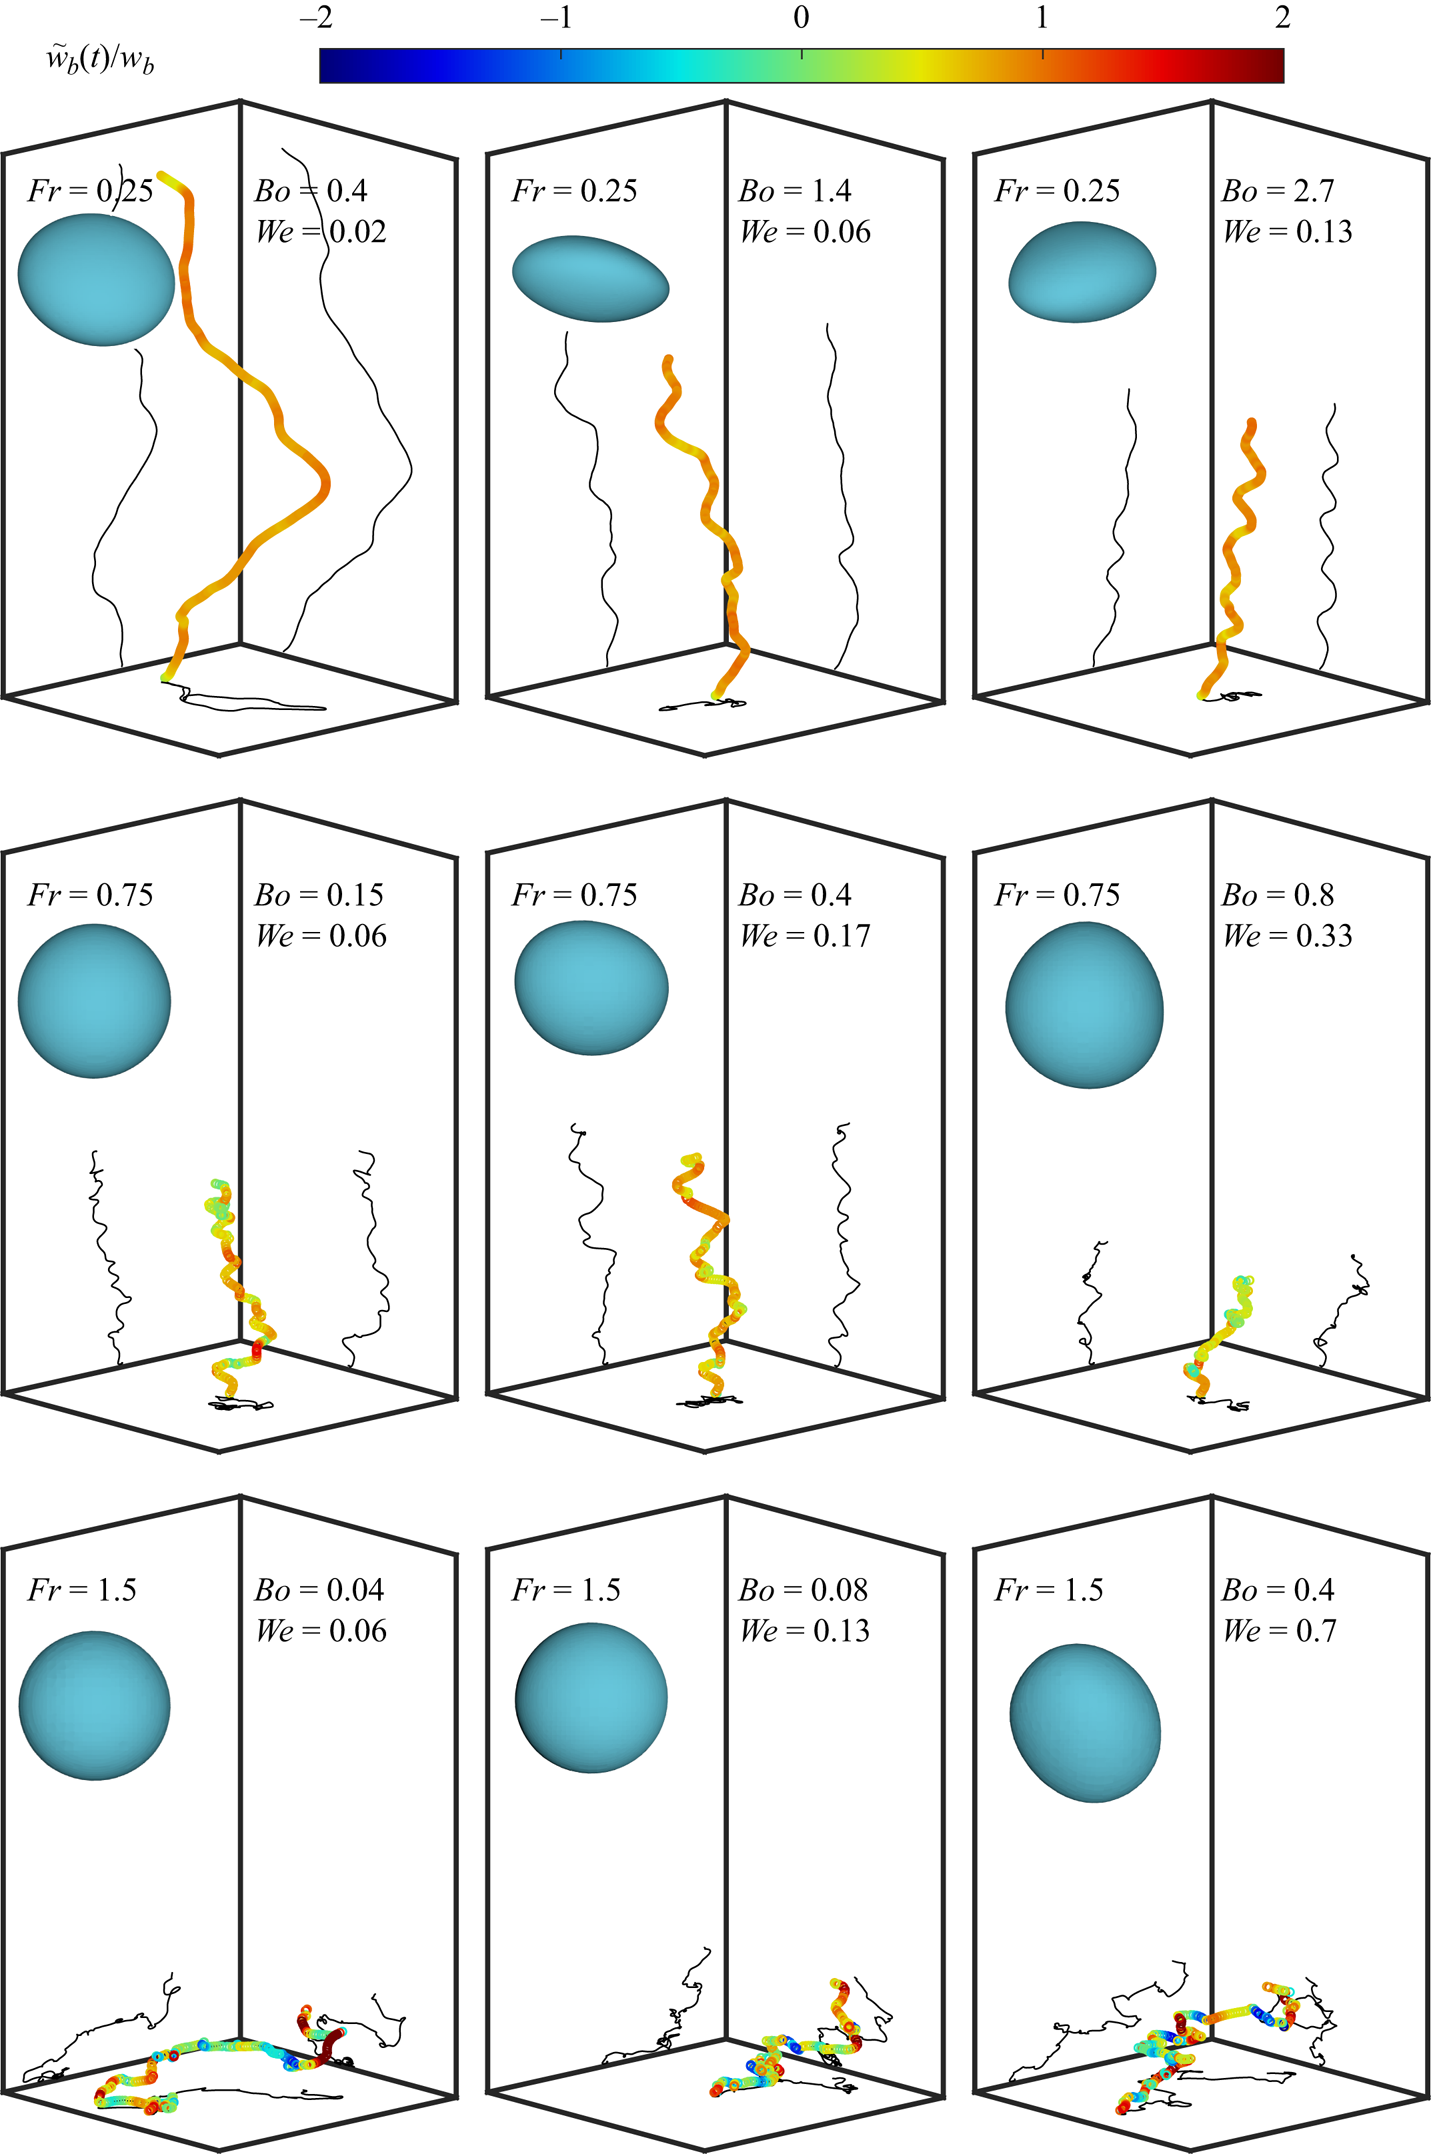
The top row shows the effect of increasing deformation at low turbulence intensity  $Fr=0.25$. Deformed bubbles rise slower according to the vertical distance travelled over the same amount of time. This slowdown can be attributed to the shape-dependent drag, which increases for disc-like bubbles occurring from buoyancy effects (large $Bo$). In other words, the absolute rising speed $\tilde {w}_b$ is reduced by the deformation extent.
The next two rows show the effect of increasing turbulence intensity, with  $Fr=0.75$ and $Fr=1.5$. As the turbulence intensity increases, the trajectories jiggle and even show overturning in the vertical direction. The rising speed in terms of absolute values $\tilde {w}_b$ and relative values $\tilde {w}_b/w_b$ are both reduced as reflected by the vertical distance travelled and more blue regions (negative normalised vertical velocity) colour coded in the trajectory, respectively. Remarkably, comparing the rows and the columns qualitatively, the relative rising speed $\tilde {w}_b/w_b$ appears to be dominated by the Froude Number rather than the Bond number.
3.3. Statistics of bubble rise velocity, sampled velocity and slip velocity
Figure 4(a) shows a typical velocity signal along the rising trajectory. The vertical component  $\tilde {w}_b(t)$ first accelerates and then fluctuates around a mean rise speed (which we have verified to be statistically converged as well as grid converged), as illustrated in Appendix A. The mean value of the horizontal components, $\tilde {u}_b(t)$ and $\tilde {v}_b(t)$, is zero, which shows the analysed signal is long enough to reach statistical convergence. Statistical convergence is typically reached for trajectories of $\Delta t \approx 100 \sqrt {d/g} \approx 2000\tau _\eta$. Note that a longer time is required to reach statistical convergence for large turbulence intensity $Fr$, which features large velocity fluctuations.
(a) Velocity signal of bubble rising in turbulence at  $Fr=0.75$, $Ga=79$, $Bo=0.3$ and $We=0.125$, with the solid lines being the instantaneous velocity components and the dashed lines being the mean values. (b) Trajectory randomness characterised by the standard deviation of the horizontal speed ( $\sigma _h = \sqrt {\sigma _{\tilde {u}}^2+\sigma _{\tilde {v}}^2}$), with the change between the turbulent and corresponding base quiescent case colour coded. The vertical speed of the bubble, sampled fluid, and the slip velocity at (c) $Fr=0.25$, $Ga=237$, $Bo=2.7$ and $We=0.125$ and (d) $Fr=0.75$, $Ga=79$, $Bo=0.3$ and $We=0.125$, and (e,f) their respective original histograms and smoothed probability density functions (smoothed with a moving average technique over each window).
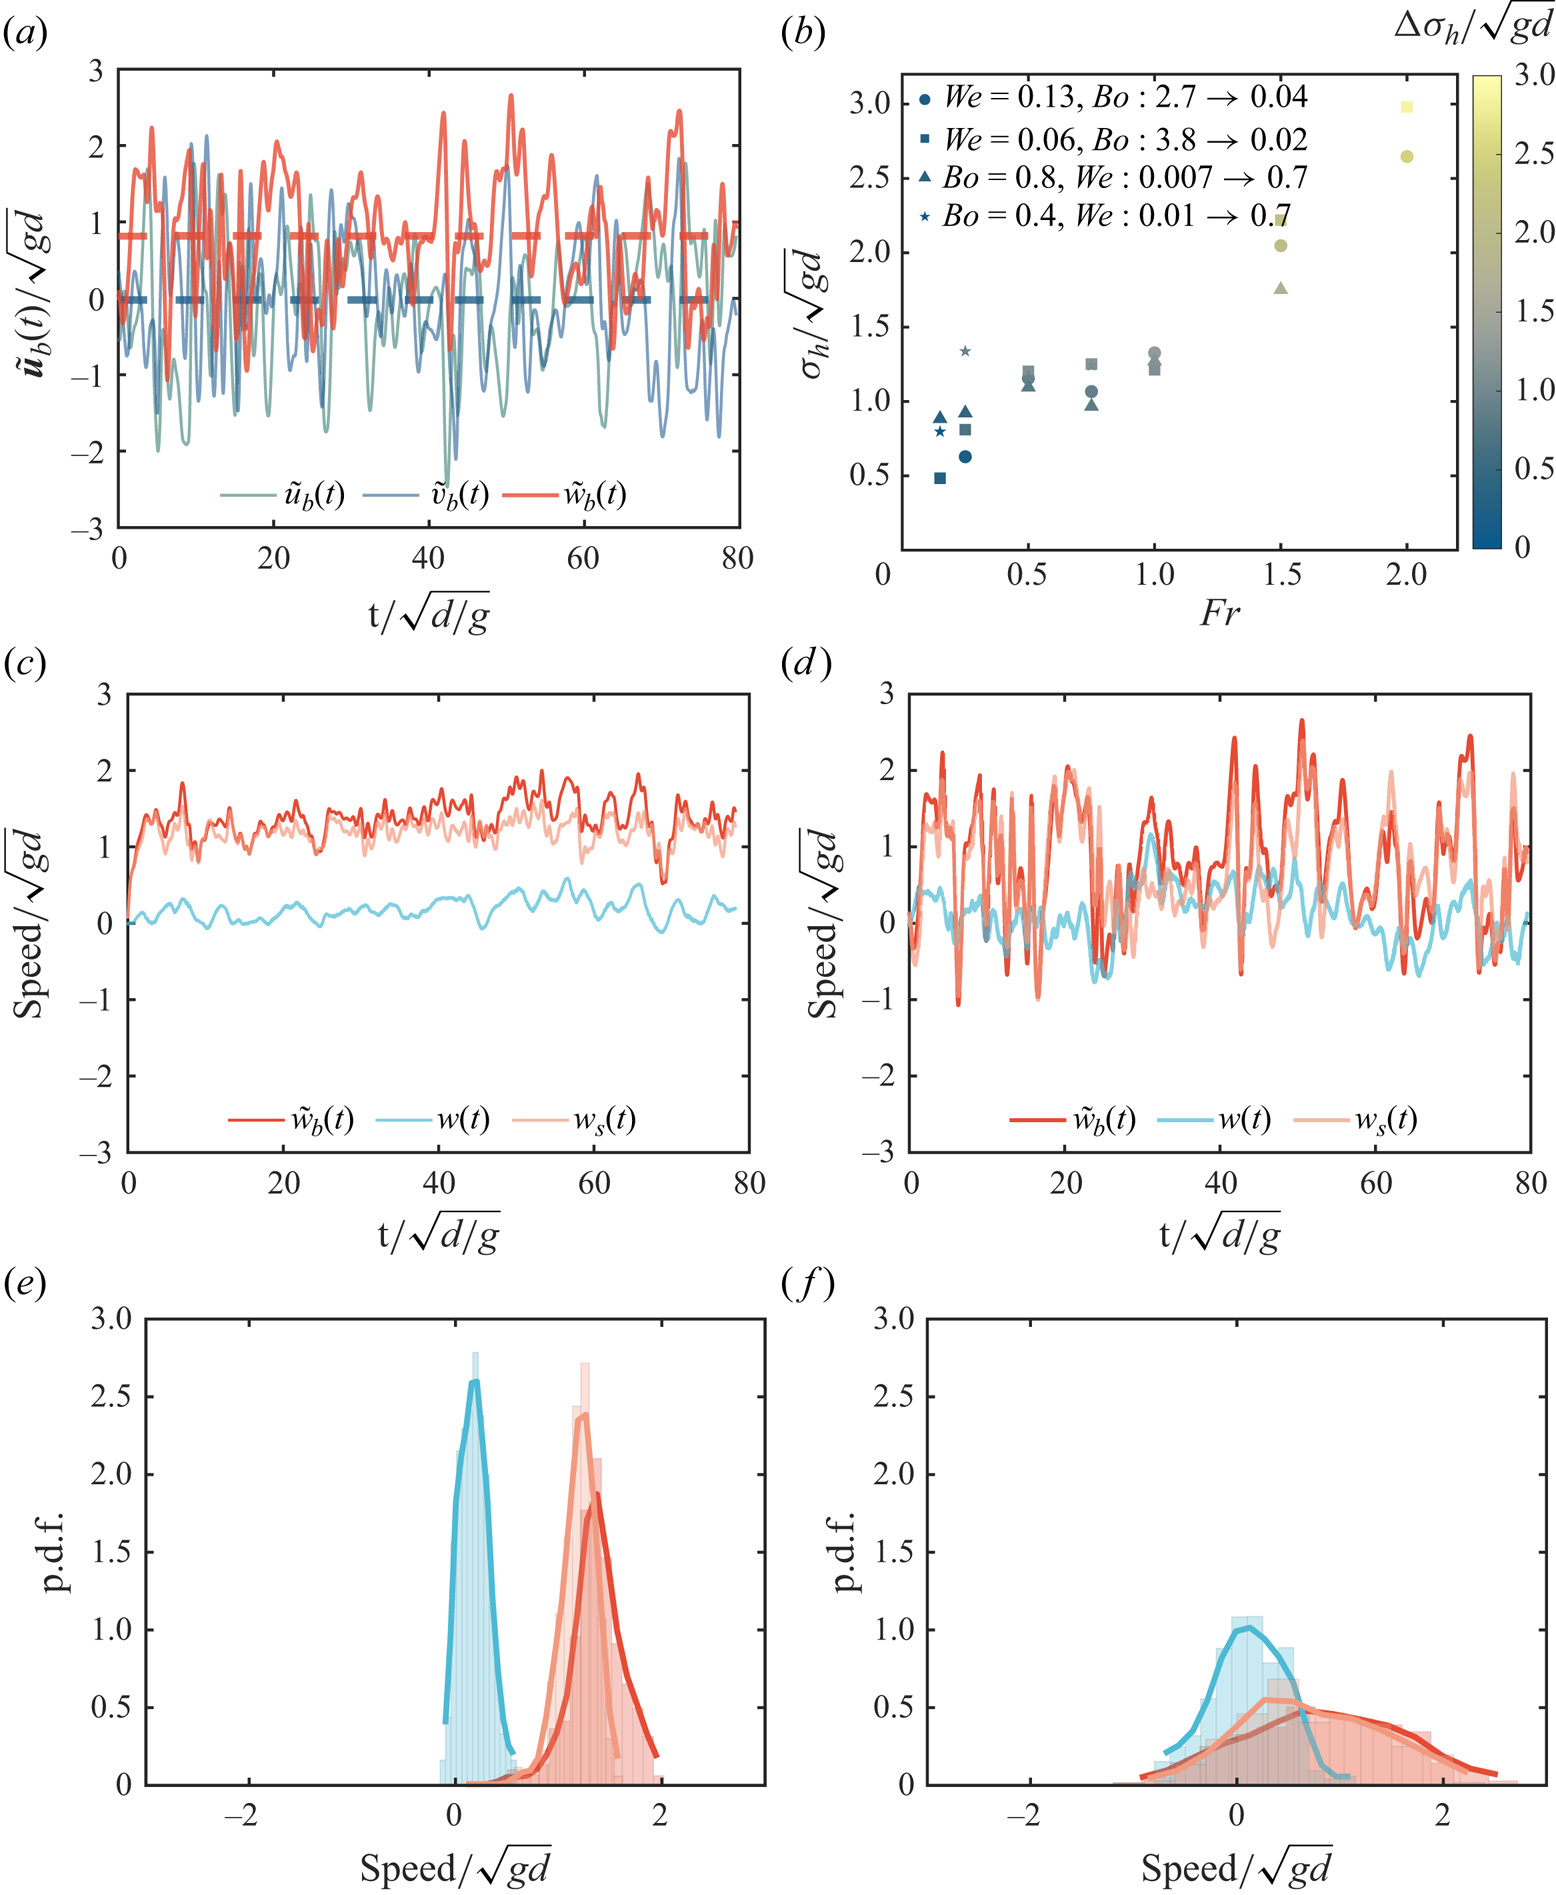
Figure 4(b) shows the trajectory randomness increasing with  $Fr$, with the randomness characterised by the standard deviation of the bubble velocity in the horizontal direction. Compared with the corresponding base quiescent case (colour coded), the change in randomness due to the turbulence is small at low $Fr$, with the majority of the randomness resulting from the path instability due to body–fluid coupling, whereas at high $Fr$ the randomness in trajectories is mainly from the turbulence-induced variations.
Figure 4(c–f) shows typical time signal and probability distributions of the vertical component of the bubble velocity, the velocity of the sampled fluid and the slip velocity at two turbulence intensities  $Fr=0.25$ and 0.75. The sampled velocity is calculated based on the mean flow velocity in a shell region surrounding the bubble. The region consists of a shell of liquid situated between two concentric spheres with differing diameters, both centred on the mass centre of the bubble. The sampled velocity is defined based on search diameter $1.5d< SD<2d$, where $d$ is the volume-equivalent bubble diameter. The slip velocity is the difference between the bubble velocity and sampled velocity. Different search diameters have been tested including smaller lower boundaries $1.2d< SD<1.5d$ and larger upper boundaries $2d< SD<3d$, which only show marginal influence on the sampled velocity and the slip velocity. All three velocity signals show larger fluctuations and broader distributions at higher turbulence intensity. In both cases, the mean sampled velocity remains much smaller than the bubble velocity and slip velocity, with the distributions of the vertical sampled velocity centred around a value near zero. The distributions of the slip velocity are centred around a value smaller than the bubble velocity. These distributions suggest that the reduction in rise velocity is not due to a preferential sampling effect.
4. Scaling the rise velocity
We now summarise the results on the bubble rise velocity reduction for all cases considered. Figure 5 shows the bubble relative rising speed in the DNS, as a function of the turbulence intensity ( $Fr$ number), for all deformation extent (colour coded by the $Bo$ number) and sizes (different symbols).
The relative rising speed as a function of the Froude number for DNS with various  $Bo$ and $We$ (coloured filled dots with $Bo$ colour coded), experiments of various $d^*$ (grey empty dots) and point-bubble simulations (grey crosses). The thicker lines show the $\tilde {w}_b/w_b = 1 -\chi \,Fr^2$ relation at low $Fr$ (Spelt & Biesheuvel Reference Spelt and Biesheuvel1997) and the $\tilde {w}_b/w_b=0.37/Fr$ scaling at high $Fr$ (Ruth et al. Reference Ruth, Vernet, Perrard and Deike2021). The inset shows the standard deviation of the vertical speed of the bubble in turbulence normalised by the corresponding quiescent speed. The vertical speed shows a decreasing mean value but an increasing fluctuation as $Fr$ increases.
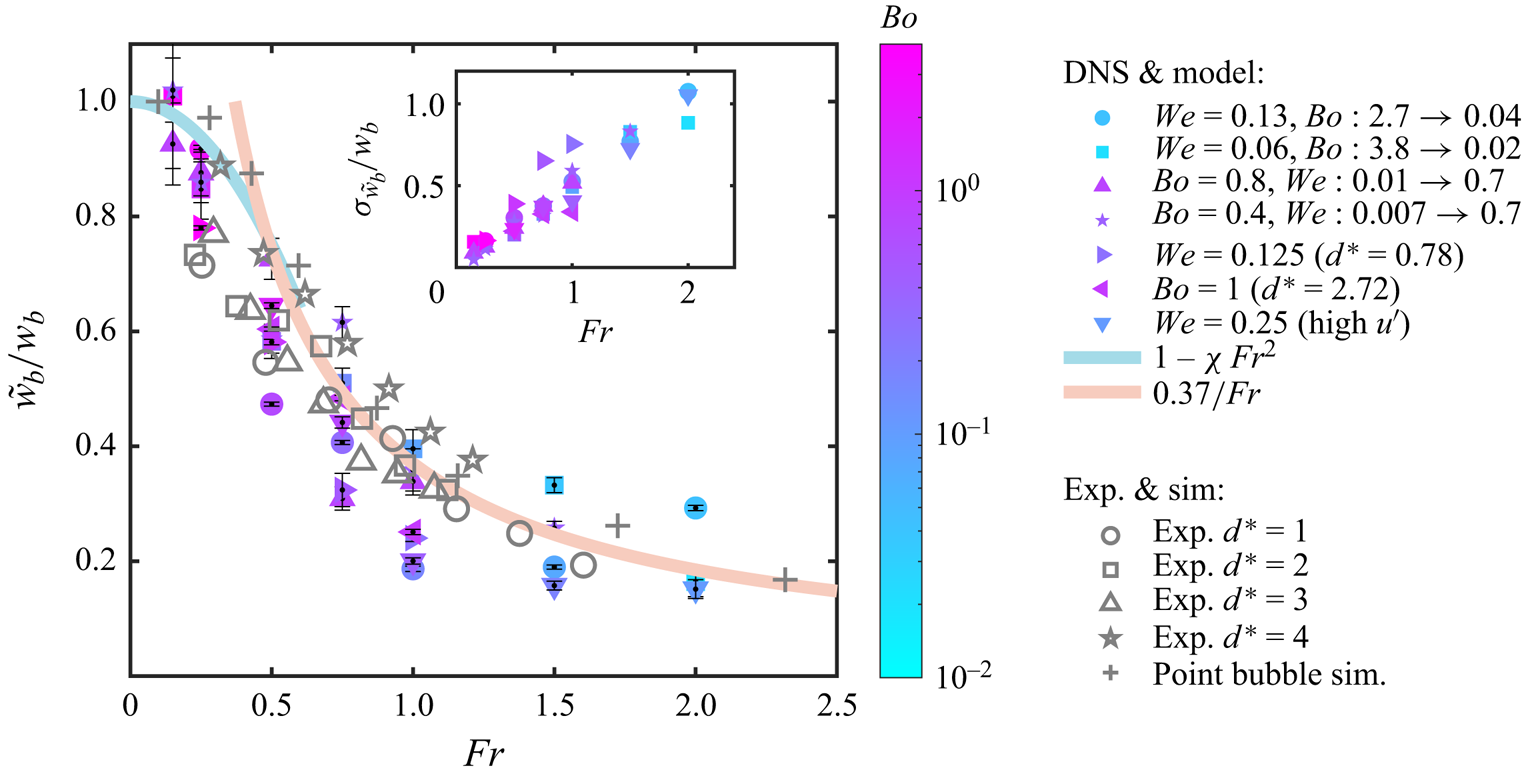
Bubbles in the relatively weak turbulence regime ( $Fr\approx 0.15$, $0.25$ in our simulations) have a dimensionless average rise velocity reduced by a small factor (<20 %). With increased turbulence intensity, the relative rising speed declines and reaches more than 80 % at the highest $Fr$ number tested.
The data collapse at large  $Fr$ on a single curve, $\tilde {w}_b/w_b=c / Fr$, with $c$ a non-dimensional coefficient fitted to the data, $c=0.37$, as suggested by Ruth et al. (Reference Ruth, Vernet, Perrard and Deike2021). We remark that at high $Fr$, the vertical speed of the bubble rising in turbulence exhibits fluctuations larger than the mean, as shown in the inset of figure 5. As a consequence, statistical convergence is difficult to reach, and a long time of simulations is required. To test the convergence, we randomly sample half of the vertical velocity signal and calculate their mean values, which results in a distribution of values centred around mean values using the whole signal. To indicate the width of the distribution around the central value, we display the standard deviations of these half-sampled mean values as error bars in figure 5. Data for various bubble inertia (with $Ga\in [25:400]$), deformation parameters (with $We\in [0.01,2.4]$ and $Bo \in [0.02,4]$) and bubble sizes (with $d^*$ from 0.78 to 4) collapse reasonably well. Symbols are colour coded by the Bond number and at a given $Fr$ number, no trend in $Bo$ number is observed.
Good agreement with the DNS is also observed with the laboratory experiments and point bubble simulations from Ruth et al. (Reference Ruth, Vernet, Perrard and Deike2021), which were conducted at a significantly larger turbulence Reynolds number. In Ruth et al. (Reference Ruth, Vernet, Perrard and Deike2021), the experimental average speed of air bubbles of various sizes within the inertial subrange ( $d^*\in [1,4]$) rising through varying turbulence ( $Re_\lambda \in [165, 256]$) in a water tank was measured and compared with the inferred (parameterised) quiescent rise speed in dirty water from Clift et al. (Reference Clift, Grace and Weber2005). The point-particle simulations were conducted separately and we demonstrated that a nonlinear drag model agrees quantitatively with the experimental results. Both experiments and point-bubble simulations were performed at significantly larger turbulence Reynolds numbers, suggesting that the scaling is valid in a wide range of turbulent Reynolds numbers. Separately, at small $Fr$ number, the reduction in rise velocity follows a parabolic scaling for both the experimental and numerical data.
The scalings of the reduction in rise velocity observed in the DNS and in other experimental and numerical datasets as a function of  $Fr$ number and summarised in figure 5 can be discussed within the framework of the Maxey–Riley equation (Maxey & Riley Reference Maxey and Riley1983). In the weak turbulence limit $Fr\ll 1$, the data (for both small sub-Kolmogorov bubbles and bubbles within the inertial subrange) follow a parabolic scaling $\tilde {w}_b/w_b = 1 -\chi \,Fr^2$, with $\chi$ a non-dimensional prefactor. Such parabolic scaling can be obtained from various perturbation analysis of bubbles trajectories in turbulent flow using the Maxey–Riley equation. Spelt & Biesheuvel (Reference Spelt and Biesheuvel1997) derived such result considering a linear viscous drag for small sub-Kolmogorov bubbles and obtained a size-dependent prefactor $\chi$. Performing a similar analysis using a nonlinear drag relationship at small $Fr$ number would also yield a parabolic scaling but with a modified prefactor.
For bubbles in the inertial subrange at large turbulence intensity  $Fr\gtrsim 0.5$, we observe $\tilde {w}_b/w_b=c / Fr$. In this regime, the inertial motion of the flow around the bubble induces a coupling between the horizontal and vertical motions of the bubble. Such coupling can be modelled by a nonlinear drag depending on the instantaneous slip velocity within the Maxey–Riley equations (Ruth et al. Reference Ruth, Vernet, Perrard and Deike2021).
The nonlinear drag force is modelled as  $\boldsymbol {F}_d=-K|\boldsymbol {U}_{\boldsymbol {s}}|\boldsymbol {U}_{\boldsymbol {s}}$, with $K=C_d{\rm \pi} d^2 \rho _l / 8$ an effective drag coefficient, $|\cdot |$ the absolute value and $U_s$ the slip velocity. The slip velocity is defined as the difference between the bubble velocity and the surrounding flow $\boldsymbol {U}_{\boldsymbol {s}}=\tilde {\boldsymbol {u}}_b-\boldsymbol {u}$. Note that the drag coefficient $C_d$ is assumed to be the same in both the quiescent and the turbulent case. Ruth et al. (Reference Ruth, Vernet, Perrard and Deike2021) showed that a varying drag coefficient $C_d$ based on an instantaneous bubble Reynolds number does not change the mean rise speed significantly. We remind the reader that the DNS performed in this study are directly solving the coupled two-phase Navier–Stokes equations and do not use the nonlinear drag model. The Maxey–Riley equation with a nonlinear drag is invoked here only to interpret our data and those in the literature.
It is critical to keep the instantaneous slip velocity when considering bubbles with sizes within the turbulence inertial ranges, as it causes the velocity fluctuations of the bubble slip velocity  $\boldsymbol {U}'_{\boldsymbol {s}}=\tilde {\boldsymbol {u}}_b'-\boldsymbol {u}'$ to increase the drag. The magnitude of the drag increase will depend on the relative strength of the fluctuating random motion to the mean rise motion, controlled by the $Fr$ number. At high $Fr$ number, Ruth et al. (Reference Ruth, Vernet, Perrard and Deike2021) assumed that the fluctuation magnitude of the slip velocity $|\boldsymbol {U}_s'|$ (normalised by $w_b$) increases linearly with $Fr$, a scaling recovered in the point particles simulations they performed.
The scaling of the slip velocity with  $Fr$ number can now be tested with the present DNS by measuring the slip velocity using a shell-averaged velocity around the bubble. Figure 6 shows the mean value of the slip velocity fluctuation magnitude. As shown in figure 6, we qualitatively confirm the scaling
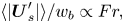 \begin{equation} \langle |\boldsymbol{U}_s'| \rangle/w_b \propto Fr, \end{equation}
in the  $Fr\approx 1$ regime, though different deformation extent causes some scattering. From a physical standpoint, the variations in slip velocity $\langle |\boldsymbol {U}_s'| \rangle$ are primarily attributed to turbulence in the high-Froude-number ( $Fr=u'/\sqrt {gd}$) regime, suggesting that the average magnitude of these fluctuations scales linearly with the turbulent velocity fluctuations, denoted by $u'$. Given that $\sqrt {gd}$ is a characteristic rise speed for large bubbles, this results in a linear relationship (4.1). We remark that this scaling is approximate for $Fr>0.5$ since $\sqrt {gd}$ is a rough estimation of $w_b$.
The mean value of the slip velocity fluctuation magnitude  $\langle |\boldsymbol {U}_s'|\rangle$ (filled symbols) and vertical fluid velocity sampled by the bubble $\langle w\rangle$ (empty symbols) as a function of $Fr$, with $Bo$ colour coded. Symbol shapes represent different deformation extents and the slip velocity is defined based on the search diameter $1.5d< SD<2d$.
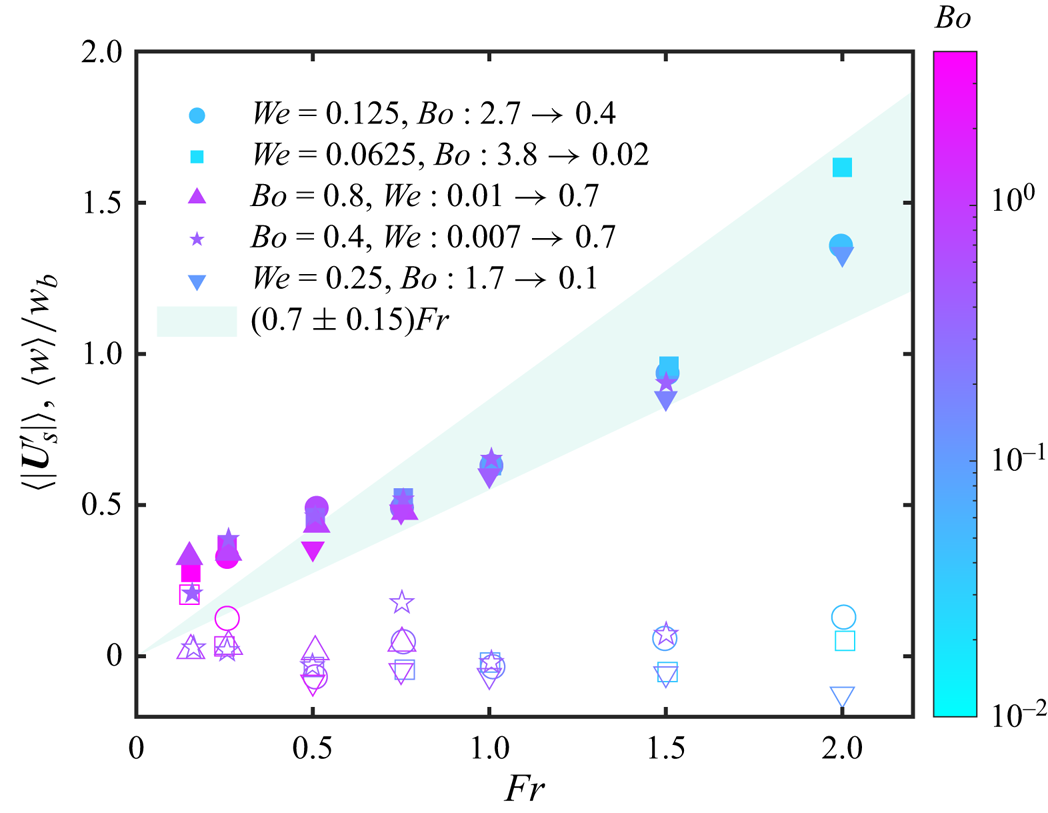
The mean vertical speed of the liquid surrounding the bubble in the defined spherical shell (sampled velocity), shown in empty symbols in figure 6, is typically around zero. Although both the bubble motions and potential preferential sampling in the flow could influence the mean vertical speed of the surrounding liquid, the fact that the sampled velocity does not change much at different  $Fr$ indicates that the slow down in rise velocity due to turbulence for bubbles with sizes within the inertial range is not due to the preferential sampling of downward flow regions with $w<0$, in contrast to what has been reported for sub-Kolmogorov bubbles with Stokes number around 1 (Spelt & Biesheuvel Reference Spelt and Biesheuvel1997; Mazzitelli et al. Reference Mazzitelli, Lohse and Toschi2003). It confirms that the mechanism of slow down of bubbles in turbulent background flow critically depends on the Stokes number, and that preferential sampling is not effective for bubbles in the inertial subrange with $St\gg 1$.
From (4.1) and the Reynolds type decomposition of the velocities (see Ruth et al. Reference Ruth, Vernet, Perrard and Deike2021 for details), the drag force in the vertical direction becomes  $| \langle \boldsymbol {F}_d^{v} \rangle |=K \langle |\boldsymbol {U}_s'| \rangle \tilde {w}_b$. Through balancing drag and buoyancy force $| \boldsymbol {F}_b|=Kw_b^2$, we obtain
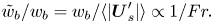 \begin{equation} \tilde{w}_b/w_b=w_b/\langle |\boldsymbol{U}_s'| \rangle \propto 1/Fr. \end{equation}
 Despite the wide range of bubble inertia, deformability and bubble sizes within the inertial range considered, the trends of the compiled DNS, experimental and point-bubble simulation data in figure 5 remain consistent with the  $1/Fr$ scaling presented. The scatter of points around these relationships suggests that the factors not captured in the nonlinear drag model also contribute to determining the average rise speed, including bubble deformability, the instantaneous local flow field around the bubble, lift and added-mass force, bubble finite-size effects and effects of trajectory instability. Nevertheless, the nonlinear drag model explains the effects of turbulence on top of a wide range of quiescent rising dynamics with different bubble inertia and deformability reasonably well and provides a conceptual framework that captures the essence to understand to what extent and how turbulence slows down the bubbles rising in a turbulent flow.
5. Conclusions
We have performed DNS of bubbles rising in isotropic turbulence. We have found that the relative rising speed of bubbles with sizes in the turbulent inertial range (compared with in quiescent medium) is primarily influenced by the Froude number, demonstrating the dominant role of turbulence intensity. We have demonstrated that the bubble slip velocity fluctuations scale with the Froude number. The rise reduction scales as  $\widetilde {w_b}/w_b\propto 1/Fr$ at a high $Fr$, as suggested by Ruth et al. (Reference Ruth, Vernet, Perrard and Deike2021) and we show that this scaling is applicable for a wide range of bubble inertia $Ga$, bubble deformability, $Bo$ or $We$ and sizes $d^*$. Bubble deformation, as characterised by the Bond and Weber numbers, plays a role in the bubble's absolute rising speed $\tilde {w}_b$ especially at low $Fr$, but only a secondary role in modulating the bubble's relative rise velocity $\tilde {w}_b/w_b$.
Bubble rising in turbulence carries rich physical information, therefore many dimensionless numbers can be formulated to understand the problem from different perspectives. For bubbles of sizes within the inertial subrange of the turbulence,  $Fr$ describes the turbulence intensity and $d^*=d/\lambda$ is a good indicator of whether the bubble is in the inertial subrange, together with $Ga$ and $Bo$ to describe the rise dynamics in a base corresponding quiescent medium. For bubbles in the viscous regime with a linear drag–velocity relationship, the turbulence-induced velocity fluctuations do not change the average bubble drag. These sub-Kolmogorov bubbles slow down due to preferential sampling or accumulation in the vortex centre or downward flow regions, therefore the influence of the bubble's response time to the flow (i.e. Stokes number) needs to be considered, which measures the effectiveness of the flow to accumulate the bubble in certain regions. Unifying bubble rise scaling laws in the inertial and viscous subranges remains to be performed.
Acknowledgements
We acknowledge high-performance computing support from Advanced Cyberinfrastructure Coordination Ecosystem: Services and Support (ACCESS), which is supported by the NSF, and Tiger managed by Princeton research computing. We thank Dan Ruth, Nicolo Scapin and Aliénor Rivière for discussions.
Funding
This work was supported by NSF grant 2242512 and NSF CAREER 1844932 to L.D.
Declaration of interests
The authors declare no conflict of interest.
Appendix A. Grid convergence
Figure 7 shows the rise speed of a bubble in quiescent and turbulent flows at different simulation resolutions. The time signal in quiescent flow is converged between L9 and L10, therefore L9 is enough, equivalent to  $\sim$70 grid points per bubble diameter. The terminal rise speed in a quiescent medium is averaged over a time window of the latter half of the whole vertical speed signal, which excludes the initial acceleration period, ensures the bubble speed fully saturates and contains enough oscillation periods for cases with unstable trajectories. For the turbulent case, the convergence check is based on the mean rise speed defined over a period such that the initial unsteady effects are excluded, where L9 and L10 show good convergence.
Grid convergence of (a) a typical quiescent case at  $Ga=119$, $Bo=0.7$ and $We=0.125$ and (b) a turbulent case at $Fr=0.75$, $Ga=79$, $Bo=0.3$ and $We=0.125$. The dashed line represents the mean rise speed average over the time window $t/\sqrt {d/g} \in [16, 80]$, which excludes the effects of initial unsteady acceleration.
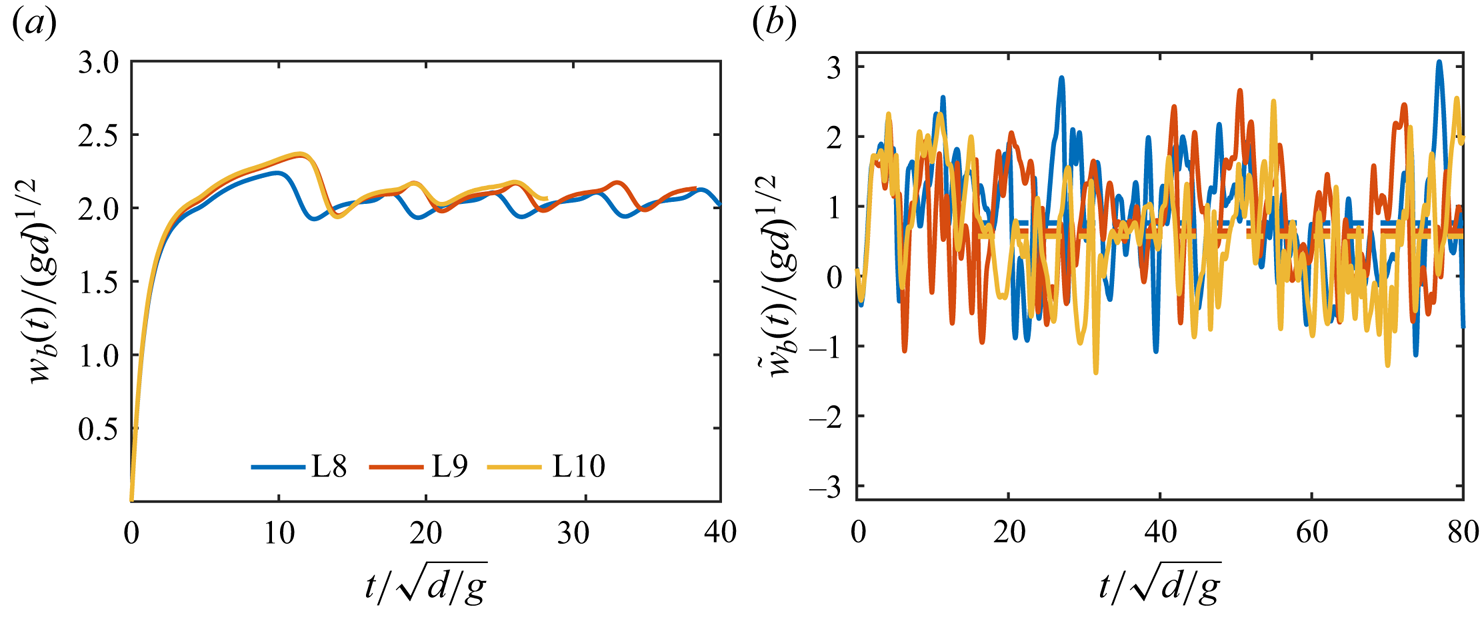
Appendix B. Turbulence properties
Figure 8(a,b) shows the time evolution of the turbulent kinetic energy and Taylor-scale Reynolds number before inserting the bubble, which reaches a statistically stationary state at  $3\epsilon t / 2K = 40$. Grid convergence of these quantities is achieved and verified in previous work (Farsoiya et al. Reference Farsoiya, Popinet and Deike2021; Perrard et al. Reference Perrard, Rivière, Mostert and Deike2021; Rivière et al. Reference Rivière, Mostert, Perrard and Deike2021; Farsoiya et al. Reference Farsoiya, Magdelaine, Antkowiak, Popinet and Deike2023b). We characterise the statistically steady turbulence properties using the second-order longitudinal structure function $D_{L L}(r)=\frac {1}{3} \sum _i\langle (u_i(\boldsymbol {r}, t)-u_i(\boldsymbol {r}+d \hat {\boldsymbol {r}}_i, t))^2\rangle$, where $\hat {\boldsymbol {r}}_i$ is the unit vector along the $i$th direction. Figure 8(c) shows that the scaled structure function shows a constant plateau at $C=2$ (Pope Reference Pope2000) in the inertia subrange, and no significant change in the turbulence properties is induced after inserting a bubble of a volume ratio $\sim$0.1 % rising under buoyancy and relaxing to steady state. Turbulence properties are similar to the same configuration without gravity described in Perrard et al. (Reference Perrard, Rivière, Mostert and Deike2021), Rivière et al. (Reference Rivière, Mostert, Perrard and Deike2021) and Farsoiya et al. (Reference Farsoiya, Popinet and Deike2021, Reference Farsoiya, Magdelaine, Antkowiak, Popinet and Deike2023b).
Properties of the homogenous and isotropic turbulent flow. (a) Kinetic energy and (b) Taylor-scale Reynolds number as a function of time. After the initial transient period, the turbulence properties reach a statistically stationary state and a bubble is inserted in this HIT flow. (c) Second-order longitudinal structure function  $D_{LL}$ before and after the bubble insertion, compensated for by the turbulence scaling $(r\epsilon )^{-2/3}$. Turbulence theory for the inertial subrange $D_{LL}(r\epsilon )^{-2/3}=2$ is superimposed as a black dashed line. The bubble is inserted at $t=0$ and is of a size ${\sim }20\eta$ for most cases, comparable to the Taylor microscale and within the inertia subrange.
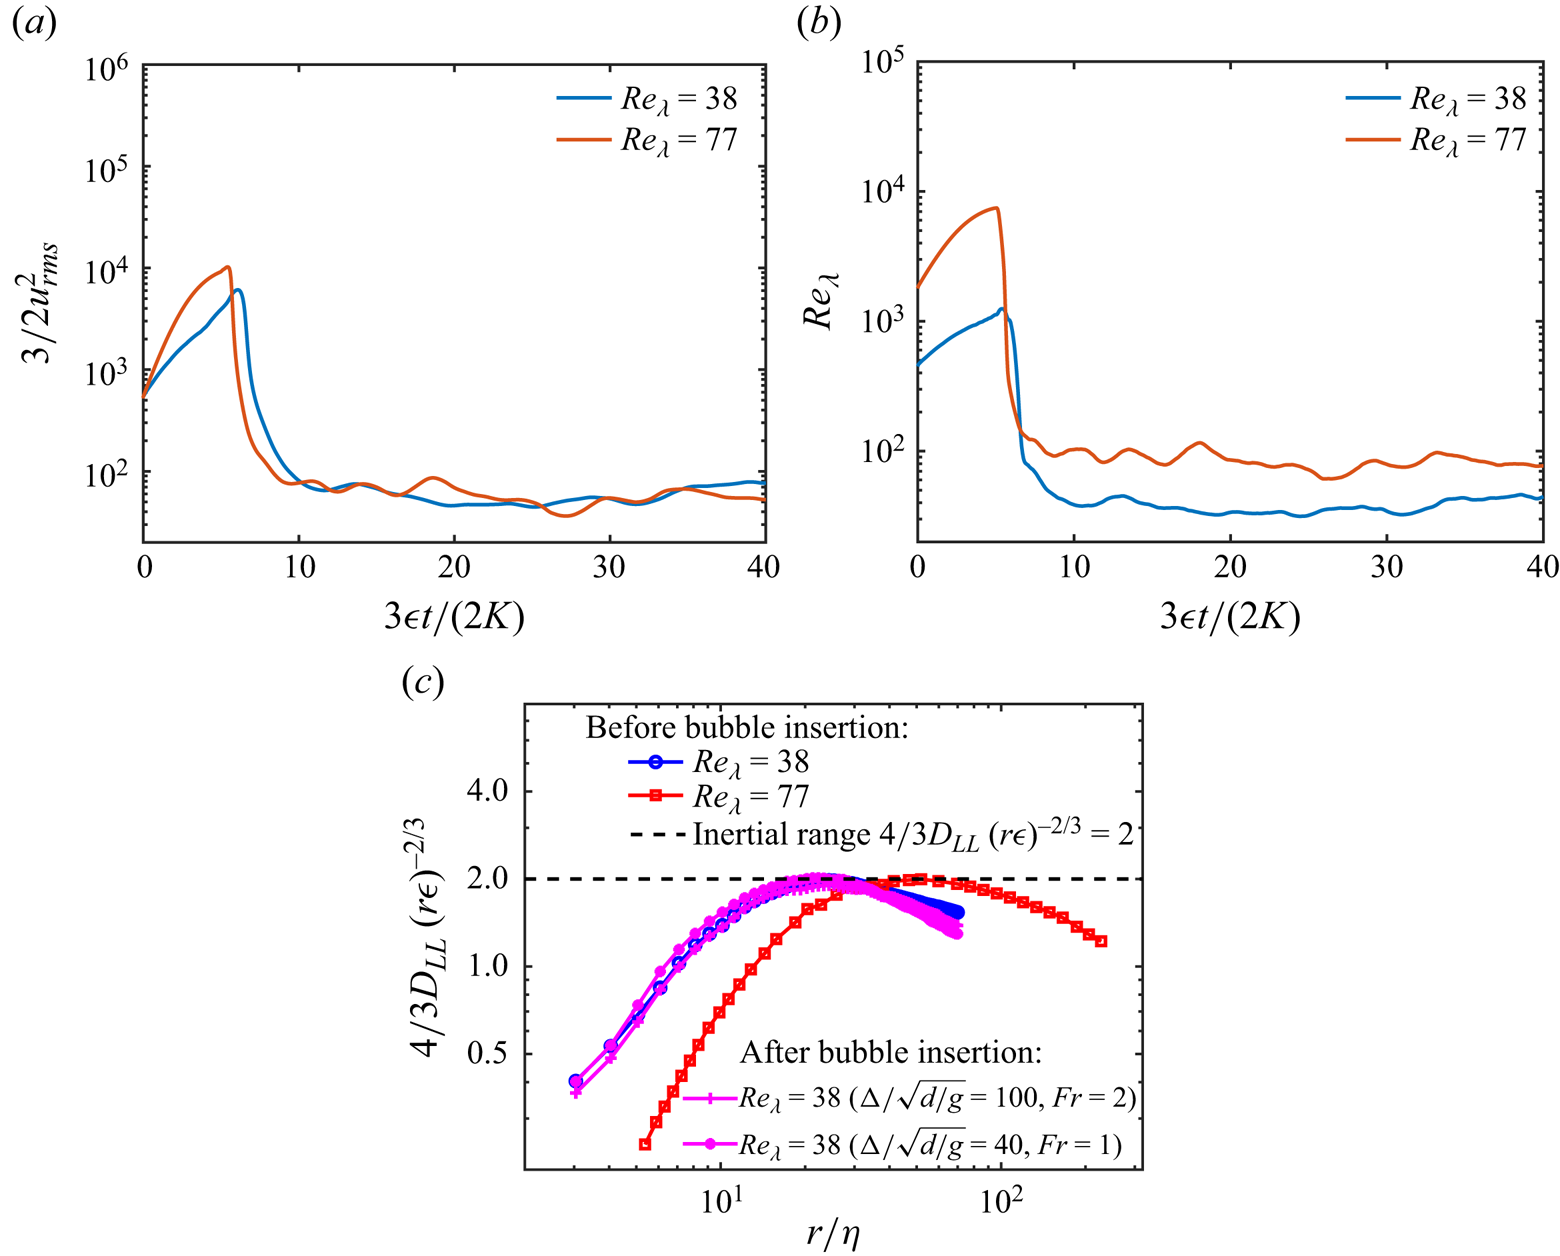


 Open access