Stark changes in body composition and dietary behaviours occur following spinal cord injury (SCI); furthermore, these adaptations directly influence one another(Reference Farkas and Gater1–Reference Bertoli, Spadafranca and Merati3). Following SCI, adiposity throughout the body increases, while lean mass (LM) below the level of injury (LOI) decreases, resulting in neurogenic obesity(Reference Farkas and Gater1,Reference Bertoli, Spadafranca and Merati3) . The loss in LM along with decreases in activity levels and impaired sympathetic nervous system activity results in a lowering of BMR and daily energy needs following SCI(Reference Farkas and Gater4,Reference Nightingale and Gorgey5) . Nutrition reporting among those with SCI reveals total energetic intakes lower than able-bodied individuals(Reference Farkas, Pitot and Berg2,Reference Nightingale and Gorgey5,Reference Silveira, Winter and Clark6) , in addition to lower measured BMR and calculated total energy expenditure(Reference Farkas, Pitot and Berg2,Reference Gorgey, Caudill and Sistrun7,Reference Gater8) . Despite these factors, obesity is still more prevalent among persons with chronic SCI compared with able-bodied persons(Reference Spungen, Wang and Pierson9–Reference Gorgey and Gater13). Persons with chronic SCI also have an increased risk for obesity-related cardiometabolic diseases(Reference Lieberman, McClelland and Goff14), including dyslipidaemia(Reference Bauman, Adkins and Spungen15–Reference Lieberman, Hammond and Barringer17), glucose intolerance and diabetes mellitus(Reference Bauman and Spungen16,Reference Bauman, Adkins and Spungen18–Reference Cragg, Noonan and Dvorak24) , central obesity(Reference Mojtahedi, Valentine and Arngrimsson25–Reference Gorgey, Mather and Gater28), systemic inflammation(Reference Manns, McCubbin and Williams20,Reference Gibson, Buchholz and Ginis29–Reference Sumrell, Nightingale and McCauley32) and mitochondrial dysfunction(Reference O’Brien, Wade and Segal33,Reference Gorgey, Witt and O’Brien34) .
To mitigate these adverse effects, it is recommended that those with SCI not only engage in physical activity but also modify their dietary habits(Reference Shojaei, Alavinia and Craven35,Reference Chen, Henson and Jackson36) . Higher dietary fat intake is reported after SCI(Reference Groah, Nash and Ljungberg37,Reference Bigford and Nash38) and is associated with increased adiposity(Reference Gorgey, Caudill and Sistrun7). However, the precise role of macronutrient intake on body composition after SCI is not fully understood, which is partly due to traditional approaches which investigate the effect of one variable at a time (e.g. effects of one macronutrient on one metabolic or body composition outcome). Previous research has shown that macronutrient intake is associated with visceral and subcutaneous adiposity as well as fasting insulin levels in men with motor complete SCI(Reference Abilmona and Gorgey39). Furthermore, the percentage of fat intake has been shown to account for 29–34 % of whole and regional body fat mass, while the percentage of carbohydrate intake was positively related to whole-body LM and negatively associated with fat mass in men with chronic SCI(Reference Gorgey, Caudill and Sistrun7). However, these reports have relied on traditional statistical techniques to examine these associations.
The geometric framework for nutrition (GFN) has emerged as a tool to better understand the complex relationships between nutrition and health(Reference Simpson, Le Couteur and James40,Reference Raubenheimer and Simpson41) . As opposed to more reductionist methods, the GFN allows the examination of complex interactions among multiple nutrients and health outcomes(Reference Simpson, Le Couteur and James40). The GFN enables researchers to examine broad multidimensional interactions between variables of interest across multiple domains. Subsequently, the dynamic relationships between nutrition and health outcomes can be mapped on n-dimensional nutrient state spaces, where n is the number of nutritional parameters(Reference Simpson, Le Couteur and James40–Reference Solon-Biet, Wahl and Raubenheimer42). Therefore, this powerful tool allows the consequences of ingesting combinations of nutrients to be represented graphically, which provides a visual representation of how nutrient intakes are related to markers of health. While this tool has been used to examine the influence of nutrition on several health-related outcomes among multiple non-human organisms(Reference Raubenheimer, Machovsky-Capuska and Gosby43), including ageing(Reference Gokarn, Solon-Biet and Cogger44) and liver disease(Reference Simpson, Raubenheimer and Cogger45), only a few human studies have utilised the GFN to examine the relationships between nutrition and health outcomes(Reference Raubenheimer and Simpson41,Reference Raubenheimer, Machovsky-Capuska and Gosby43,Reference Simpson, Batley and Raubenheimer46–Reference Simpson and Raubenheimer48) . Therefore, the purpose of the current work was to use the GFN to examine the associations between self-reported macronutrient intakes and body composition in persons with chronic SCI. Body composition assessment was conducted using three different levels of measurement, including circumferential anthropometrics, dual-energy X-ray absorptiometry (DXA) and MRI.
Materials and methods
Participants
Individuals were recruited to participate in two different clinical trials (registered with clinicaltrials.gov: NCT01652040 and NCT02660073) broadly aimed at exploring the effects of lower extremity neuromuscular electrical stimulation evoked resistance training following chronic (≥ 1-year post-injury) traumatic and non-traumatic SCI (LOI ranged between C5 and L2). Importantly, the present study consisted of a retrospective analysis of baseline data from each study. All procedures were in accordance with the ethical standards of the Helsinki Declaration of 1964 and its later amendments. The McGuire Veteran Affairs Investigation Research Board and the Virginia Commonwealth University Office of Research and Innovation approved the present study. For study 1 (NCT01652040, n 16), men between 18 and 50 years of age with motor complete SCI (American Spinal Injury Association Impairment Scale (AIS)-A: complete motor and sensory loss below the LOI; or AIS-B: complete motor loss and incomplete sensory loss below the LOI) were recruited. For study 2, men and women aged between 18 and 65 years with motor complete or incomplete SCI (AIS-A; AIS-B or AIS-C: incomplete motor and sensory loss with less than half of the muscles tested below the LOI graded ≥ 3) were recruited (NCT02660073, n 32). Those presenting with CVD, uncontrolled type 2 diabetes (or requiring insulin), haematocrit > 50 % or symptoms of a urinary tract infection were excluded from participating in either study. Additional exclusion criteria for study 1 included individuals with pressure sores ≥ stage 2 and serum testosterone levels > 34·7 nmol/l. Similarly, pregnant women, those with pressure sores ≥ stage 3 or osteoporosis as determined using DXA (T-scores ≤ −2·5) were also excluded from study 2. All potential participants received a physical exam from an SCI-certified physician to ensure eligibility. Interested and qualified individuals provided informed written consent approved by the Hunter Holmes McGuire Veterans Affairs Medical Center IRB.
Dietary recall
Throughout study 1 and study 2, participants completed and returned 5- or 3-d dietary recall logs, respectively, which included at least one weekend day(Reference Gorgey, Caudill and Sistrun7). Our laboratory has previously shown no difference between energetic intake and percentages of macronutrients from 3- or 5-d recalls(Reference Gorgey, Caudill and Sistrun7). Participants and their caregivers (as available) were educated on properly completing the recall form, capturing the amount and type of foods consumed during the weekdays for every meal and snack. Once returned to the laboratory, each participant’s data were entered into dietary tracking and analysis software (Nutrition Data System for Research (NDSR), versions 2012–2018; University of Minnesota). The first week of self-reported dietary data (either 3- or 5-d recalls) was averaged for each individual. The mean macronutrient masses (g) for fats, proteins and carbohydrates were used for analysis. Due to the relatively small sample size, we limited our model to examine macronutrients as opposed to more detailed food groups (e.g. simple v. complex carbohydrates and saturated v. unsaturated fat).
Circumferential anthropometric measures
Several circumferential anthropometric measures were captured while participants were seated in their wheelchairs and lying supine on the DXA scanner as previously described(Reference Sumrell, Nightingale and McCauley32). Briefly, these measures were collected at baseline prior to any intervention by an experienced technician. Waist circumferential measures were taken from the narrowest point between the lowest ribs and the iliac crests in both the seated (Sit-WC) and supine positions (Sup-WC). Abdominal circumferential measures were captured at the level of the umbilicus and also captured while participants were seated (Sit-AC) and lying supine (Sup-AC). Finally, supine hip circumferential measures (Sup-HC) were acquired from the widest part of the buttocks (often traversing the greater trochanters). At least three separate measurements within 0·5 cm of each other were captured for each circumferential anthropometric measure. The average of these three measures was used for analysis.
MRI measures
MRI was performed before any intervention at baseline for participants in both studies (1·5T; General Electric Signa). Twenty-five to thirty-three transverse images (slice thickness: 0·8 cm and interslice spacing: 1·2 cm) were captured between each individual’s xiphoid process and their femoral heads using an abdominal coil (fast spin-echo sequence: axial in-phase/out-phase; repetition time: 140 ms; echo time: 4·3 ms in-phase, 2 ms out-phase; field-of-view: 42 cm; matrix size: 256 × 256; number of excitations: 1 and acquisition time: 2 min)(Reference Gorgey, Mather and Gater28,Reference Sumrell, Nightingale and McCauley32) .
Images were first processed using ImageJ (version 1.52a; National Institutes of Health) to identify an abdominal area of interest for each participant. Anatomical consistency of the abdominal region was maintained among the participants by only including images between the upper poles of the kidneys and the femoral heads. Win Vessel (version 2; Ronald Meyer, Michigan State University) was then used for additional image processing and analysis as previously described(Reference Moussavi, Ribas-Cardus and Rintala51). Based on pixel signal intensity, tissue segmentation (adipose, skeletal muscle and bone) for each image within the abdominal region was achieved. Next, manual tracing of the adipose tissue between the skin and the abdominal muscles (subcutaneous adipose tissue (SAT)), and the adipose within the abdominal walls and surrounding the viscera (visceral adipose tissue (VAT)) were identified during segmentation. Once traced, the cross-sectional area (CSA, cm2) for both the VAT and SAT was measured, and the ratio between them (VAT:SAT) was calculated.
Dual X-ray absorptiometry measures
Full-body DXA scans were conducted at baseline for both studies (GE Healthcare Lunar Prodigy) as previously reported(Reference Gorgey, Cirnigliaro and Bauman52). Briefly, each participant was placed in a supine position with the lower extremities strapped together above the knee joint in a neutral position. The upper extremities were stabilised close to the body in neutral, and the pelvis/trunk was aligned in a neutral position as well. Lean body mass (kg), fat mass (kg) and the percentage body fat mass (%) were assessed for the total body (respectively: total-LM, total-FM, %total-FM) along with specific regions of interest: the trunk (respectively: trunk-LM, trunk-FM, %trunk-FM) and the combined lower extremities (respectively: LE-LM, LE-FM, %LE-FM). Each image was analysed using GE Healthcare encore (version 16). These regions of interest were first automatically identified and then manually adjusted to improve reliability(Reference Gorgey, Cirnigliaro and Bauman52).
In the present study, we used a combination of anthropometric measurements (circumferences), DXA and MRI to capture a complete picture of body composition. Circumferences offer a practical clinical tool to assess fat mass and are strongly correlated with cardiometabolic markers in chronic SCI(Reference Sumrell, Nightingale and McCauley32). In addition, DXA is a surrogate gold standard tool to evaluate whole-body composition and fat-free mass, while MRI represents the gold standard to assess regional adiposity(Reference Sumrell, Nightingale and McCauley32,Reference van der Scheer, Totosy de Zepetnek and Blauwet53) . Therefore, the combination of these measurements allowed for a more complete examination of body composition.
Statistical analysis
A cross-sectional analysis utilising the GFN approach was employed. Not all macronutrient intakes were normally distributed. General additive models using thin-plate smoothing spines were used to form response surfaces for each anthropometric, MRI and DXA measure over the self-reported macronutrient intake spaces(Reference Wood54,Reference Wood55) . These models were built using single factors (proteins; carbohydrates; fats) and two-factor interactions (protein × carbohydrate; protein × fat; carbohydrate × fat) in the R mgcv package (version 1.8-31). Graphical representations of these models were then generated as previously described(Reference Gokarn, Solon-Biet and Cogger44,Reference Simpson, Raubenheimer and Cogger45,Reference Solon-Biet, McMahon and Ballard56) . Briefly, two-dimensional response surfaces representing the three-dimensional nutrient state spaces of each outcome measure were developed in triplicate, providing multiple perspectives for each relationship. In addition to these plots, Pearson correlations were conducted to examine bivariate associations between macronutrient intakes. Our sample size was selected to provide sufficient power (0·80) for the primary aim, examining the relationships between macronutrient intake and measures of body composition. Due to the exploratory nature of the study, no adjustments for covariates were performed to ensure sufficient statistical power. All GFN analyses and images were produced using RStudio (version 1.3.959; R: version 4.0.0, The R Foundation for Statistical Computing). Regression analyses and bivariate statistics were performed using SPSS (SPSS statistics version 24, IBM corp.). An α value of 0·05 was chosen for all analyses.
Results
Participants
A total of fifty-four individuals participated in both studies; however, six persons who contributed to study 1 later engaged in study 2. For those participating in both studies, their data collected during study 2 were excluded from analysis. Demographic and injury information for the remaining forty-eight participants is provided in Table 1. All participants completed baseline testing for study 1 and study 2 without experiencing any adverse events.
Baseline demographics and spinal cord injury characteristics for forty-eight participants
(Mean values and standard deviations)

AIS, American Spinal Injury Association Impairment Scale; AIS-A, complete motor and sensory loss below the level of injury; AIS-B, complete motor loss and incomplete sensory loss below the level of injury; AIS-C, incomplete motor and sensory loss with less than half of the muscles tested below the LOI graded ≥ 3; SCI, spinal cord injury.
Dietary recall results
All participants in study 2 provided self-reported dietary recall information for each of the three requested days, while three participants in study 1 only reported dietary information for four out of the five requested days. However, the data for these individuals in study 1 were still included in analysis, and no special steps were taken to address this negligible data loss(Reference Gorgey, Caudill and Sistrun7). A wide variety of dietary patterns were observed. A mean of 6757 (sd 2945) kj (range: 1377–18,215 kj; 1615 [sd 704 kcal]; range: 329–4354 kcal) per day was reported. On average, these energy content were derived from 18·6 (sd 5·3) % (range: 9·8–40·5 %) protein, 43·8 (sd 8·4) % (range: 27·6–68·9 %) carbohydrates and 36·6 (sd 6·4) % (range: 21·2–49·4 %) fat. This amounted to a reported average of 69·3 (sd 28·2) g (range: 11·6–156·9 g) protein, 180·8 (sd 83·4) g (range: 29·8–449·2 g) carbohydrates and 67·8 (sd 34·6) g (range: 18·4–222·2 g) fat being consumed by the participants daily. A Pearson correlation matrix (n 46) revealed a significant inverse association between the percentage of carbohydrates and fat consumed (r = −0·753, P < 0·01).
Circumferential anthropometric results
The Sup-WC was not measured for one participant because they presented with scoliosis, which interfered with accurate measurement. Mean anthropometric results are shown in Table 2. The general additive models revealed significant associations between carbohydrates and circumferential anthropometric measures (Sit-WC, Sit-AC, Sup-WC, Sup-HC and Sup-AC; see Table 3 and Fig. 1 and 2).
Mean anthropometric, MRI and dual-energy X-ray absorptiometry (DXA) measures
(Mean values and standard deviations)

Sit-WC, seated waist circumference; Sit-AC, seated abdominal circumference; Sup-WC, supine waist circumference; Sup-HC, supine hip circumference; Sup-AC, supine abdominal circumference; SAT, subcutaneous adipose tissue; VAT, visceral adipose tissue; total-FM, total body fat mass percentage; total-FM, total body fat mass; total-LM, total body lean mass; trunk-FM, trunk fat mass percentage; trunk FM, trunk fat mass; trunk-LM, trunk lean mass; LE-FM, lower extremity fat mass percentage; LE-FM, lower extremity fat mass; LE-LM, lower extremity lean mass.
*n 47; **n 44.
General additive model P values for measures of body composition among the macronutrient intake state space

Anthro, anthropometrics; Carb, carbohydrates; DXA, dual-energy X-ray absorptiometry; SAT, subcutaneous adipose tissue; VAT, visceral adipose tissue; Sit-WC, seated waist circumference; Sit-AC, seated abdominal circumference; Sup-WC, supine waist circumference; Sup-HC, supine hip circumference; Sup-AC, supine abdominal circumference; total-F, total body fat mass percentage; total-FM, total body fat mass; total-LM, total body lean mass; trunk-F, trunk fat mass percentage; trunk-FM, trunk fat mass; trunk-LM, trunk lean mass; LE-F, lower extremity fat mass percentage; LE-FM, lower extremity fat mass; LE-LM, lower extremity lean mass.
* P values ≤ 0·05.
Supine anthropometric measures. Two-dimensional representations of each geometric framework for nutrition (GFN) response surface within macronutrient intake state spaces are provided. The median value of the third factor (identified with parentheses on each x-axis) limits each response surface. Red regions represent increased anthropometric circumferences, and blue regions represent reduced anthropometric circumferences. (a) and (b) represent supine abdominal circumference (cm); (c) and (d) represent supine waist circumference (cm); (e) and (f) represent supine hip circumference (cm). In all examples, lower carbohydrate intake is associated with increased circumferences. Nutrient intake is quantified in grams. Kcal quantities can be calculated using conversion factors: 9 kcal/g (fat) and 4 kcal/g (protein and carbohydrates).

Seated anthropometric measures. Two-dimensional representations of each geometric framework for nutrition (GFN) response surface within macronutrient intake state spaces are provided. The median value of the third factor (identified with parentheses on each x-axis) limits each response surface. Red regions represent increased anthropometric circumferences, and blue regions represent reduced anthropometric circumferences. (a) and (b) represent seated waist circumference (cm); (c) and (d) represent seated abdominal circumference (cm). In all examples, lower carbohydrate intake is associated with increased circumferences.

MRI results
MRI was not conducted for four participants due to procedure contraindications. Mean results for the MRI measures are also presented in Table 2. Significant associations between SAT and protein × carbohydrate as well as carbohydrates were identified; however, no significant associations were observed for VAT or VAT:SAT ratio (see Table 3 and Fig. 3).
MRI measures of fat mass. Two-dimensional representations of each geometric framework for nutrition (GFN) response surface within macronutrient intake state spaces are provided. The median value of the third factor (identified with parentheses on each x-axis) limits each response surface. Red regions represent increased fat mass, and blue regions represent reduced fat mass. (a), (b) and (c) represent subcutaneous adipose tissue area (cm2); (d), (e) and (f) represent visceral adipose tissue area (cm2). In all examples, lower carbohydrate intake is associated with increased fat mass.

Dual-energy X-ray absorptiometry results
All participants completed DXA scans. Table 2 presents the mean DXA variables observed among the participants. Only measures of LM were not found to be significantly associated with any macronutrient combination. Carbohydrates were significantly associated with %total-FM, total-FM, %trunk-FM, trunk-FM, %LE-FM and LE-FM (see Table 3 and Fig. 3). Additionally, significant interactions were found between carbohydrate × fat for LE-FM and between protein × carbohydrate for %LE-FM and LE-FM (see Table 3 and Fig. 4). Additionally, linear regressions were performed to further explore the relationships between carbohydrate intake and measures of fat mass after controlling for total energetic intake (see Table 4). Accounting for total energetic intake did not influence the relationship between carbohydrate intake and measures of fat mass.
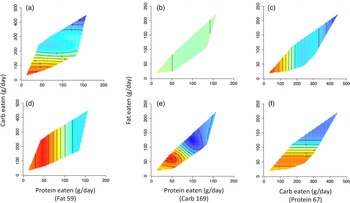
Dual-energy X-ray absorptiometry (DXA) measures of fat mass. Two-dimensional representations of each geometric framework for nutrition (GFN) response surface within macronutrient intake state spaces are provided. The median value of the third factor (identified with parentheses on each x-axis) limits each response surface. Red regions represent increased fat mass, and blue regions represent reduced fat mass. (a) and (b) represent lower extremity fat mass (kg); (c) and (d) represent trunk fat mass (kg); (e) and (f) represent total fat mass (kg). In all examples, lower carbohydrate intake is associated with increased fat mass.

Weighted least squares regression analyses examining carbohydrate intake (g) and measures of fat mass (FM) with and without controlling for total energetic intake

WC, waist circumference; SAT, subcutaneous adipose tissue.
Discussion
Major findings
Overall, the results demonstrate an inverse association between the amount of carbohydrates individuals with SCI consume and measures of their body fat. This pattern was consistently demonstrated despite employing different tools used to assess body composition among those with SCI, which included circumferential anthropometric measurements, MRI and DXA. Specifically, carbohydrate intake was negatively associated with all anthropometric measures, SAT as measured by MRI and all DXA measures of fat mass. These results suggest that higher carbohydrate intake was associated with lower measures of FM. There were also notable interactions for protein × carbohydrates for SAT and DXA measures of LE-FM, as well as an interaction for carbohydrates × fat for LE-FM; however, these interactions may be driven by carbohydrate intake. Furthermore, lean body mass, VAT and VAT:SAT ratio were unrelated to these dietary macronutrients in the present study.
Macronutrient intake following spinal cord injury
Two-thirds of persons with SCI are likely to be obese and are at risk for metabolic complications related to obesity(Reference Gater8,Reference Gorgey and Gater13,Reference Wahman, Nash and Westgren21,Reference Weaver, Collins and Kurichi57,Reference Wilt, Carlson and Goldish58) . Dietary factors strongly influence the prevention and management of these risk factors(Reference Bertoli, Spadafranca and Merati3,Reference Moussavi, Ribas-Cardus and Rintala51,Reference Tomey, Chen and Wang59,Reference Groah, Spungen and Bauman60) . However, only a few studies have investigated individuals’ dietary intakes with chronic SCI(Reference Bertoli, Spadafranca and Merati3,Reference Gorgey, Caudill and Sistrun7,Reference Groah, Nash and Ljungberg37,Reference Moussavi, Ribas-Cardus and Rintala51,Reference Tomey, Chen and Wang59–Reference Khalil, Gorgey and Janisko61) , and little is known regarding how specific macronutrients impact body composition and cardiometabolic health after SCI. The recommended macronutrient distribution range for able-bodied adults consists of energetic intake from protein (10–35 %), fat (20–35 %) and carbohydrate (45–65 %)(Reference Groah, Nash and Ljungberg37). Previous research has found evidence of dietary inadequacy in adults with chronic SCI(Reference Farkas, Pitot and Berg2,Reference Groah, Nash and Ljungberg37,Reference Walters, Buchholz and Martin Ginis62) . Total energetic intake is often below recommended levels(Reference Gorgey, Caudill and Sistrun7,Reference Groah, Nash and Ljungberg37) , with low fibre intake(Reference Tomey, Chen and Wang59,Reference Sabour, Javidan and Vafa63,Reference Levine, Nash and Green64) and deficiencies in certain vitamins and minerals(Reference Tomey, Chen and Wang59,Reference Sabour, Javidan and Vafa63,Reference Levine, Nash and Green64) but with high carbohydrate and fat intake(Reference Groah, Nash and Ljungberg37). In the present study, energy content were derived from 18·6 (sd 5·3) % (range: 9·8 %–40·5 %) protein, 36·6 (sd 6·4) % (range: 21·2–49·4 %) fat and 43·8 (sd 8·4) % (range: 27·6–68·9 %) carbohydrates. These results suggest the average fat intake was high in the present study relative to recommendations for able-bodied adults, similar to previous findings from our laboratory(Reference Farkas, Pitot and Berg2). Previous literature showed that persons with chronic SCI consume fat that approaches or exceeds the United States Department of Agriculture (USDA) recommendations(Reference Groah, Nash and Ljungberg37,Reference Bigford and Nash38,Reference Tomey, Chen and Wang59,Reference Sabour, Javidan and Vafa63,Reference Lieberman, Goff and Hammond65–Reference Perret and Stoffel-Kurt67) , as do the amounts of carbohydrates consumed(Reference Farkas, Pitot and Berg2,66) . Specifically, an excess intake of simple carbohydrates(Reference Sabour, Javidan and Vafa63) and saturated fat(Reference Groah, Nash and Ljungberg37) but low fruit and vegetables(Reference Tomey, Chen and Wang59,Reference Lieberman, Goff and Hammond65) has been reported.
Carbohydrate intake following spinal cord injury
It has been proposed that excess carbohydrates may be stored as fat in visceral, subcutaneous, intermuscular and intramuscular locations(Reference Khalil, Gorgey and Janisko61), which could contribute to obesity and disorders of carbohydrate metabolism(Reference Farkas and Gater4,Reference Gater8,Reference Gorgey, Dolbow and Dolbow68) . In contrast, previous research showed that the percentage of carbohydrate intake was negatively related to the percentage of whole-body FM, leg FM and trunk FM but positively related to the percentage of whole-body LM, trunk LM and BMR adjusted to body weight in persons with SCI(Reference Farkas, Pitot and Berg2). For all circumferential measures, lower carbohydrate intake was associated with increased FM (as denoted by the red regions of Fig. 1 and 2). Specifically, carbohydrate intake below 150 g/d was associated with the largest abdominal, waist and hip circumferences. This pattern was also seen for DXA measures of FM, with carbohydrate intake below 150 g/d being associated with the largest amounts of LE-FM, trunk-FM and total body FM (as denoted by the red regions of Fig. 4). This pattern was also true for SAT, with carbohydrate intake below 150 g/d being associated with the largest SAT CSA (as denoted by the red regions of Fig. 3). While there were no significant associations between macronutrient intake and VAT, this threshold of carb intake was not seen with VAT. The lack of significant association with VAT may be due to the level of physical activity rather than dietary intake – previous research shows a negative association between the physical activity levels and visceral adiposity in persons with SCI(Reference Pelletier, Omidvar and Miyatani69). These results may also support previous research showing a protective role of SAT on metabolic profile(Reference Gorgey and Gater70,Reference Freedland71) .
Fat intake following spinal cord injury
Although fat intake was not significantly associated with measures of FM in the present study, previous work has suggested that the percentage of dietary fat was negatively related to the percentage of whole-body LM, trunk-LM and BMR adjusted to body weight(Reference Gorgey, Caudill and Sistrun7). Persons with SCI are likely to consume a high-fat diet, which is a predisposing lifestyle factor for dyslipidaemia, central adiposity and insulin resistance(Reference Gorgey, Caudill and Sistrun7,Reference Groah, Nash and Ljungberg37,Reference Nightingale, Williams and Thompson72,Reference Gorgey, Mather and Cupp73) . Previous work has found that persons with paraplegia and tetraplegia consume 81·4 and 82·7 g of fat per day, respectively, while the recommended daily intake for able-bodied individuals is 40–70 g/d(Reference Groah, Nash and Ljungberg37). Additionally, dietary fat intake has been found to explain 29–34 % of whole-body and regional FM in chronic SCI(Reference Gorgey, Caudill and Sistrun7). The lack of a significant association between fat intake and body composition in the present study could be due to many factors, including the level of physical activity, which was not accounted for in this exploratory study. Interestingly, while fat intake was not significantly associated with measures of body composition in the present study, there was a significant inverse bivariate association between the percentage of carbohydrates and fat consumed. This suggests that individuals who consumed higher amounts of carbohydrates also consumed lower fat, which may indicate that lower fat intake is partially responsible for the favourable body composition seen with higher carbohydrate intake.
Interactions among macronutrient intake and body composition following spinal cord injury
While neither fat nor protein consumption alone or in combination was significantly related to any measures, carbohydrate × fat and protein × carbohydrate interactions were significantly related to LE-FM. Indeed, significant relationships were found only when carbohydrate intake was considered. Therefore, dietary carbohydrate intake appears to be driving these interactions. In this preliminary report, dietary fat and protein alone do not significantly impact body composition, but rather their influence depends on dietary carbohydrates. This is potentially related to the changes in fat and carbohydrate metabolism following SCI. Persons with SCI have a reduced ability to use stored fat as a substrate even during exercise due to the dysfunction of the autonomic nervous system and thus rely on carbohydrate utilisation(Reference Kjær, Dela and Sørensen74). Moreover, increased carbohydrate utilisation and decreased fat utilisation across a range of exercise intensities during arm cycling have been demonstrated in men with paraplegia(Reference Jacobs, Burns and Kressler75). Additionally, as previously stated, traditional approaches have examined the associations of one dietary factor at a time as opposed to examining the complex interactions among many nutritional factors, which may lend credence to these novel findings using the GFN. Therefore, future research should further investigate macronutrient intake on health outcomes following SCI using the GFN to validate these findings.
As previously mentioned, we used a combination of anthropometric measurements (circumferences), DXA and MRI in the present study to capture a complete picture of body composition. Central adiposity characterised by increasing waist circumference, VAT CSA or VAT:SAT ratio is tightly associated with cardiometabolic disorders after SCI. Both seated and supine waist and abdominal circumferences are strongly related to VAT and VAT:SAT ratio as measured by the gold standard MRI. Furthermore, our laboratory has previously established SCI-specific anthropometric and VAT thresholds associated with impaired cardiometabolic health(Reference Sumrell, Nightingale and McCauley32). The MRI VAT CSA cut-off was identified as 100 cm2. The cut-offs for anthropometric measurements were 86·5 and 88·3 cm for supine waist and abdominal, respectively, and 89·1 and 101 cm for seated waist and abdominal, respectively. The current sample, on average, was below the cut-offs for VAT CSA (81·5 (sd 65·1) cm2), supine waist (82·9 (sd 12·9) cm) and abdominal circumference (83·3 (sd 14·0) cm), as well as seated waist (88·1 (sd 11·7) cm) and abdominal circumferences (95·1 (sd 15·3) cm). Therefore, this sample represents a relatively lean group of individuals with SCI. As expected, our sample had higher fat mass and less LM as compared with the general able-bodied population(Reference Spungen, Wang and Pierson9,Reference Spungen, Adkins and Stewart10,Reference Edwards, Bugaresti and Buchholz26,Reference Buchholz and Bugaresti76) . Additionally, anthropometric measurements are a clinical surrogate measure to estimate VAT accumulation in persons with SCI, DXA represents a surrogate gold standard to assess whole-body fat mass and fat-free mass and MRI breaks down these compartments further into regional muscle and fat mass(Reference Sumrell, Nightingale and McCauley32,Reference van der Scheer, Totosy de Zepetnek and Blauwet53) . Therefore, the combination of these techniques allowed the examination of practical clinical tools (circumferences), as well as validated measures of regional adiposity and fat-free mass (MRI and DXA, respectively).
Limitations
It should be noted that this study does not identify any type of causal relationship between dietary choices among those with SCI and body composition. The associations observed also do not clearly indicate how those with SCI might leverage one or more macronutrient(s) over another to influence body composition. One notable limitation of this work is that these conclusions rely entirely on the self-reported dietary data of our participants. In addition, this data set includes few females, and the exclusion criteria of both studies preclude the participation of those with common co-morbid conditions. Such factors limit sub-group analyses using GFN methodologies and the scope of this report’s findings. Additionally, the sample in the present study represents a younger and leaner group of individuals living with SCI. The sample’s average age was 38 (sd 12) years, average BMI was 23·6 (sd 4·6) and the average waist circumference was 82·9 (sd 12·9) cm. On average, the sample was well below the aforementioned cut-offs for individuals with SCI, suggesting that their body fat is lower than is observed among older individuals with SCI. Also not accounted for in our report was the fact that few of our participants reported alcohol consumption which is ignored in our analysis as the Nutrition Data System for Research software treats alcohol independently. This may be relevant due to the reported high alcohol consumption in SCI and its association with increased adiposity, especially central adiposity(Reference Garrison, Clifford and Gleason77–Reference Park, Lee and Lee82). While seemingly a small sample for this type of analysis, it is a relatively large sample when considering this specific population(Reference Blight, Hsieh and Curt83). However, this relatively large sample did not allow for a sufficient sample size to control for covariates such as LOI or time since injury. Therefore, the results of this study should be viewed as exploratory results that can inform future work in larger trials. Moreover, physical activity levels were not measured in the present study. Because physical activity is a determining factor of body composition, this should be considered a major limitation of the present study. Lastly, distinct types of macronutrients were not investigated in the present study (e.g. saturated v. unsaturated fat and simple v. complex carbohydrates). Due to the aforementioned limitations, caution should be used when interpreting these findings. Future work should further examine the relationships between physical activity levels, body composition and macronutrient and micronutrient intake in persons with chronic SCI.
Conclusions
Carbohydrates appear to play an important role in body composition among individuals with SCI, and lower carbohydrate intake seems to be associated with higher fat mass. This may be related to the changes in fat and carbohydrate metabolism as well as the reported increase in fat consumption that occurs following SCI. Traditional approaches have examined the associations of one dietary factor at a time as opposed to examining the complex interactions among many nutritional factors. Using the GFN, we examined associations between several dietary factors and multiple measures of body composition. Regardless of the body composition measure used, carbohydrates were consistently inversely related to measures of body fatness. Therefore, these results using the GFN lay the foundation to more holistically address dietary behaviours and body composition changes among individuals with chronic SCI. Because carbohydrate intake appears so influential in this population, additional research is needed to determine how carbohydrate type and physical activity influence body composition and cardiometabolic health after SCI.
Acknowledgements
The authors would like to thank Drs. Rahul Gokarn and Devin Wahl for their guidance in navigating the GFN analysis techniques employed in this work.
This work was funded by the USA Department of Veterans Affairs Rehabilitation Research and Development Service Career Development Award–Panel II (VA-RRD-CDA-2) (grant no. 51K2RX000732–05) and the USA Department of Defense Congressionally Directed Medical Research Program (DOD-CDMRP) (grant no. W81XWH-15–1–0671).
J. A. G.: helped writing the original draft, reviewed scientific evidence and scientific writing, summarised research findings, helped writing and editing, developed figures, and organised and approved the final version. M. E. H.: helped writing the original draft, assisted with the development of the research hypothesis, helped data curation, provided formal analysis, provided critical feedback, developed figures, reviewed scientific evidence, helped editing and approved the final version. P. P.: provided critical feedback, helped editing and approved the final version. R. E. K.: provided critical feedback and data curation, helped editing and approved the final version. A. N. E.: provided critical feedback, helped editing and approved the final version. A. S. G.: provided funding acquisition, developed the research hypothesis, submitted the initial proposal, reviewed scientific evidence, helped writing and editing and approved the final version.
The authors have no conflicts to report.