

Introduction
The regional pattern of snow accumulation is a central variable when investigating the evolution of polar ice sheets and their sensitivity to climate change. Direct measurements of surface mass balance in these remote areas of the ice-sheet interior are sparse, and estimates of past accumulation rates rely on results from ice cores, limiting the spatial coverage to the vicinity of these sites. Information from radio-echo sounding (RES) surveys provides information about the ice thickness and internal structure of polar ice sheets. The RES data contain internal layering that is assumed to be isochrones (e.g. Reference SiegertSiegert, 1999). The stratigraphy and depths of the layers are a result of past ice flow and the pattern of accumulation through time (e.g. Reference Jacobel, Gades, Gottschling, Hodge and WrightJacobel and others, 1993; Reference Nereson, Raymond, Jacobel and WaddingtonNereson and others, 2000; Reference Parrenin and HindmarshParrenin and Hindmarsh, 2007). Due to the extensive spatial coverage of the RES surveys, the past accumulation pattern can be investigated in large areas through analysis of these data. Numerous studies (e.g. Reference Fahnestock, Abdalati, Luo and GogineniFahnestock and others, 2001; Reference Baldwin, Bamber, Payne and LayberryBaldwin and others, 2003; Reference SiegertSiegert, 2003; Reference Siegert and PayneSiegert and Payne, 2004; Reference Waddington, Neumann, Koutnik, Marshall and MorseWaddington and others, 2007; Reference Huybrechts, Rybak, Steinhage and PattynHuybrechts and others, 2009; Reference MacGregor, Matsuoka, Koutnik, Waddington, Studinger and WinebrennerMacGregor and others, 2009; Reference Leysinger Vieli, Hindmarsh, Siegert and BoLeysinger Vieli and others, 2011) have investigated the potential of the internal layers as constraints for inferring past accumulation rates and have successfully derived accumulation patterns from the observed structure of the internal layers. So far, most studies have focused analyses along specific RES lines, often following flowlines (e.g. Reference Waddington, Neumann, Koutnik, Marshall and MorseWaddington and others, 2007; Reference Huybrechts, Rybak, Steinhage and PattynHuybrechts and others, 2009), though a few studies have extended the analysis in regions with multiple lines to infer the two-dimensional accumulation pattern of a region or along multiple lines (e.g. Reference Baldwin, Bamber, Payne and LayberryBaldwin and others, 2003; Reference MacGregor, Matsuoka, Koutnik, Waddington, Studinger and WinebrennerMacGregor and others, 2009; Reference Leysinger Vieli, Hindmarsh, Siegert and BoLeysinger Vieli and others, 2011). The use of multiple layers additionally allows an investigation of the temporal variation in the accumulation pattern (e.g. Reference Huybrechts, Rybak, Steinhage and PattynHuybrechts and others, 2009; Reference Leysinger Vieli, Hindmarsh, Siegert and BoLeysinger Vieli and others, 2011).
In this study, we investigate the potential for large-scale reconstructions of average accumulation rates from the depth of internal layers mapped in two dimensions. We use the depth of a distinct climate transition at 14.7 ka BP identified in the central and northern region of the Greenland ice sheet to estimate the average accumulation rates for this period. This layer is precisely dated at ice-core sites in north Greenland (NGRIP Members, 2004) to an age of 14.7 ± 0.2 ka (Reference RasmussenRasmussen and others, 2006), and it has been identified in a large number of RES lines and subsequently mapped in north and central Greenland by Reference Karlsson, Dahl-Jensen, Gogineni and PadenKarlsson and others (2013) (Fig. 1). The reconstruction of the large-scale average accumulation pattern is formulated as an inverse problem constrained by the traced layer depth mapped in two dimensions, thus significantly expanding the study area compared to the majority of previous studies. As the age of the layer is well constrained, a robust estimate of the accumulation rate in addition to the spatial pattern can be obtained. Due to the depth and spatial extent of this layer, which includes areas far from the interior, horizontal gradients in ice thickness and accumulation rates are expected to influence the layer geometry significantly and must be included in the analysis (Reference Waddington, Neumann, Koutnik, Marshall and MorseWaddington and others, 2007; Reference Leysinger Vieli, Hindmarsh, Siegert and BoLeysinger Vieli and others, 2011). Thus, we are able to investigate the effect of spatial variations in ice thickness, accumulation rates and horizontal velocities on the inferred average accumulation rates by solving the problem using two different approaches: (1) a local approach, where the problem is approximated by a one-dimensional (1-D) problem, thus including only the local vertical flow in the analysis, and (2) formulating the problem using inverse techniques in order to also include effects from horizontal flow. Due to the horizontal flow, the inverse problem is ill-posed, as the depth of the layer at a given location is determined by the integrated effect of the accumulation rates and ice flow in the upstream area, so the solution will typically be non-unique. The inverse problem is therefore regularized by a smoothness constraint to achieve a wellposed problem, and as a result only large-scale features of the accumulation pattern can be resolved by the inversion.
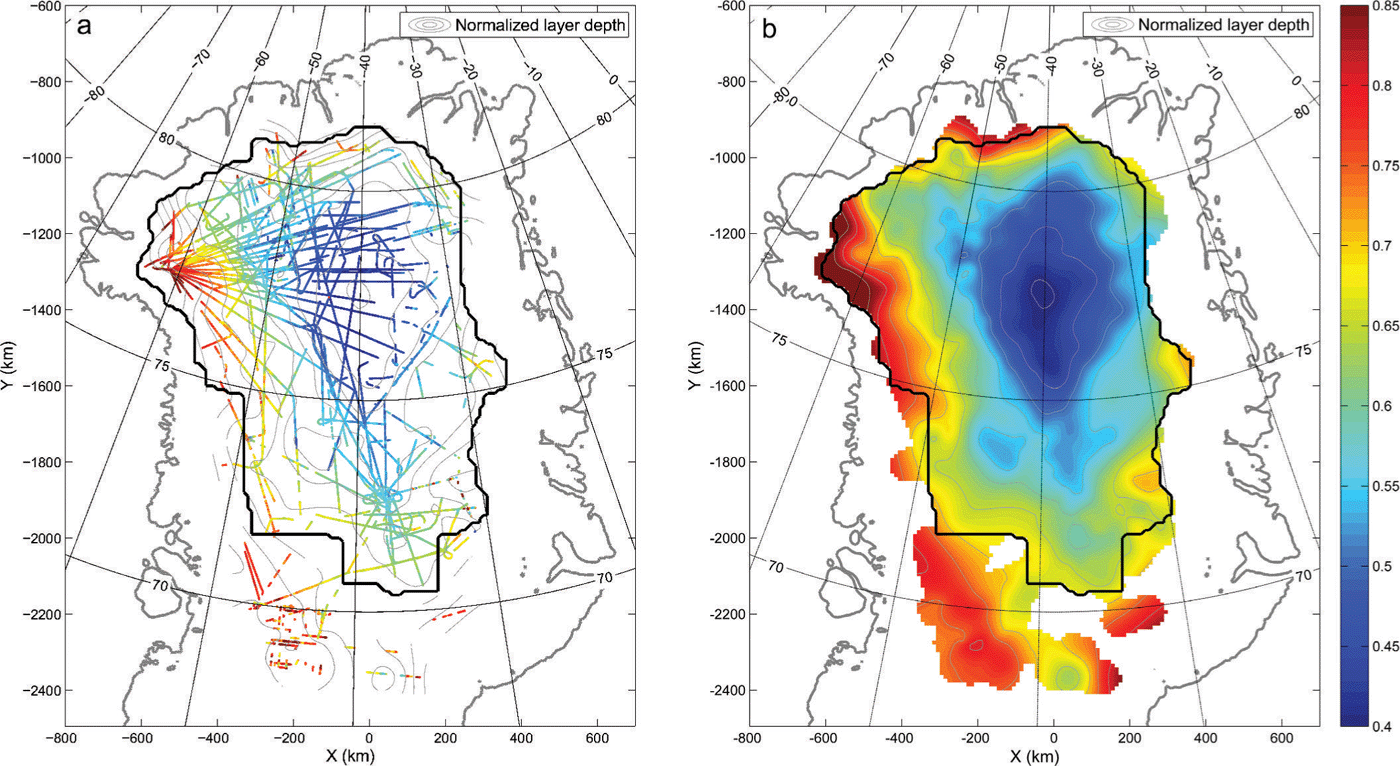
(a) Normalized depth of the traced 14.7 ka layer in north and central Greenland along individual RES flight lines, and (b) the interpolated depth of the layer mapped to a 10 km grid in the region using linear interpolation. The black line indicates the domain of the analysis.
Data
This study is based on RES data collected since 1993 by the Center for Remote Sensing of Ice Sheets (CReSIS), University of Kansas, USA (e.g. Reference GogineniGogineni and others, 2001). The CReSIS radars used for data collection operated at a centre frequency of 150 MHz (in the years 1993–2008) and 195 MHz (in 2010–12) and errors in the radar-derived ice thickness are typically within 10m in central Greenland (Reference Gogineni, Chuah, Allen, Jezek and MooreGogineni and others, 1998, Reference Gogineni2001). The RES dataset shows clear internal layering, and comparisons with ice-core records (NGRIP Members, 2004) have allowed for dating of many of these internal layers. In Reference Karlsson, Dahl-Jensen, Gogineni and PadenKarlsson and others (2013) the chronology from the NorthGRIP ice core, from which the pronounced climate transition is dated to 14.7 ± 0.2 ka (Reference RasmussenRasmussen and others, 2006), was used to identify the transition in >400 RES flight lines (Reference Karlsson, Dahl-Jensen, Gogineni and PadenKarlsson and others, 2013; data available at www.iceandclimate.nbi.ku.dk/data). For the work presented here, the dataset has been expanded by tracing the layer in additional flight lines in order to improve the coverage in the southwestern and northeastern areas (cf. Reference Karlsson, Dahl-Jensen, Gogineni and PadenKarlsson and others, 2013, fig. 3). The traced layer depth along the individual lines is presented in Figure 1a.
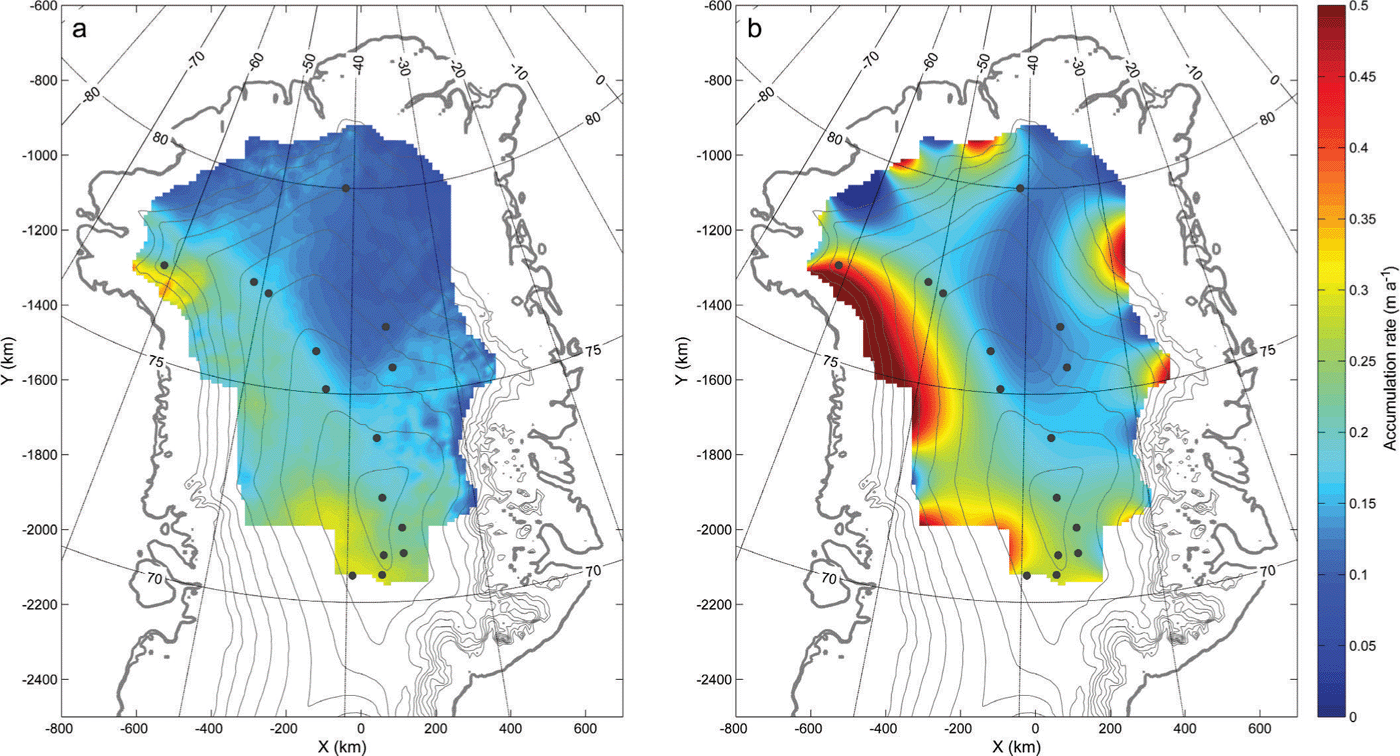
Accumulation rates recovered from the mapped depth of the 14.7 ka layer solving the LLA problem (a) and the deep-layer problem (b). Ice-sheet surface topography contours are shown as thin grey lines. Locations of deep and intermediate ice cores (see Table 1) are marked by dark grey points.
(a) Misfit between modelled and observed layer depth, normalized by local ice thickness, for the final accepted solution for accumulation rates from the deep-layer problem. The values correspond to a misfit of less than ± 50 m in most areas, with the exception of the northwestern region where higher misfit values reaching up to ± 100 m are found. (b) Histogram of the data residuals, normalized by the estimated uncertainty of the layer depth, compared to a normal distribution with unit width given by the red line.

The evaluated layer depth along the individual radar lines is interpolated onto a 10 km grid that is used as data constraint in the inverse formulation of the problem. A maximum distance of 60 km to the nearest flight line is allowed in the interpolation. The domain of the analysis is constrained by requiring ice to flow outward at all horizontal boundaries. Consequently, regions where the layer depth is not constrained by data in the upstream area are excluded (Fig. 1). By interpolating onto the regular grid using linear interpolation, the layer depths are smoothed, removing features that are not expected to reflect effects of the long-term average accumulation pattern, but rather arise from ice dynamics and basal processes on smaller spatial scales (e.g. variations in basal melting). These effects are not included in the forward model, although they may potentially affect the depth of the transition. No uncertainty was assigned to the traced layer depth along the individual radar lines. The uncertainty of the gridded layer depth is estimated as the mean of the absolute deviation between the traced depth along individual radar lines and the depth predicted by the gridded layer. This results in an uncertainty of the layer depth of 1.77% of the local ice thickness, applied in the entire model domain, which corresponds to an uncertainty on the layer depth in the range 15–55 m, depending on the ice thickness. The uncertainty of the layer depth due to the age uncertainty is evaluated by modelling the depth of the layer within the age bounds given by the dating. This uncertainty is found to be about five times smaller than the uncertainty of the gridding and is therefore neglected in the analysis. The depth of the gridded layer is presented in Figure 1b.
Method
Inferring past accumulation rates from an isochronous layer is an inverse problem, the solution of which requires both an appropriate inversion technique and a suitable forward model for describing the problem (Reference Waddington, Neumann, Koutnik, Marshall and MorseWaddington and others, 2007). For the problem at hand, the unknown model parameters are the accumulation rates at each gridpoint within the domain covered by the mapped layer. The problem is constrained by the observed depth of the layer, and the modeled layer depth is related to the accumulation rates and ice flow by the forward model for the problem. Following Reference Waddington, Neumann, Koutnik, Marshall and MorseWaddington and others (2007), the accumulation rates, p, that minimize the misfit between observed and modelled layer depth are found by iteration following the local gradient of the data residuals in the model space. An additional constraint regarding smoothness of the accumulation parameters is further imposed to avoid unphysical solutions and over-fitting of data beyond what can be justified by the data uncertainty (Reference Waddington, Neumann, Koutnik, Marshall and MorseWaddington and others, 2007). The weight of the smoothing term compared to the misfit term in the minimization is chosen, such that the total misfit between the modelled layer depth and the data, normalized by the uncertainty in the layer depth, attains a given tolerance level. The tolerance level is estimated as ![]() with N being the number of data points. Imposing these two criteria for the minimization thus results in the smoothest solution for the unknown accumulation parameters, while fitting the data constraint within the estimated uncertainty of this (Reference Waddington, Neumann, Koutnik, Marshall and MorseWaddington and others, 2007). The correction to the accumulation rates, △p, for each step in the iteration can then be expressed as (eqn 22 of Reference Waddington, Neumann, Koutnik, Marshall and MorseWaddington and others, 2007)
with N being the number of data points. Imposing these two criteria for the minimization thus results in the smoothest solution for the unknown accumulation parameters, while fitting the data constraint within the estimated uncertainty of this (Reference Waddington, Neumann, Koutnik, Marshall and MorseWaddington and others, 2007). The correction to the accumulation rates, △p, for each step in the iteration can then be expressed as (eqn 22 of Reference Waddington, Neumann, Koutnik, Marshall and MorseWaddington and others, 2007)
where Jc and Jr is the Jacobian matrix for the smoothness and the data residuals respectively; combined they correspond to the gradient of the data misfit, constrained by the smoothness of the accumulation solution, with respect to the accumulation parameters in p. The smoothness of the accumulation parameters, c, is estimated as the second derivative of p, and r is the normalized data residuals given by the difference between the modelled and observed layers, normalized with the uncertainty of the observed layer depth. Wc and Wr are weight matrices for the two different terms, determined by the trade-off between model smoothness and minimizing data misfit.
In order to investigate the effect of accounting for upstream conditions in the analysis, the inverse problem was solved using two different forward models: one accounting for both the horizontal and the vertical flow of the ice, and one where the horizontal flow was neglected. Adopting the notation of Reference Waddington, Neumann, Koutnik, Marshall and MorseWaddington and others (2007), we refer to the first problem as the deep-layer problem and the second as the local-layer approximation (LLA). As the data constraint is the depth of a single layer, the LLA problem can be solved directly and no smoothness constraint is required, whereas the deep-layer analysis, where horizontal flow is included, requires the solution of the inverse problem.
The forward model of the problem calculates ice dynamics and the depth of isochronous layers within the ice sheet given appropriate boundary conditions, including the accumulation rate parameters. In order to reduce the computational demands for the problem at hand, a simple and computationally inexpensive forward model is needed (Reference Waddington, Neumann, Koutnik, Marshall and MorseWaddington and others, 2007). The forward model assumes a steady-state ice-sheet geometry, with ice flow given by balance velocities for the depth-integrated horizontal flow (Reference Budd and WarnerBudd and Warner, 1996), and with the vertical variation of the horizontal and vertical flow described by the shape function for isothermal internal deformation (Reference HindmarshHindmarsh, 1999, Reference Hindmarsh2001), so the model does not include basal sliding (see Discussion). The depth of the transition is evaluated by tracing the depth of the layer as it evolves with time using a semi-Lagrangian scheme. For the assumed steady-state ice-sheet geometry, the present ice-sheet thickness and bedrock topography from Reference Bamber, Layberry and GogineniBamber and others (2001) were used.
The applied inversion technique is a gradient-type method, so the final, accepted solution will in general depend on the initial guess (Reference Aster, Borchers and ThurberAster and others, 2013). To assess the sensitivity of the final solution to different initial conditions, three different accumulation fields were used as starting guesses: the accumulation rates derived from the LLA problem, the present accumulation field of the Greenland region (Reference EttemaEttema and others, 2009) and a spatial uniform field with an accumulation rate of 0.15ma–1.
Results
The reconstructed accumulation rates from the local- and the deep-layer inversions are presented in Figure 2, with the misfit between the modelled and observed layer depth of the final solution of the deep-layer problem shown in Figure 3. All three initial accumulation guesses tested for the deep-layer inversion converged towards the same final solution, with a mean difference of 0.01 ma–1 or less in inferred accumulation rates between the individual solutions, increasing our confidence in the assumption that the solution of this problem is well defined when using the gradient method. The largest differences were observed 50–100 km from the boundary of the model domain, where differences reached up to 0.05ma–1. Along the domain boundary upstream of the outlet of the northeast Greenland ice stream (NEGIS), these differences were found to reach 0.1 m a–1. Reference Waddington, Neumann, Koutnik, Marshall and MorseWaddington and others (2007) found that the resolving power of the inverse problem decreases with distance from the divide. This is due to the increase in horizontal velocities, since the layer depth is then affected by varying accumulation rates in large upstream regions, limiting the information retained in the layer structure on accumulation variations on shorter horizontal scales. The reduction in resolving power is evident when considering the solutions obtained from different initial conditions. The differences between the solutions increase toward the boundary of the domain where the horizontal velocities generally are larger, similar to the results by Reference Waddington, Neumann, Koutnik, Marshall and MorseWaddington and others (2007). However, since the differences between the results from different initial conditions agree within 0.05 m a–1 in these areas, this gives some confidence that the layer shapes retain distinct information about the large-scale accumulation pattern near the margin.
The solution of the LLA problem (Fig. 2a) shows low accumulation rates in the central interior and towards the northeast of about 0.1–0.15 m a–1 and an area of higher accumulation rates reaching 0.25 m a–1, in some areas up to 0.3 m a–1, along the western and southern parts of the investigated domain. In contrast, the result of the deep-layer problem shows higher accumulation rates along the western boundary of the area, exceeding 0.4 m a–1. The central parts are characterized by low accumulation rates, similar to the LLA analysis, and a gradient in the pattern of accumulation rates, with increasing rates towards the west across the central ice divide. Along the boundary, especially towards the northern part of the domain and at the outlet of the NEGIS, strong spatial variations in accumulation rates are inferred for the deep-layer problem. These variations are found in the areas where the difference between the solutions starting from different initial conditions is largest. This could be the result of the reduced resolving power in this inverse problem as discussed above, so only large-scale features of the accumulation pattern can be resolved.
Several deep and intermediate ice cores have been drilled in the interior of the ice sheet and this allows for a comparison between the inferred and the estimated accumulation rates based on analysis of these cores. The results of this comparison are shown in Table 1. From this, the inferred accumulation rates of both problems are found to agree well with the estimates from ice cores along the central ice divide. The differences between the ice-core estimates and the inferred accumulation rates are in the order of a few cm a–1 for most sites. The inferred accumulation rates from the deep-layer solution are generally distributed evenly between too high and too low compared to the ice-core estimates, whereas the inferred rates from the LLA problem are generally lower. The results given in Table 1 are further discussed in the next section.
Inferred accumulation rates at ice-core sites in northern and central Greenland from the LLA problem (ḃ LLA) and the deep-layer problem (ḃ inv) compared to estimates of long-term average accumulation rates from ice cores. Sites are ordered by latitude starting from the highest.

The spatial pattern of the data residuals, i.e. the misfit between the modelled and observed layer depths, of the final solution of the deep-layer problem is shown in Figure 3. There is no apparent spatial bias in the data residuals, though they are found to correlate over distances of 50–100 km. The smoothness constraint minimizes the second derivative of the accumulation rates, so only large-scale patterns of the accumulation rates are reconstructed while some small-scale structures in the layer depth are not fitted exactly. For a smaller uncertainty of the layer depth, the weight of the smoothing term would be smaller so the model would be allowed to fit the smaller structure of the observed layer in more detail. A histogram of the data residuals, normalized by the estimated uncertainty of the layer depth, shows the distribution approximately follows a normal distribution with a width of one, as expected. However, the central peak is narrower, indicating a larger contribution from large data residuals at the tails of the distribution when evaluating the global misfit. These larger values of the misfit between the modelled and observed layer depths are mainly found in the northwestern part of Greenland. This could suggest that some of the assumptions of the forward model might be inadequate to reproduce the observed layer depth in this region.
Discussion
The difference in the inferred accumulation rates between the LLA solution and the solution of the deep-layer problem is shown in Figure 4. The difference has a distinct spatial pattern, and the largest differences are found to correlate with areas with larger horizontal flow, especially towards the margin where the inferred accumulation rates for the deep-layer solution are up to twice as high as those inferred for the LLA solution. The large difference implies that horizontal ice flow influences the internal layering and therefore the estimates of past accumulation rates and the uncertainty of such estimates. By solving the inverse problem where horizontal flow is included, the effect of horizontal flow on the layer depth is taken into account and the areas where the problem is ill-posed, and therefore associated with larger uncertainties, can be identified.
(a) Difference between the inferred accumulation rates for the deep-layer and LLA problems (m a–1; see colour scale). Ice-core locations are indicated by points. Overlaid are contours of the starting position of particle trajectories, which would exit the model domain at given times during the time integration. Contours are shown for every 2 ka, with the contour for 14.7 ka shown in bold. Particle trajectories are seen to exit the model domain earlier in areas of higher horizontal flow along the western margin and in the region of the NEGIS. The contours are further seen to correlate with the largest differences between the two inferred accumulation patterns.
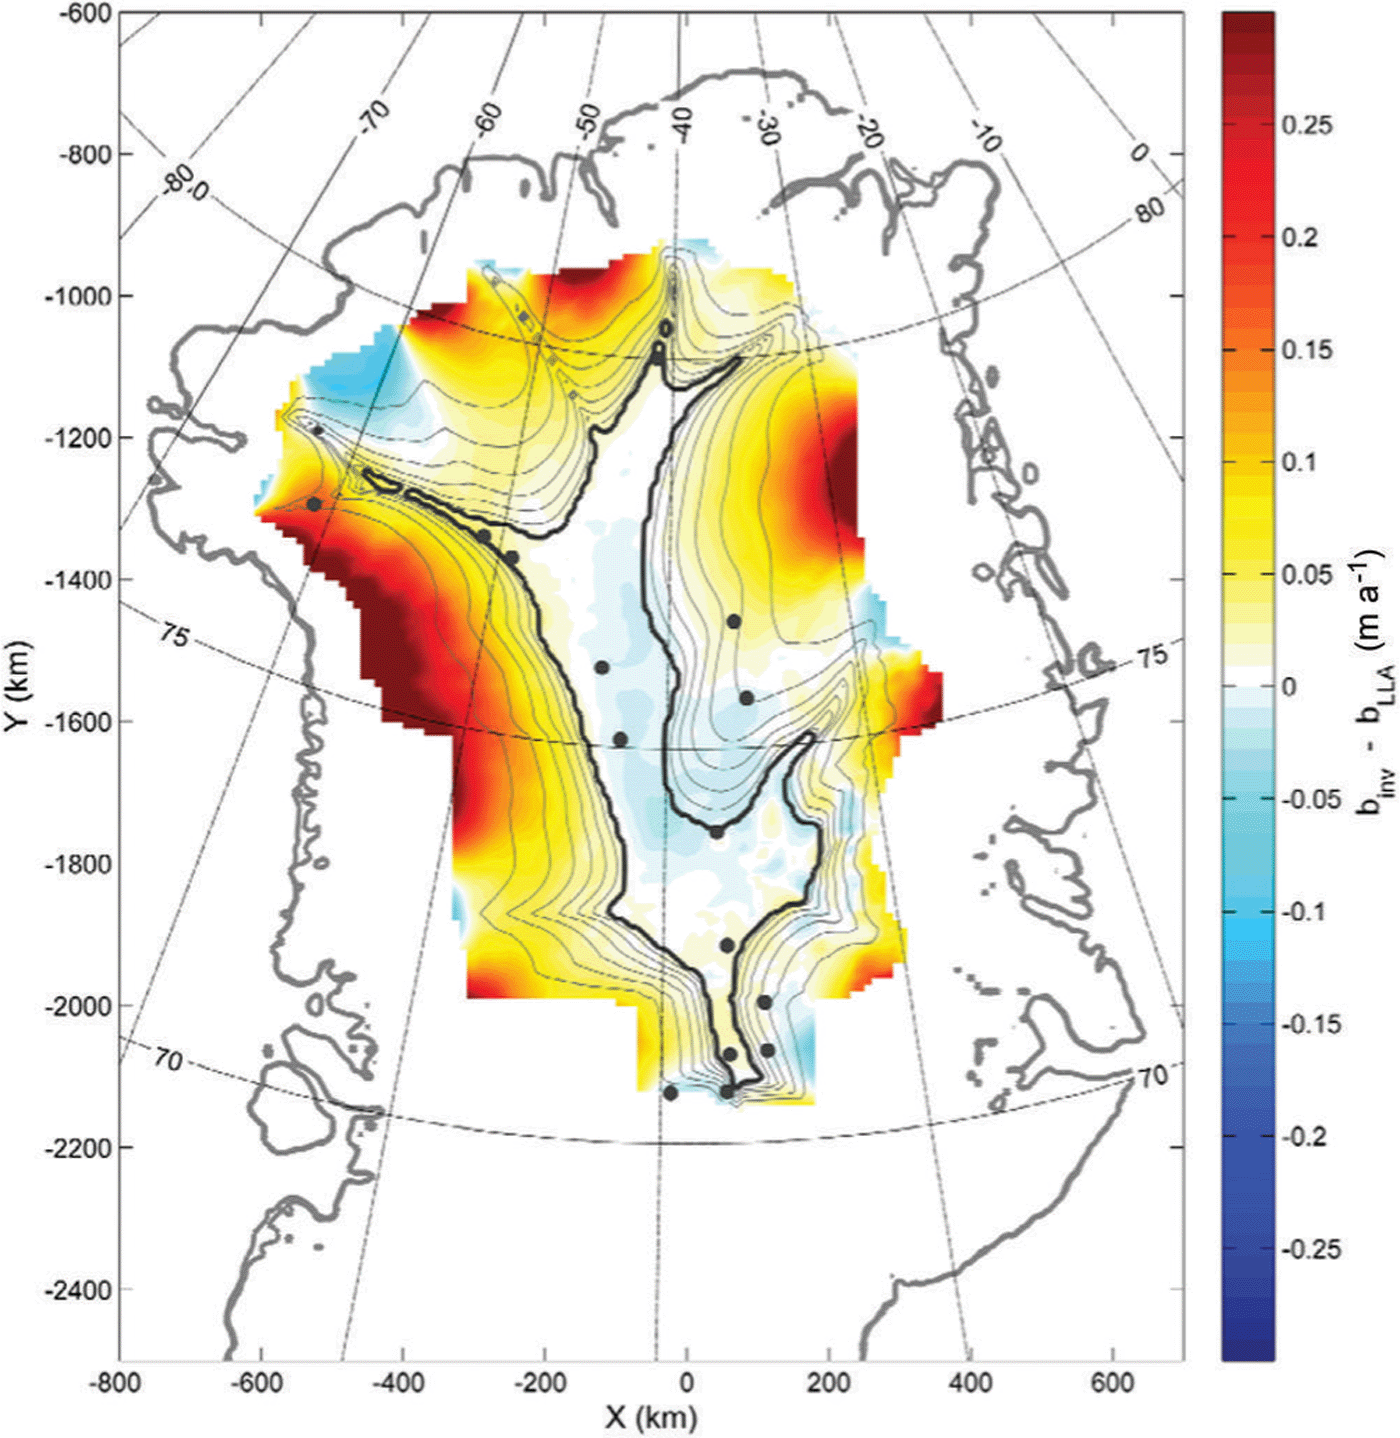
In areas with a spatially varying accumulation pattern, the layer depth at a given location will reflect the integrated effect of the accumulation rates along the upstream trajectory, which the ice particle at this depth has followed since deposition at the surface (Reference Cuffey and PatersonCuffey and Paterson, 2010). Thus, to obtain the same depth at a location downstream of an area of lower accumulation, a higher accumulation would be required when accounting for horizontal flow compared to that required when accounting for local vertical flow only. Neglecting horizontal flow in the analysis would therefore lead to an underestimation of the average accumulation rates in such areas. This effect is seen when comparing the solutions of the two different formulations of the inverse problem: the 1-D analysis generally results in lower accumulation rates in areas downstream of the lowaccumulation areas in the central part of the domain.
In areas of horizontal velocities on the order of 5–10 m a–1 the lengths of particle trajectories associated with the 14.7 ka layer are in the order of 75–150 km. Since the layer depth is determined by the integrated effect of the accumulation rates and flow along these trajectories, its sensitivity to changes in the local accumulation rate is found to be lower in areas with fast horizontal flow than in areas with slow flow due to the longer trajectories. The solution for the accumulation rates becomes non-unique in these areas, and only large-scale features can be resolved. Additionally, Reference Steen-Larsen, Waddington and Koutnik2010Steen-Larsen and others () found larger uncertainties in areas where particle trajectories exited the data domain before the age of the layer had been reached, and these uncertainties increased towards the boundary of the domain. The accumulation rate at a given location will affect the depth of an internal layer in the area downstream of the location. This area can be estimated by considering the trajectory of a particle starting at the ice surface and following the flow. In regions where particle trajectories exit the domain early during the time integration, part of the area where the accumulation rate will affect the layer depth lies outside the model domain, so there are fewer data points to constrain the accumulation rate. The inverse problem in these regions is thus more ill-posed than in regions where the particles do not exit the domain. The effect will be largest for points close to the model domain, as larger parts of the area where the accumulation rates influence the layer depth are outside the model domain. The regions where the solution will be affected by this increased uncertainty were identified by calculating the time it takes for particles following the flow and starting at each gridpoint to exit the domain. Trajectories were found to exit the domain prior to the end of the time integration (i.e. before 14.7 ka) in 80% of the domain due to the relatively high age of the layer compared to the horizontal flow velocities. The inverse problem is thus ill-posed in much of the model domain, and the smoothness constraint is constraining the solution for the accumulation rates, causing only large-scale features of the accumulation pattern to be resolved. This is also supported by the differences between the solutions with different initial conditions. While the same large-scale pattern was recovered in all solutions, variations on shorter length scales were found 50–100 km from the domain boundary. Contours of the starting position of particles that exit the model domain at given times during the time integration indicate the regions where horizontal flow affects the layer depth, and are found to correlate with areas where the difference between the two solutions is largest (Fig. 4). This could be due to several effects in these regions, affecting both solutions. In regions of moderate and high horizontal velocities, the assumption of local flow, on which the LLA is based, becomes problematic as upstream effects affect the layer depth. Thus, the inferred accumulation rates from the LLA are very uncertain. For the deep-layer formulation, the inferred accumulation rates are less constrained by the layer depth due to the long and frequently exiting particle trajectories, resulting in a more ill-posed inverse problem in these areas, as discussed above. Additionally, the forward model may be less realistic in these areas because it neglects basal sliding, and this will affect both solutions. The inferred accumulation rates are thus associated with larger uncertainties in regions of considerable horizontal flow; for the LLA the principal assumption becomes invalid as ice does not originate locally. For the deep-layer formulation of the problem, where the simplifying assumption of local flow is not made, the uncertainties are mainly associated with the effect of longer particle trajectories causing the inverse problem to become ill-posed in these regions. These uncertainties would decrease for younger layers.
In order to limit the set of unknown parameters to infer only the surface accumulation, which additionally leads to a computationally inexpensive model, several simplifying assumptions were invoked in the forward model. It is assumed that the ice sheet is in steady state and that the velocity field can be described by spatially uniform shape functions. However, in areas close to the ice-sheet margin, these assumptions may result in an inadequate description of the ice flow dynamics, particularly in regard to the lack of basal sliding and melting, and possible changes in ice-sheet geometry during the past 14.7 ka. The limitations of the forward model and the associated assumptions should therefore be kept in mind when interpreting the inferred accumulation rates, especially since the accumulation rates are the only variable parameters. This means that any structure in the layer depth will be interpreted in terms of accumulation rates, although some structures might originate from flow dynamics or other processes that are not properly resolved in the forward model.
Ice flow characterized by basal sliding will generally result in deeper layers than internal deformation in the deeper parts of the ice column (Reference Leysinger Vieli, Hindmarsh and SiegertLeysinger Vieli and others, 2007). However, as basal sliding was neglected in the forward model, any layer depths influenced by such dynamics would instead be attributed to increased accumulation rates. Basal dynamics are spatially heterogeneous, with basal sliding contributing significantly to the flow in the region of the NEGIS, upstream of other outlet glaciers and along the western margins (e.g. Reference Rignot and MouginotRignot and Mouginot, 2012). The high accumulation rates inferred upstream of the NEGIS are likely a result of this effect and it might also contribute in part to the very high accumulation rates inferred along the boundary in the western part of the domain. As a simple test for the effect of basal sliding, the vertical velocity profile in the forward model was changed to a profile for plug flow, corresponding to uniform horizontal velocity with depth, in the entire model domain, and the accumulation rates were inferred using this model. This results in generally lower accumulation rates over the entire domain, with a mean difference of 0.06 m a–1. The general pattern of the accumulation rates was similar, though the amplitude of variations was found to be smaller. The difference between these two solutions of the deep-layer problem is of the same order of magnitude as the difference between accumulation rates inferred from the deep-layer problem and the LLA. This simple test illustrates the sensitivity of the inferred accumulation rates to the choice of the general dynamics of the ice flow, here expressed through the chosen shape functions describing velocity fields. It further indicates the need for constraining the ice flow dynamics in order to reduce the uncertainties when inferring past accumulation rates using internal layers.
A further simplifying assumption of the forward model is the constant ice-sheet geometry. Studies of the surface elevation during the past 8 ka at sites of several ice cores in the interior of the Greenland ice sheet by Reference Lecavalier, Milne, Vinther, Fisher, Dyke and SimpsonLecavalier and others (2013) suggest that changes in the interior are in the order of 100m during this period, whereas sites closer to the margin have experienced elevation changes of up to 300 m. Thus, the assumption of a constant ice-sheet geometry is reasonable in the central parts of the investigated domain, but is unlikely to hold in the parts of the model domain closer to the ice-sheet margin. This increases the uncertainty of the inferred accumulation rates in these areas. Changes in ice-sheet geometry could in part be the reason for the large misfit between the modelled and the observed layer depth in the northwestern part of the domain.
Records derived from deep and intermediate ice cores drilled in the interior of the Greenland ice sheet show that the accumulation rates in the investigated region have varied during the period covered by the age of the layer. However, the inferred accumulation rates reflect an average of the last 14.7 ka, as the depth of isochronous layers depends on the cumulative effect of the accumulation, so an analysis based on a single layer can only yield an estimate of average conditions. The inferred accumulation pattern from the deep-layer solution resembles the general pattern of the present accumulation field (e.g. Reference EttemaEttema and others, 2009; Reference BurgessBurgess and others, 2010), in contrast to the local-layer solution, which lacks especially the area of higher accumulation rates west of the central ice divide and the associated strong gradient. This, along with the large differences between the two solutions, suggests that upstream effects have influenced the depth of the mapped layer considerably. Finally, we emphasize that while the inferred accumulation rates resemble the present accumulation rates, the inferred accumulation rates are an average over the past 14.7 ka in which the climate of the region and that of the ice sheet have changed in response to the end of the last ice age.
The alignment of the inferred accumulation pattern with the surface topography of the ice sheet, with a pronounced gradient in accumulation rates across the central ice divide, could indicate that the topography of the ice sheet has influenced the average accumulation pattern persistently in the studied area during the past 14.7 ka. However, the use of the present ice-sheet geometry in the forward model might affect the inferred accumulation pattern, as the direction of the horizontal flow based on balance velocities is dictated by the surface slope. The present ice-sheet topography is thought to influence the accumulation pattern over the Greenland ice sheet due to orographic lifting of air masses and the influence on the local circulation patterns (Reference Ohmura and ReehOhmura and Reeh, 1991; Reference Hakuba, Folini, WIld and SchärHakuba and others, 2012). Studies using climate models to reconstruct the past atmospheric circulation of the region have found differences between preindustrial and early-Holocene accumulation rates in the order of several centimetres in the central parts of northern Greenland due to changes in topography (Reference Merz, Raible, Fischer, Varma, Prange and StockerMerz and others, 2013). However, several extensively mapped internal layers at different depths, and therefore different ages, are required to investigate whether these effects can be resolved in the internal layer structure in addition to using a forward model with a changing ice-sheet topography. This is beyond the scope of this study, but could be pursued in future work.
In the interior, the inferred accumulation rates can be compared to estimates of long-term average accumulation derived from deep and intermediate ice cores (Table 1). It should be noted that the long-term average accumulation rates estimated from ice cores are averages based on only several hundreds to thousands of years, and thus do not cover the entire 14.7 ka period. Even so, the inferred accumulation rates from both the LLA and the deep-layer problem agree well with the ice-core estimates, demonstrating the ability of the inverse method to correctly reproduce the average accumulation rates in the interior regions. Unfortunately, the locations of most of the ice-core estimates are within the area where differences between the results of the two inversions are small (see Fig. 4), so evaluating the effect of including upstream flow in the analysis is not possible from this comparison.
Including data from multiple shallow layers to constrain this problem would make it a better-posed problem, and would improve the ability to resolve spatial variations in accumulation rates across the model domain. Ideally, additional data constraints would contain sufficient information to extract both the accumulation rates in the investigated domain and dynamic conditions of the ice flow, such as basal sliding and other parameters describing the velocity field, as the latter are found to affect the inferred accumulation rates. Shallow layers would be preferable for several reasons: they are younger, so the ice would originate more locally, reducing the problem of long particle trajectories, which leads the inverse problem of the deep-layer formulation to become less well posed, especially closer to the boundary of the domain. Additionally they will most likely be less influenced by basal conditions, and finally, by inferring the average accumulation of a shorter period, the validity of the steady-state assumption would improve. However, the potential information on accumulation rates further back in time is only retained in the older layers. A potentially extended set of multiple internal layers as data constraints would warrant the application of a more sophisticated forward model that would be able to capture a variety of basal conditions, including basal sliding and melting, and possible changes in ice-sheet topography.
Conclusion
We have inferred the average accumulation rates in central northern Greenland from the depth of a 14.7 ka old layer. The problem was formulated as an inverse problem, and, by using two different forward models, one in which only the vertical component of the velocity was used, and one in which both the vertical and horizontal components of the velocity field were used, to model the layer depth, the effect of including upstream effects in the analysis was investigated. Following the formulation of Reference Waddington, Neumann, Koutnik, Marshall and MorseWaddington and others (2007), the analysis applying the first model corresponds to the LLA formulation and the second to the deep-layer formulation. The large-scale pattern of the inferred accumulation rates for both problems was found to be aligned with the surface topography of the ice sheet, with higher accumulation rates west of the central ice divide and lower rates in the central and northeastern part of the investigated area. It was found that accounting for upstream effects on the depth of the layer, caused by spatial variations in accumulation rates and ice thickness, results in considerably different estimates for the average accumulation rates. The solution where horizontal flow was neglected resulted in a reduced contrast between accumulation rates in the central interior and further towards the margins compared to the solution of the deep-layer problem. In the vicinity of the model domain boundary, the inferred accumulation rates were found to be associated with larger uncertainties due to limitations of the forward model and the effects of the larger horizontal velocities, which causes the assumption of the LLA to become invalid, and the deep-layer problem to become ill-posed. However, our results from the deep-layer problem indicate that the layer does contain information about the large-scale accumulation pattern in these areas. In line with the conclusion of Reference Waddington, Neumann, Koutnik, Marshall and MorseWaddington and others (2007), the results of this study therefore suggest that the effects of upstream variations, especially in areas with large horizontal gradients in accumulation rates or considerable horizontal ice flow, should be included when retrieving estimates of past accumulation from deep internal layers.
Acknowledgements
This work is supported by the Danish National Research Foundation under the Centre for Ice and Climate, University of Copenhagen. N.B.K. is supported by European Research Council grant No. 246815 ‘Water Under the Ice’. We acknowledge the use of RES data and data products from CReSIS, University of Kansas. We thank Michelle Koutnik, an anonymous reviewer and the editor, Gwendolyn Leysinger Vieli, for thorough and insightful comments that substantially improved the manuscript.


