


Introduction
Food inflation is back on the global economic agenda after the 2007–2008 global food crisis, this time primarily due to the COVID-19 pandemic. The spread of the coronavirus at the start of 2020 and the resulting pandemic has prompted global stockpiling and speculative newsFootnote 1. The FAO (Food and Agriculture Organization) Food Price Index hit a three-year high in 2020 during the pandemic. Food price increases have had direct adverse effects—particularly on the food consumption of vulnerable communities. Understanding the dynamics behind food price formation and determining how potential factors contribute to food price changes can offer important insights and significantly affect envisioned and already-formulated policies designed to cope with food price increases.
This article, which takes an exploratory approach, concentrates on factors affecting food price inflation in an emerging country setting. We review both the existing broad literature on underlying factors that can have long-term effects on food price formation and the literature on short-term determinants of food inflation in Turkey. Based on this literature review, we adapt an exploratory research design and document the changes in the usual suspects identified in the previous sections. In the exploratory analysis, we empirically focus on potential medium and short-term (immediate) drivers of food prices. In other words, we contribute to the existing literature by analyzing immediate drivers of recent food price inflation (such as currency depreciation and rising margins of retailers) without losing sight of underlying issues. Finally, we extensively discuss the potential policy recommendations and their applicability, given the larger political economic issues.
Synopsys and methodology
One of the direct economic consequences of rising food prices is the resulting increase in the consumer price inflation rate. Hence, especially for central banks in emerging/developing countries targeting low inflation rates, understanding three issues are of paramount importance: i) the transmission of food prices to the overall inflation rate; ii) the effect on the real economy; and iii) the modification of monetary policy accordingly. From the supply chain perspective, the pass-through mechanisms involved in transforming producer prices to consumer prices are closely related to efficiency in supply and value chains. Besides domestic factors, international factors and trade may also play a role in forming food prices.
The ongoing COVID-19 pandemic has caused a further surge in prices and volatility in Turkey which had already been experiencing deteriorating economic conditions since the second half of 2018, exacerbated by the depreciation of the Turkish lira. The government countered the 2018 recession with expansionary fiscal and credit policies during 2019. When the pandemic broke out in early 2020, there was little fiscal capacity left to fund direct emergency relief measures to subsidize firms and households. As a result of diminished fiscal capacity, Turkey’s direct support for households ranked among the lowest in the world during 2020 (Elgin et al. Reference Elgin, Başbuğ and Yalaman2020). Pandemic-related economic issues, along with a long chain of weak macroeconomic policy decisions, led to another depreciation in 2020. Coupled with other supply-side problems and the structural problems in the agricultural sector, food prices increased by 20.6 percent in 2020. Note that the World Bank’s Agricultural Price Index in 2020 (Quarter 3) was 6 percent higher compared to the previous year. On the other hand, Turkey saw an increase of 18 percent in the same period (World Bank Group 2020). Domestic factors, especially the weak exchange rate, are the leading factors in higher food prices. According to the October 2021 Inflation Report by the Central Bank of the Republic of Turkey (CBRT 2021b), food inflation was 28.8 percent in 2021, which is among the highest in the worldFootnote 2.
Inflation has been a problem for the Turkish economy for the last four decades. The inflation rate for the period between 1990–2004 averaged 69 percent and, more importantly, with high volatility and persistence (Bilici and Çekin Reference Bilici and Çekin2020). Similarly, food inflation is not a new phenomenon in Turkey. High food prices have been among the most debated topics in the press, academia, and policymakers for over a decade (e.g. CBRT 2018). Although the prices of different agricultural products have been increasing for some time, the increase in the overall food price level has been more pronounced in recent years. As a result, public interest has been piqued, with citizens wanting to understand the reasons underlying the surge in food prices. With the pandemic, at the global level, job losses led to a decline in consumer income which resulted in decreased demand for and prices of non-essential goods and services. Food prices surpassed the overall consumer price index (CPI) in many regions of the world due to supply disruptions and stockpiling of food products (Stoevska Reference Stoevska2020).
Rodrik (Reference Rodrik2021) points out that economists are obsessed with documenting the statistical association between the change in a variable of interest caused by an exogenous factor (e.g. a decline in agricultural production due to the lack of rainfall) and a dependent variable (e.g. farm-gate prices). It is important to note that such methodology does not address which factors result in food price increases. It only provides evidence for one variable, which is not necessarily one of the main factors. These confirmatory research methods are no substitute for works of synthesis. Agricultural economists have long been aware of these methodological limitations. On the eve of the Great Recession, the following was noted:
The current [food price] crisis is a global phenomenon, and one that is regarded by many as a distinct event. This means that some of the usual tools favored by economists for uncovering causality, such as regression analysis, are quite limited in this context. Instead, the most appropriate research on this issue needs to rely on some less formal detective work, involving a mix of economic theory and reasoning, economic history, and rudimentary statistical analysis (Headey and Fan Reference Headey and Fan2008, 376).
In this study, we adopt the exploratory research perspective quoted in the paragraph above and identify the usual suspects that potentially affect food inflation in Turkey. We categorize them in two subgroups: factors related to macroeconomics and to microeconomics. We investigate divergence from global trends under macroeconomic factors due to the dominant effect of exchange rates in the price formation process. Under microeconomic issues, we rely on intuitive and basic price analyses to investigate costs of production and marketing channels. The results derived indicate that, first, macroeconomic factors have a strong association with domestic food prices due to dependence on imported production inputs. Second, detailed analyses of select products reveal that frequently cited factors are not solely responsible for price increases. In the end, our analyses suggest that it is not easy or possible to pinpoint any single factor as being accountable for food inflation in Turkey.
Many policy reforms and solutions frequently mentioned in the literature cannot be implemented in Turkey primarily due to macroeconomic and political economy constraints that hinder change in agricultural structures. These conclusions emphasize the need for long-term structural reforms, discussed in part at the end of this article.
We organized the article into six parts. The next section provides a review of literature on food price formation. It is followed by a review of structural issues in Turkish agriculture, followed by a review of literature on food prices in Turkey. We then analyze possible determinants of food prices in Turkey through in-depth analyses of potentially contributive factors. The last two sections focus on policy discussions and conclusions.
A brief summary of major arguments on food price formation
In a comprehensive study, Timmer (Reference Timmer2008) focuses on external factors that result from supply and demand, cross-tabulating these factors with low- and high-volatility issues in food prices (Table 1).
External causes of food prices
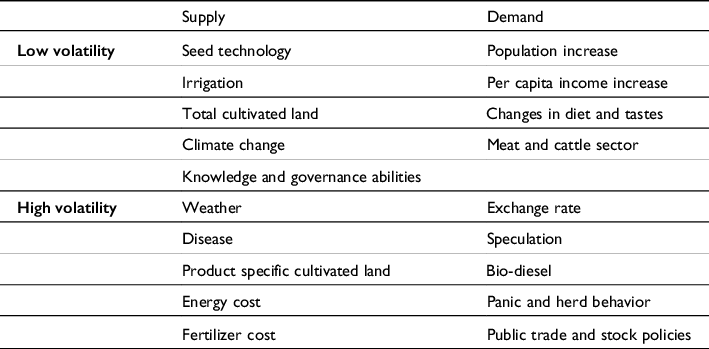
Source: Reproduced from Table 1 of Timmer (Reference Timmer2008)
Price fluctuations are not always considered a problem. For example, FAO (2011) states that fluctuations are not problematic if prices follow market fundamentals and exhibit a regular and stable long-term structure or a known seasonal effect. Changes in prices begin to cause problems when they become unpredictable, are large in size, and create uncertainty. When prices cease to reflect market fundamentals, risks increase for producers, traders, and consumers. Such circumstances could lead to ill-informed decisions that are neither inclusive nor optimal. This results in the food price formation process becoming even more distorted, increasing the likelihood of inflation. Also, the effects of price volatility have become quite complex since many households in developing countries are both producers and consumers of agricultural products (FAO 2011). FAO (Reference Keyder and Yenal2011) recommends examining the changes and volatility in food prices separately because the underlying issues could differ. This distinction is important because policies to reduce or stabilize prices are subject to different methods (FAO Reference Keyder and Yenal2011).
FAO (Reference Keyder and Yenal2011) bases the assessment of price volatility of agricultural products on three market fundamentals: i) agricultural production may differ from period to period due to natural shocks such as climate events and pest effects; ii) demand elasticities are relatively low compared to prices; likewise, supply elasticities are low, at least in the short-term. For supply and demand to rebalance after supply shocks, prices must respond strongly because of low stock levels; and iii) due to the time-consuming production process, supply cannot respond to price changes in the short term; supply can respond only when the production cycle is complete. This delayed supply response to price changes results in cyclical adjustments—one known example is the cattle cycle (Özertan et al. Reference Özertan, Saghaian and Tekgüç2015)—that cause additional volatility and instability in the market.
The production stage
Several studies separately analyzed some of the factors emphasized by Timmer (Reference Timmer2008). Lambert and Miljkovic (Reference Lambert and Miljkovic2010) argue that any change in the level of consumer income affects farm prices, food processing prices, food distribution prices, wholesale prices, and input costs related to food processing technology. These changes redistribute market power within the supply chain. Therefore, it may be better to evaluate food prices on a group-by-group basis instead of a singular unit (Lambert and Miljkovic Reference Lambert and Miljkovic2010; Irz et al. Reference Irz, Niemi and Liu2013). On the macro-scale, weak agricultural infrastructure, high transportation costs, inefficient credit and insurance markets, and ineffective public policies also cause adverse conditions. The inefficient management of land and water also has a negative impact on prices (FAO Reference Keyder and Yenal2011).
As a major macroeconomic factor, the effect of the exchange rate has been extensively analyzed in many studies. Globally, many agricultural commodities are traded in US dollars. Depreciation of the US dollar leads to an increase in international commodity prices denominated in US dollars and vice versa. As a result, such movements in currency prices increase the volatility of price changes (FAO 2011; Headey and Fan Reference Headey and Fan2008).
Agricultural and trade policies
The agricultural and trade policies that countries follow are two other important factors that weigh significantly on agricultural prices. Agricultural policies affect commodity price movements in three ways. First, policies indirectly affect market prices on the production side. Subsidies may disrupt the use of input distribution and may lead to inefficient supply levels for different products. Second, trade policies affect commodity prices through customs taxes. Export restrictions are also used to stabilize domestic prices and prevent supply deficits. Finally, price stability policies affect market prices (Kornher and Kalkuhl Reference Kornher and Kalkuhl2013).
The marketing stage
Regarding the marketing stage, Bukeviciute et al. (Reference Bukeviciute, Dierx and Ilzkovitz2009) cite three different mechanisms that affect consumer price formation: i) the pass-through from agricultural product prices to producer prices; ii) the pass-through from producer prices to consumer prices; and iii) the asymmetry in price transmission between producer and consumer prices. Furthermore, inefficiencies in the food supply chain resulting from a lack of competition and incomplete regulations can also affect price movements. Since a significant number of agricultural commodities constitute a large part of the cost of food production, consumer food prices become more sensitive to price increases in agricultural commodities. For instance, an important reason for the rise in retail prices in the EU is the growth of the market share of discount stores. In Germany and Austria, for example, the market share of discount stores is over 30 percent (Bukeviciute et al. Reference Bukeviciute, Dierx and Ilzkovitz2009).
Literature on structural issues in Turkish agriculture
The underlying structural problems of Turkey’s agricultural and food sectors are chronic. These include a lack of agricultural know-how; the existence of large numbers of intermediaries in the supply chain; weaknesses in regulatory, supervisory, and monitoring capacities; global warming and adverse weather conditions; increases in input prices; and failure to adapt to changes in demand. These problems have been extensively studied by many researchers and organizations, including Aerni (Reference Aerni2007), Akder (Reference Akder2007), Oskam et al. (Reference Oskam2004), Kıymaz and Saçlı (Reference Kıymaz and Saçlı2008), Orman and Yılmaz (Reference Orman, Öğünç, Saygılı and Yılmaz2010), TİM (2016), TÜSİAD (2016), and Akder et al. (Reference Akder, Çakmak, Sürmeli and Veziroğlu2020). A prominent and chronic problem that directly influences price volatility is the lack of organization among farmers. This shortcoming has resulted in intermediaries becoming an ever-present force in the agricultural sector and impacting agricultural price formation through informal financing. The lack of market organization on the sellers’ side causes excessive fluctuations in retail food prices. These fluctuations are caused, in part, by large annual production swings due to farmers chasing the most profitable crop every year. The solution for this well-documented problem (cobweb prices) is the regulation of production by producer organizations, but, as previously mentioned, producer organizations are inefficient and ineffective for economic, social, and political reasons. Specifically, the Turkish Industry and Business Association (Türk Sanayicileri ve İş İnsanları Derneği, TÜSİAD) (2016) posits that ever-increasing production costs, the supply gap, exporting of fresh vegetables and fruits, isolation from global markets for some other agricultural products, and the imperfect organization of supply chains are the main structural reasons behind food inflation.
Another factor that is closely related to productivity is the agrarian structure. TÜSİAD (2016) reports that, according to the 2001 Agricultural Census in Turkey (which is the most current one), 20 percent of agricultural holdings operate on 4–5 parcels, and 23 percent of the total arable land belongs to agricultural holdings with 6–9 parcels. In addition, the number of parcels increased between 2001–2006. Official reports add that the small size of farms and improper shape of land parcels in Turkey hinder the efficient management of agricultural enterprises (Ministry of Agriculture and Forestry 2020). On the potential impact of market structure on food inflation, TÜSİAD (2016) states that deviations from the competitive market structure in Turkey—hence, imperfect competition in agricultural product markets—influence inflation. Keyder and Yenal (Reference Keyder and Yenal2011) point out that the agricultural structure and production process are not static in Turkey. Post-2000 reforms reduced the state’s direct role and increased the role of markets in price formation, which raised the level of risk and uncertainty for agricultural producers. Eren et al. (Reference Eren, Kal and Özmen2017) find that producer prices and the quantity of production supplied to the domestic market are two main drivers of food prices. Hence, supply-enhancing policies can help reduce food inflation.
Finally, measuring the impact of climatological events requires comprehensive analyses and is beyond the scope of this article. A recently published report (TÜSİAD 2020) states that Turkey will become an arid region in the coming years, and the expected loss in agricultural yields will amount to approximately 10 percent across major crops.
Literature on immediate drivers of food prices in Turkey
In addition to the above literature highlighting structural problems, the existing literature also stresses i) the effect of exchange rates; ii) pass-through from international prices; and iii) problems in supply chains.
Many researchers have recognized the effect of the depreciation of the Turkish lira on domestic food prices (Çıplak and Yücel Reference Çıplak and Yücel2004; Başkaya et al. Reference Başkaya, Gürgür and Öğünç2008; Bayramoğlu and Yurtkur Reference Bayramoğlu and Yurtkur2015; Demirkılıç et al. Reference Demirkılıç, Özertan and Tekgüç2020; Eren et al. Reference Eren, Kal and Özmen2020). Furthermore, Bayramoğlu and Yurtkur (Reference Bayramoğlu and Yurtkur2015) argue that the depreciation of the Turkish lira vis-à-vis the US dollar and euro is the main factor leading to rising food prices, with most of this increase coming from rising input costs. Başkaya et al. (Reference Başkaya, Gürgür and Öğünç2008) find that the pass-through from the exchange rates to processed food prices is very rapid and takes place in the first three months. Most recently, CBRT (2021a) shows that FAO food prices, the US dollar, and unit labor costs positively affect food prices. To be more precise, a 10 percent increase in the exchange rate increases food prices by 2.1 percent.
Another group of studies focuses on the pass-through from international prices to domestic prices. Previous research shows that i) heterogeneity in the pass-through of import prices and a sizeable foreign price pass-through in food prices (Özmen and Toplaoğlu Reference Ozmen and Topaloglu2017); ii) oil price pass-through is extremely fast (Akçelik and Öğünç Reference Akçelik and Öğünç2016); iii) the effect of international prices on processed food prices is through the import of processed intermediate goods, within two quarters (Başkaya et al. Reference Başkaya, Gürgür and Öğünç2008); iv) expensive grain prices are the main drivers of expensive domestic animal feed prices (Songül Reference Songül2018); and v) production price index (PPI) to consumer price index (CPI) pass-through is not one-to-one (Atuk et al. Reference Atuk2013).
Kara et al. (Reference Kara, Öğünç and Sarıkaya2016) disaggregate the determinant of CPI inflation and find that unprocessed food prices add to the headline inflation on average 1.4 percent annually. Songül (Reference Songül2017) analyzes the effect of the longer supply chain in fresh produce on price formation. The increasing number of intermediaries in the supply chain increases costs and, hence, consumer prices. Aysoy et al. (Reference Aysoy, Kırlı and Tümen2015) show that although Law No. 5957—the Regulation of the Trade of Vegetables and Fruits and Other Goods with Sufficient Supply and Demand Depth (Hal Yasası)—was successful in lowering wholesale prices, it did not have any effect on retail prices in the short term.
An overview of food price changes in Turkey
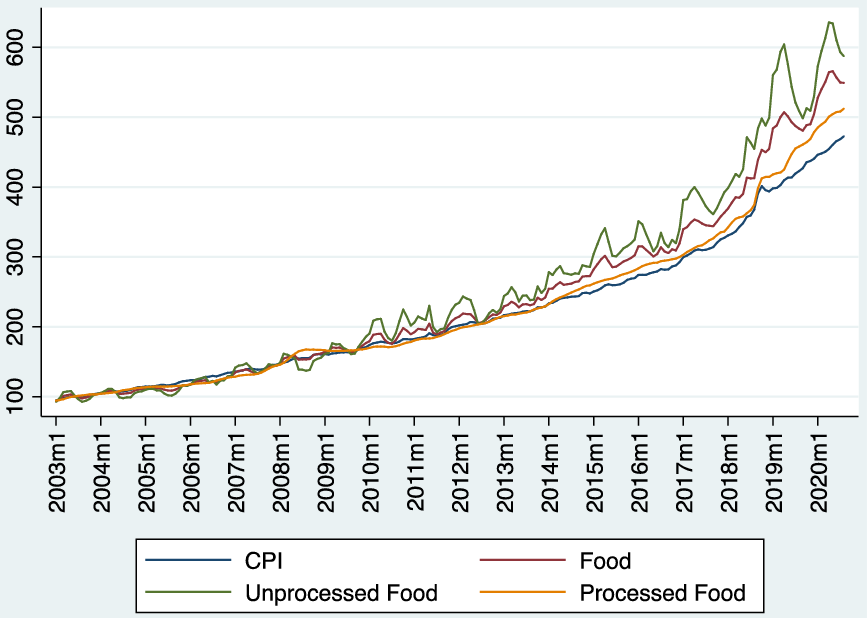
When we inspect the subgroups that factor into the overall food price index in Turkey for 2003–2020, we see that the unprocessed food price index is higher than processed food prices and move faster. Figure 1 clearly shows that starting in late 2009, the increase in unprocessed food prices began moving faster than the general price level; moreover, unprocessed food prices exhibit more volatility. Therefore, we specifically focus on unprocessed food price inflation in Turkey between 2003 and early 2020, just before the initial impact of the COVID-19 pandemic was observed.
Price indices (2003=100).
Source: Central Bank of the Republic of Turkey Electronic Data Delivery System (2021a)
Food inflation is an important economic and social problem because low-income households allocate a large share of their income to food. As seen in Table A1 in the Appendix, while the average household income in Turkey has been increasing over the years, the percentage of income allocated to food has been decreasing. However, food consumption constitutes 29–43 percent of total spending for the bottom 20 percent of consumers. Hence, families on fixed incomes are becoming impoverished as a result of increasing food prices.
Limits to bureaucratic interventions
Turkey has implemented various legal instruments in recent years to monitor and reduce volatility in food prices. Hal Yasası was enacted on January 1, 2012. Its purpose was to reduce barriers in the supply chain and regulate the price of fresh fruits and vegetables. Since the excessive volatility in unprocessed food prices distorts inflation expectations, the Food and Agricultural Product Markets Monitoring and Evaluation Committee (hereafter “Food Committee”) was formed in December 2014. To be chaired by the Deputy Prime Minister, the committee was tasked with monitoring the food and agricultural product markets in Turkey. At that time, the committee convened at the Central Bank’s premises with top-level economic policymakers attending. However, with the changes made to ministerial structures following the new presidential government system instated in 2018, the Food Committee was rendered defunct.Footnote 3 As of February 2021, the new Food Committee has been holding meetings in response to the allegedly excessive media coverage of food price increases. As previously mentioned, the Food Committee cannot intervene in or steer agricultural policiesFootnote 4, Footnote 5.
An in-depth analysis of factors potentially contributing to food price inflation
In the following analysis, we evaluate some of the usual suspects mentioned previously. We focus on select factors that might have contributed to the recent inflation in unprocessed food prices in Turkey.
We start by comparing Turkish food indices with FAO food indices. Although this comparison is frequently made to evaluate the extent to which prices in Turkey resemble or deviate from those in global markets, index values alone are not sufficient for a detailed analysis. In fact, index values are not even a good fit for comparing world (FAO) and Turkish food prices.
The discussion in Turkey is strongly focused on the argument that while Turkey’s nominal food price index has constantly been increasing, the nominal FAO food index has been declining in recent years (Figure 2, top panel). To evaluate this claim, we compare real Turkish prices with real FAO prices. We convert the nominal prices for Turkey into real prices using the CPIFootnote 6. As seen in Figure 2, bottom panel, unlike the ups and downs in FAO indices, Turkey’s real food price index displayed a steady increase until 2016. Starting from 2016, both indices show a tendency to decline.
FAO (2014–2016=100) and Turkish food prices (CPI: 2015=100).
Source: FAO (2021) and authors’ calculations

In addition, when we compare Turkey’s real food price index with FAO prices, we do not observe strong fluctuations (Figure 2, bottom panel). Following the increase in the trend starting in 2005, the Turkish index reaches its initial peak in 2015, declines between 2015–2016, then resumes its gradual increase. Real food prices in Turkey do not show more variation compared to real FAO prices. Moreover, domestic price indices do not reflect the effect of global price increases in 2008 and 2011. Due to specific foreign trade policy stipulations in the agricultural sector, Turkey was isolated from global price swings. In particular, except for processed grains, vegetable oils, and tobacco, Turkish prices were insulated from international price fluctuations, with tariffs and taxes levied on agricultural products (Parlakay and Duru Reference Parlakay and Duru2017).
Microeconomic factors
We broadly classify the microeconomic factors involved as supply- and demand-side factors. On the demand side, we mainly focus on Turkey’s real per capita income increases in the last decade. On the supply side, we evaluate total production, the cost of production and input prices, and the changes in the prices of select products. Here, we analyze the margins between consumer (retail) and producer (farm-gate) prices for select products. The purpose of the analysis is to understand whether some of the fluctuations originate from speculation, stockpiling, and the actions of intermediaries.
Changes in the real per capita GDP
Increases in the per capita income and population are two primary demand-side factors that affect food demand and food inflation. Figure 3 shows that per capita income increased substantially until 2018. Another factor is the increase in the population: for example, Turkey hosts more than four million Syrian refugees. Turkey is also host to an increasing number of tourists—around 45 million in 2019 (TURKSTAT 2020), before the COVID-19 pandemic hit. Both of these facts are driving factors on the demand side. Hence, an increase in the population has led to an increase in demand, which can ultimately increase food prices.

Is agricultural production declining?
One potential factor behind the price increases in agricultural products in Turkey could be the decline in agricultural production. Figure 4 shows the FAO’s per capita food production index for Turkey. We see that per capita production has not declined in Turkey; in fact, on average, it follows an upward trend. Although the index decreases between 2006–2007, 2013–2014, and 2015–2016, we still observe a steady increase between 2007–2013. The decrease in 2014 is attributed to weather. Duru et al. (Reference Duru, Gül and Hayran2019) report that climatic factors (especially drought) led to a 14 percent decrease in wheat and a 20 percent decrease in barley production.
Net per capita food production indices on selected groups for Turkey.
Source: FAOSTAT (2021)
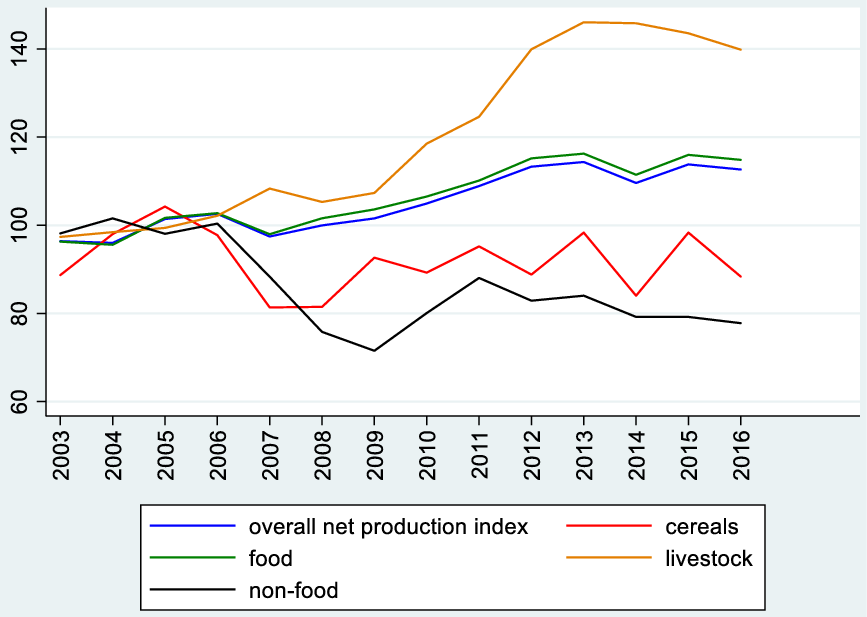
When we examine the subgroups belonging to the overall index, we observe that, except for non-food production (cotton, tobacco, etc.), both food and livestock production have been increasing, and cereal production has been stagnant. In addition to the per capita production index, we also evaluate changes in the self-sufficiency index for the select products. The figures presented in Table 2 suggest that Turkey is either self-sufficient or close to self-sufficiency in the main food groups.

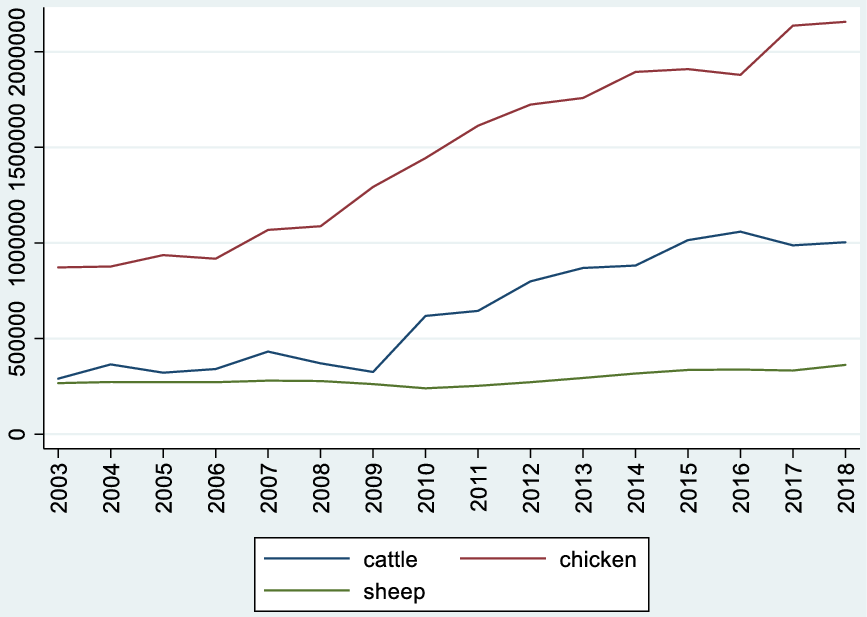
Red meat is a major consumption item for households. Red meat prices have been in an upward trend in Turkey for the last 15 years. Figure 5 shows that red meat production has also been increasing in Turkey; hence, supply cannot be the sole reason for the persistent increase in its prices. As we will discuss later, the increase in real per capita income is, in fact, one of the factors that potentially contribute to the rise in red meat prices.
In short, per capita production levels have mostly been stable for the periods considered; also, international prices and comparative price changes have not led to significant price changes in Turkey. Note that most production is consumed in-country, and the agricultural sector is a net exporter on aggregate. Except for wheat and oilseeds, agricultural commodity imports are negligible. The main exported items are fruits, vegetables, and processed foods (e.g. pasta). Overall, we conclude that Turkey does not have significant production problems regarding the major agricultural items consumed.
An evaluation of input prices and costs of production
The cost of agricultural production has increased significantly in Turkey during recent years. This increase is primarily due to the rapid depreciation of the Turkish lira vis-à-vis the US dollar and the euro. The resulting increase in the price of energy, feed, fertilizer components, and pesticide prices—all of which are mostly imported—triggered a rise in agricultural production costs. Another cost item is labor. Migration from rural to urban areas, and the exit of young people from agriculture has resulted in a scarcity of farm laborFootnote 7. This is a structural problem that currently affects an important pillar of production in Turkey.
Energy
Diesel is the primary fuel used in the agricultural sector. It affects costs directly related to production, as well as transportation. Figure 6 shows that real diesel prices increased more than 40 percent between 2003–2013. The price of electricity is another increasing cost item, owing to the extensive need for the pumping of well water in regions where irrigation water has become scarce. Due to the Special Consumption Tax (Özel Tüketim Vergisi, ÖTV) adjustments, decreases in international energy prices do not lead primarily to declines in local prices.

Fertilizer
Fertilizer prices in Turkey have not been in line with diesel prices in recent years. Overall, the price of frequently used fertilizers has been exhibiting an upward trend, as seen in Figure 6. There was a continuous increase in real fertilizer prices between 2003–2008. Following a global spike in fertilizer prices in 2008—a phenomenon also observed in Turkey—a decrease occurred between 2008–2009. This was followed by a rapid increase between 2010–2011 and then another decrease between 2011–2017. While fertilizer prices have shown an overall upward trend, they have remained lower than the increase in the CPI since 2015.
Animal feed
Animal feed is another significant cost item for milk and meat production. Although the agricultural products that comprise animal feed vary depending on the type of feed, various quantities of imported items are used in producing these feeds (mostly soy, partly corn). Figure 6 shows that real feed prices in Turkey increased between 2006–2012. As will be discussed in the following sections, these increases affect the profits of meat and dairy producers. From time to time, this adverse effect on profitability can result in what is referred to in the literature as “herd liquidation”—the premature slaughter of dairy cows (Özertan et al. Reference Özertan, Saghaian and Tekgüç2015). It should be noted that dairy and dual-purpose cattle are the primary sources of red meat in Turkey.
Labor
Labor is another significant input. In general, as is the case globally, farmworkers in Turkey are self-employed farmers whose family members work as unpaid family laborers (note that informality in the agricultural sector is highest among all sectors in Turkey). Therefore, we have no wage data that reflect agricultural labor costs. Using a different lens, the minimum wageFootnote 8 is the opportunity cost for those engaged in agriculture. As non-agricultural wages increase, agricultural workers’ earning expectations also increase. In addition, the minimum wage is a vital labor cost indicator for firms that process and market agricultural products. Therefore, fluctuations in and realized levels of the minimum wage are important indicators of the labor costs of companies that process and market agricultural products.
Select food products’ prices, intermediaries, and marketing margins
This section examines how producer and consumer prices of select agricultural products in Turkey behave over time. Through scrutinizing a select group of products, we want to determine whether frequently voiced public claims are valid or not, and whether intermediaries and marketing margins impact and play a role in the formation of food price inflation. To do so, we compare producer (farm-gate) and retail prices by analyzing the prices of select unprocessed foods. That is to say, farm-gate and retail prices are shown in the same graph to focus attention on the impact of intermediaries and marketing margins. The products we chose have been in a continuous nominal upward trend in recent years. Additionally, our selection features products that weigh heavier in the inflation basket and which the media have frequently cited recently. We chose tomatoes as representative for fresh fruits and vegetables, potato and onions for storable vegetables and fruits, and red meat for products with longer cycles. Also, we picked products least subject to processing to focus on intermediary margins. Similarly, Figure 1 shows that unprocessed food prices increased more than processed food prices. Due to space limitations, we present similar analyses for milk, egg, lemons, and olives in the online ‘Supplementary materials’.
Consumer and producer prices of select food products
The following analyses feature two main food groups, namely red meat and vegetables. We subcategorize vegetables into fresh vegetables (tomatoes) and storable vegetables (onions and potatoes). Subsequently, we comparatively assess the concurrent changes in the consumer and producer prices of these products.
Our analyses reveal two distinct observations for each food group. First, as expected, prices for each product fluctuate with different timings; they do not coincide. One potential reason underlying this phenomenon is seasonality. Seasonality refers to short-term price dynamics originating from price increase and decrease cycles observed across the same months of each year and which are closely related to harvest cycles. Also, note that seasonality only influences price fluctuations within the year but does not necessarily affect annual inflation provided that seasonality is not irregularFootnote 9. Second, the increase in producer prices is almost always less than the increase in consumer prices. Thus, we hypothesize that producers cannot pass cost increases onto selling prices. This is mainly related to structural problems in producer organizations that make it difficult for farmers to realize cheaper input costs and access markets and consumers directly. We index all prices by the consumer price index.
Red meat
Comparison of the producer and retail prices of red meat indicates that retail (consumer) prices increased rapidly in the second half of 2009 and continued to do so until mid-2010, ultimately stabilizing at a higher level. Figure 7 shows that producer price increases were less than consumer price increases. Another noteworthy observation is that consumer prices have moved ahead of producer prices. If there were a cost transition/pass-through from producer prices to consumer prices, we would have observed a lag as consumer prices follow producer prices. However, in red meat, we observe almost the opposite. To illustrate, consumer prices peaked in mid-2010 while producer prices peaked at the end of 2010. Figure 5 shows that the level of red meat production increased significantly after 2009. However, as seen in Figure 7, the differential between producer and consumer prices did not decline to levels realized during the early 2000s. The combined permanent increase in retail prices and the real increase in production and occasional imports are signs of a substantial increase in demand, possibly due to a rise in consumer incomes.
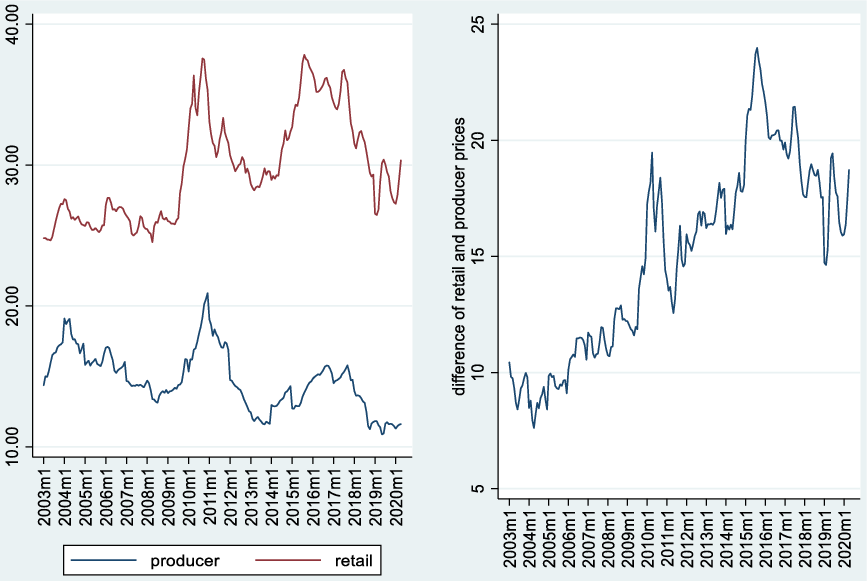
The primary reason for the rapid price increase in 2009 is the cattle cycle (Özertan et al. Reference Özertan, Saghaian and Tekgüç2015). When producers could not pass the increase in feed prices onto milk prices between 2006–2008, they halted production and sent their livestock to the slaughterhouseFootnote 10. Although this temporary increase in supply caused meat prices to decrease initially, insufficient rootstock levels caused a subsequent decrease in the red meat supply, which in turn caused a rapid rise in the consumer prices of red meat starting mid-2009.
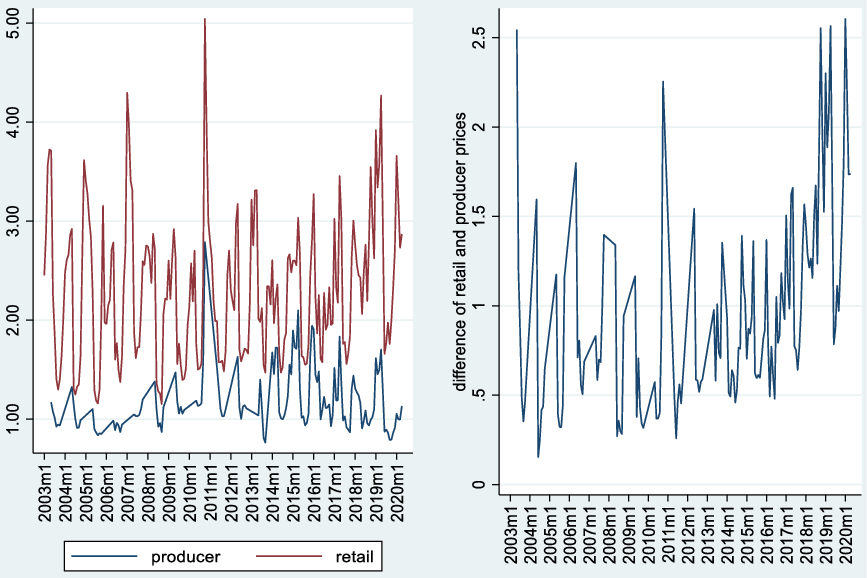
Fresh vegetables (tomatoes)Footnote 11
We observe significant seasonality in the consumer price of tomatoes (Figure 8). We calculated the difference of retail and producer prices (right panel of Figure 8) and found that a significant amount of instability still remains. In the textbook case, volatility in unprocessed food prices is due to seasonality and stems from producer price volatility. On the contrary, the producer price of tomatoes is less volatile and stable around one Turkish lira. In a competitive market, we would expect the intermediaries to operate with constant margins. This is definitely not the case in the tomato market in Turkey, and Figure 8 suggests that intermediaries disproportionately increase retail prices when producer prices increased. Furthermore, the difference between producer and consumer prices has been increasing since 2012.
Storable vegetables
Storable vegetables like onions and potatoes are different from non-storable vegetables in that the former can be stockpiled, which can enable price manipulation. Price changes regarding storable vegetables, in particular potatoes and onions, garner significant public interest in Turkey. To observe whether such a market failure exists, we separately examined the price behavior of onions and potatoes. The corresponding series are presented in Figures 9 and 10.
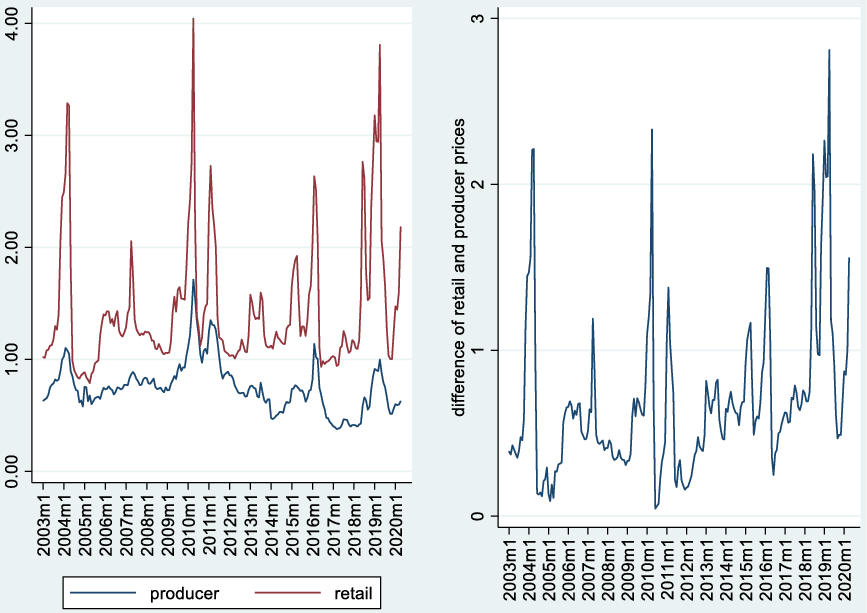
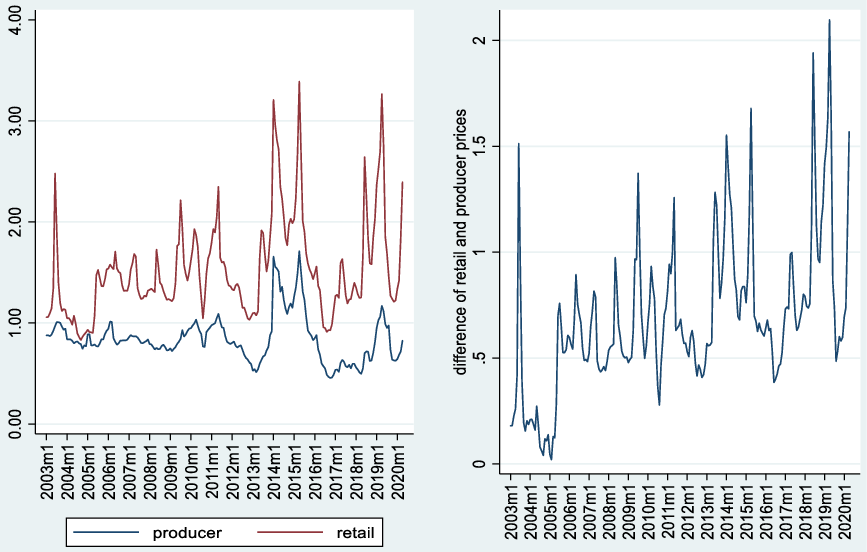
Our first observation is that the margin between the consumer and producer prices of these products began to increase in 2011. It is striking that, similar to meat prices, the reason behind the increase in consumer prices is not production costs. Producer prices follow consumer prices, with lags in both onions and tomatoes. Starting in 2011, the margin between the producer and consumer prices of these products increased. Again, producer prices follow consumer prices with a lag that may suggest the increase in consumer prices is not caused by producer prices.
The irregular spikes in consumer prices are very likely to be triggered by supply shortage expectations based on weather conditions. Increases in the consumer prices of potatoes are potentially caused by weather conditions and are relatively softer. However, it is impossible to observe the magnitude of this effect or draw conclusions from the available data. That said, it is interesting to see that potential stockpiling causes price increases only in specific periods (such as 2010 and 2019), illustrated in Figures 9 and 10. It should also be noted that fluctuations in the price of onions and potatoes do not coincide.
Our micro study reveals three distinct pieces of information for each product. First, we observe that the price of each product fluctuates with different timings. Second, increases in producer prices are almost always less than the increase in consumer prices and production costs. Lastly, the continuous increase in red meat prices and the most recent increase in fresh vegetable prices are the two main drivers of the overall inflation rate in Turkey.
Intermediaries and marketing margins
Another potential reason for increases in food prices is the frequently discussed role of intermediaries, who are also referred to as traders or middlemen. Some claim that intermediaries take advantage of badly organized producers (farmers) by purchasing products at low prices, charging high commissions, and stockpiling until supply is significantly diminished, all of which eventually leads to price manipulationFootnote 12. These stylized facts require a thorough investigation for several reasons. First, there are close financial ties between farmers and traders. Most small-scale farmers in urgent need of cash have difficulty accessing formal credit due to time constraints, a lack of collateral, and transaction costs. Conversely, intermediaries can provide informal credit which is extended mainly to enable farmers to harvest all or some of their crops. As such, this phenomenon can be classified as an in-kind transfer. Since most producer organizations operate inefficiently and have difficulty reaching consumer markets, intermediaries buy farmers’ produce in bulk and deliver it to consumer markets. Intermediaries control both the credit and access to consumers, hence they have more power than counterpart farmers which means that they can dictate the terms and abuse their power.
Another claim is that intermediaries stockpile certain products and collude to manipulate prices. Due to the lack of micro-level data, we conducted interviews with industry experts to assess whether stockpiling existed or not. These interviews suggest that intermediaries were trying to manipulate local markets through stockpiling, but they were too small to have an effect on entire markets. As an example, potatoes are produced in numerous regions in Turkey (over 20 provinces). Since multi-region production is commonplace for many agricultural products, it is not possible to argue the existence of regional concentration for most agricultural products. Cornering the supply and managing the physical aspects of storage would incur immense operational costs. At present, there are no intermediaries able to cover said costs. A partial alternative to manipulating the market is documented by Özcan-Tok et al. (Reference Özcan-Tok, Özmen, Tok and Yılmaz2019). They looked at information posted on an online forum where producers shared the prices they receivedFootnote 13. They derived a measure by combining the positive and negative information on the course of prices tracked and then related the collected information to the realized prices at the national level. The study reveals that the expectation about the price increases is positively associated with the national prices of storable goodsFootnote 14.
Summary of findings
In this study, we investigate the food price formation process in Turkey in recent years using an exploratory approach. Our methodology and findings are as follows. On the macroeconomic scale, we first investigate connections between domestic and international agricultural product markets, comparing the behavior of Turkish and FAO food price indices over time. This first-pass test enables us to visually investigate whether domestic prices are diverging from international prices, as well as whether domestic prices are driven by international prices. The outcome of this visual test suggests that for real prices, FAO and Turkish food prices do not diverge. Therefore, although domestic prices appear to be increasing steadily in nominal terms, when consumer prices and exchange rate effects are accounted for, it becomes apparent that domestic agricultural prices did not increase faster than global prices between 2003–2020. This observation emphasizes the strong impact of exchange rates on domestic prices in countries heavily dependent on imported inputs such as energy, fertilizer, and chemicals.
Next, we conducted in-depth analyses on select products; these analyses resulted in three explicit findings: i) seasonal and cyclical variation; ii) no one-to-one pass through from producer to consumer prices; and iii) intermediaries may cause temporary consumer price spikes. First, there are seasonal and cyclical variations in the price movement of each selected product, and they all exhibit a different pattern. Based on the selected products, we found that unprocessed food prices did not increase or fluctuate jointly in a concurrent manner. This finding implies that it is rather difficult to validate a direct relationship between seasonality and inflation in unprocessed food prices.
Also, it is possible that the investigated prices are not being significantly affected by international price changes due to the Turkish agricultural market being heavily protected against imports. By legislating against the potentially harmful impact of exchange rates, Turkey only partially imports food inflation. Although Turkey is self-sufficient in most agricultural products, it also imports an essential share of other products, such as oilseeds, where the imports amount to around 90 percent of vegetable oil consumed domesticallyFootnote 15.
Additionally, the increase in producer (farm-gate) prices was found to be lagging behind the increase in consumer (retail) prices. We also observe that the rate of increase in producer prices remained below the rate of increase in energy prices (mainly diesel). This finding suggests that producers could not pass increases in production costs onto consumer prices proportionally. We, therefore, cannot claim that the pass-through from producer prices to consumer prices is the primary reason behind high unprocessed food prices.
Finally, we find that the prices of two selected essential food groups—red meat and fresh vegetables—cause an increase in the overall unprocessed food price index. This suggests that the price of red meat and fresh vegetable rises faster than the overall unprocessed food price index. We further observe temporary pricing spikes that point to the temporary role of intermediaries in the price formation process. In conclusion, the analyses conducted in this study reveal that no single factor comes out as the sole reason for food inflation. Instead, several factors contribute to the formation of food price inflation.
Policy implications
The dominant short-term reason for overall and food inflation in Turkey is the depreciation of the Turkish lira. Unfortunately, stabilizing the exchange rate is beyond the power of agricultural policymakers. Instead, many focus on what they can reform. However, ignoring the most dominant immediate reason—depreciation-driven input costs—and focusing on other issues, however worthy, may erode the credibility of agricultural reformers in the eye of stakeholders, especially farmers. In this section, we also grapple with this tension of the sequencing of reforms. Below we first discuss policy reforms that are within reach of agricultural policymakers. Then, we discuss the main issues that require decision-making at the highest level. Finally, we review other oft-mentioned policy proposals and point out their weaknesses in the light of the evidence provided in previous sections.
In light of the findings in this article, we can identify and suggest various policy reforms, as different trends in individual food products can guide us in proposing policy. For example, price increases in onions and potatoes can be closely monitored as an early warning mechanism to prevent stockpiling. Licensed warehousing and commodity exchange markets could stabilize speculation and reduce the movement of products, both of which are conducive to stockpiling. For other products, regulatory bodies could introduce mechanisms that would not require amending existing laws—for example, the recommended price of raw milk which is currently set at periodic meetings. The price could be raised at any one of these meetings to a level that would encourage and stimulate production.
Rising input costs (energy, feed, and fertilizer prices) and declining agricultural product prices threaten farmers’ income. Under these conditions, decreases in farmers’ income can be prevented by either increasing per farmer production levels or the subsidy each farmer receives. An increase in the output per farmer is only possible through an increase in per-area yields. Such an increase requires more input, more efficient farming methods, or a combination of both. These are, indeed, quite structural and long-term solutions. Furthermore, lowering most input prices necessitates policies that are beyond the capacity of the Agricultural Ministry and require significant new resources from the Treasury, which can only be diverted as a result of major political change. The requisite funds needed to subsidize and finance fertilizer, fuel (diesel), and major investments to increase per-area yields (e.g. large-scale dams) would have a severe budgetary impact. As such, it is a significant bone of contention in Turkish politics (Adaman et al. Reference Adaman, Murat and Bengi2019).
Another potential solution is long-term agricultural planning. One aspect of this is regional production quotas (havza ürün deseni). The idea is that each micro-climatic region would specialize in products that best match its soil and climate. Currently, farmers lean toward the most subsidized agricultural products, regardless of whether their soil and climate are optimally suited for the subsidized crops. This leads to an even bigger issue—the readjustment of subsidies in a logical manner. Virtually all of the policies in Turkey that are designed to address structural problems come with political costs. In the past several decades, politicians have not been willing to pay said costs.
Finally, some of the solutions or claims often put forward show little merit under close scrutiny. The first is the claim that Turkey has great potential to become an agricultural exporter. Turkey is not as abundant in natural resources as, for example, the United States, Brazil, or Argentina. In Brazil and Argentina, agriculture is a net-taxed sector, whereas agricultural production is subsidized in Turkey. Production would likely be even more inefficient if Turkish agriculture were not subsidized and left to market mechanisms. The much-repeated proposal to import agricultural products to even out the food supply and consumer prices is also problematic due to macroeconomic constraints. For example, China is primarily self-sufficient in grains but import-dependent in animal feeds. Turkey cannot emulate China’s strategy because, unlike China, Turkey has a floating exchange rate and chronic current account deficits. If Turkey tried to manage food inflation and price fluctuations with imports, the cure would be even worse than the disease in terms of volatility. In Turkey’s case, imports would not only increase food prices but the current account deficit as well.
Putting macroeconomic constraints to one side, the limitations of political economy are also quite significant. An oft-proposed solution to increase domestic production is to increase land productivity via the consolidation of small farms. Turkey does not have a colonial legacy akin to that of Brazil or Argentina, nor does it have the aristocratic heritage of Western Europe or the collectivist culture of ex-communist countries. Agricultural landholdings are small and fragmented (OECD 2016). Proponents of the consolidative approach view farming as an optimization issue and ignore other aspects of land ownership. The increase in agricultural employment in January 2021 (TURKSTAT 2021f) illustrates that agricultural land in Turkey acts as a quasi-insurance against unemployment, even after agricultural landowners move away from their farmlands. From the perspective of the rural citizenry, any effort to consolidate fragmented farmlands will result in undervaluation if the quasi-insurance aspect of these lands is not accounted for.
Conclusion
To conclude, we maintain that both supply- and demand-side factors contribute to unprocessed food inflation. Our results indicate that exchange rates are strongly associated with domestic food prices due to dependence on imported inputs. Second, deep-dive analyses on select products show that global price movements and pass-through from producer to consumer prices are not solely responsible for price increases. As a result, it is not easy or possible to pinpoint any single factor that is accountable for food inflation in Turkey. The results also emphasize the need for long-term structural reforms—albeit at potential political costs.
On the whole, data availability limits our analysis. Food price formation is a complex mechanism in Turkey and elsewhere. The unavailability of periodic and detailed production data and disaggregated retail prices is a significant problem in Turkey that impedes research efforts to understand the determinants in the agriculture and food sectors that affect the price formation process. With the available data, we cannot disaggregate each of the potential factors’ relative weight in the unprocessed food price formation. More conclusive analyses require comprehensive datasets.
Acknowledgements
We thank participants at the CEE 2020 Annual Webinar, Refik Erzan, Semih Tümen, Ali Ekber Yıldırım, Ökkeş Yıldırım, the editors, and the three anonymous referees for useful comments.
Conflicts of interest
None.
Supplementary material
To view supplementary material for this article, please visit https://doi.org/10.1017/npt.2022.9


 Open access