

Changes in the structure of modern diets and excessive intake of high-fat, high-energy diets cause disorders in the metabolism of fats, proteins and carbohydrates. Excess energy is gradually accumulated in the body in the form of fat, which leads to obesity(Reference Wardle, Brodersen and Cole1). After the formation of obesity, it will further induce insulin resistance (IR), which in turn increases the incidence of the metabolic syndrome, diabetes, hypertension and CVD(Reference Cappel, Palmisano and Emfinger2). The liver plays a vital role in maintaining the body’s carbohydrate, lipid and protein metabolism balance(Reference Visinoni, Khalid and Joannides3). Obesity-related metabolic disorders are manifested in the liver, causing excessive deposition of fat in the liver cells, which can lead to fatty liver(Reference Vernon, Baranova and Younossi4). The pathogenesis of obesity is not fully understood. It is generally believed that obesity is mainly caused by the combination of genetic factors and environmental factors(Reference Mendes, Nogueira and Padez5). In addition, factors such as endocrine, metabolism and central nervous system are also involved in the pathogenesis of obesity(Reference Halford, Boyland and Blundell6).
Unlike traditional molecular biology techniques, proteomics enables researchers to define a global overview of protein expression in a specific physical or pathological state. In the present study, rats were treated with a high-fat diet to replicate an animal model with an obese phenotype similar to human obesity(Reference Woods, Seeley and Rushing7). The effects of high-fat diet on rat liver protein expression were studied by tandem mass tag combined with LC-MS/MS. Bioinformatics analysis was used to further screen out the significant differential proteins that play a key role and to explore the mechanism of the body’s response to high-fat diets.
Materials and methods
Animals and treatment
Eighteen healthy male Sprague–Dawley rats which were 5 weeks old and weighing about 150 g at the start of the experiment were purchased from Comparative Medical Center of Yangzhou University, Jiangsu, China. The animal experiments conformed the U.S. National Institutes of Health guidelines for the care and use of laboratory animals (NIH publication no. 85-23 Rev. 1985) and were approved by the Animal Care Committee of the Center for Disease Control and Prevention (Jiangsu, China). Then, rats were randomly divided into a control group (C) and high-fat diet group (HF) (n 9). The control group was fed a low-fat diet (Table 1). The HF was fed a high-fat diet (Table 1) for 8 weeks. All rats were housed under a 12 h light–12 h dark cycle in a controlled room with a temperature of 23°C and a humidity of 50% and allowed free access to food and water. After 8 weeks, rats underwent 12 h of fasting prior to being anaesthetised and dissected. All rats were euthanised at the anoestrus period, following anaesthesia under 1 % sodium pentobarbital. Livers were removed and stored at 4 and −80°C for subsequent analyses.
Composition of the diets
Compliance with ethics guidelines
All institutional and national guidelines for the care and use of laboratory animals were followed.
Haematoxylin–eosin staining
Liver samples were fixed in 4 % paraformaldehyde for more than 48 h, followed by sectioning after embedding with paraffin. The paraffin section was stained by routine haematoxylin–eosin methods.
Protein extraction and normalisation
SDT buffer (4 % (w/v) SDS, 0·1 m dl-dithiothreitol, 100 mm Tris/HCl, pH 7·6) was added to the liver sample and transferred to 2 ml tubes with quartz sand (another 1/4 inch ceramic bead MP 6540-424 for tissue samples). The lysate was homogenised by an MP homogeniser (24 × 2, 6·0 m/s, 60 s, twice). The homogenate was sonicated and then boiled for 15 min. After centrifuged at 14 000 g for 40 min, the supernatant was filtered with 0·22 µm filters. The filtrate was quantified with the Bicinchoninic Acid Protein Assay Kit (Bio-Rad). The sample was stored at −80°C. Equivalent amounts of protein from each of the three different rats were pooled to generate three protein samples for each group.
SDS-PAGE separation
A quantity of 20 μg of proteins for each sample was mixed with 5× loading buffer and boiled for 5 min. The proteins were separated on 12·5 % SDS-PAGE gel (constant current 14 mA, 90 min). Protein bands were visualised by Coomassie Blue R-250 staining.
Filter-aided sample preparation digestion
A quantity of 200 μg of proteins for each sample was incorporated into 30 μl SDT buffer (4 % SDS, 100 mm dithiothreitol, 150 mm Tris-HCl, pH 8·0). The detergent, dithiothreitol and other low-molecular-weight components were removed using UA buffer (8 m urea, 150 mm Tris-HCl, pH 8·0) by repeated ultrafiltration (microcon units, 10 kDa). Then, 100 μl iodoacetamide (100 mm iodoacetamide in UA buffer) was added to block reduced cysteine residues, and the samples were incubated for 30 min in darkness. The filters were washed with 100 μl UA buffer three times and then with 100 μl 100 mm triethylammonium bicarbonate (TEAB) buffer twice. Finally, the protein suspensions were digested with 4 μg trypsin (Promega) in 40 μl TEAB buffer overnight at 37°C, and the resulting peptides were collected as a filtrate. The peptide content was estimated by UV light spectral density at 280 nm using an extinction coefficient of 1·1 of 0·1 % (g/l) solution which was calculated on the basis of the frequency of tryptophan and tyrosine in vertebrate proteins
Tandem mass tag labelling
The peptide mixture (100 μg) of each sample was labelled using a tandem mass tag reagent according to the manufacturer’s instructions (Thermo Fisher Scientific).
Peptide fractionation with high pH reversed phase
A Pierce high pH reversed-phase fractionation kit (Thermo Scientific) was used to fractionate tandem mass tag-labelled digest samples into ten fractions by an increasing acetonitrile step-gradient elution according to the instructions.
Mass spectrometry
HPLC
Each fraction was injected for nanoLC-MS/MS analysis. The peptide mixture was loaded onto a reversed-phase trap column (Thermo Scientific Acclaim PepMap100, 100 μm × 2 cm, nanoViper C18) connected to the C18-reversed-phase analytical column (Thermo Scientific Easy Column, 10 cm long, 75 μm inner diameter, 3 μm resin) in buffer A (0·1 % formic acid) and separated with a linear gradient of buffer B (84 % acetonitrile and 0·1 % formic acid) at a flow rate of 300 nl/min controlled by IntelliFlow technology.
1·5 h gradient: 0–55 % buffer B for 80 min, 55–100 % buffer B for 5 min, hold in 100 % buffer B for 5 min.
LC-MS/MS analysis
LC-MS/MS analysis was performed on a Q Exactive MS (Thermo Scientific) that was coupled with Easy nLC (Proxeon Biosystems, now Thermo Fisher Scientific) for 90 min (determined by project proposal). The MS was operated in positive ion mode. Mass spectometry data were acquired using a data-dependent top-ten method dynamically choosing the most abundant precursor ions from the survey scan (300–1800 m/z) for higher-energy C-trap dissociation (HCD) fragmentation. Automatic gain control target was set to 3e6 and maximum inject time to 10 ms. Dynamic exclusion duration was 40·0 s. Survey scans were acquired at a resolution of 70 000 at m/z 200, the resolution for HCD spectra was set to 35 000 at m/z 200 and isolation width was 2 m/z. Normalised collision energy was 30 eV, and the underfill ratio, which specifies the minimum percentage of the target value likely to be reached at maximum fill time, was defined as 0·1 %. The instrument was run with peptide recognition mode enabled.
Data analysis
MS/MS spectra were searched using MASCOT engine (Matrix Science; version 2.2) embedded into Proteome Discoverer 1.4 (online Supplementary Table S1).
Bioinformatics analysis
Hierarchical clustering
The protein-relative expression data were selected for hierarchical clustering analysis, and Cluster 3.0 and the Java Treeview software were used. Euclidean distance algorithm for measuring similarity and average linkage clustering algorithm (clustering uses the centroids of the observations) for clustering were selected when performing hierarchical clustering.
Gene ontology functional annotation
The protein sequences of differentially expressed proteins were in batches retrieved from UniProtKB database (Release 2016_10) in FASTA format. The retrieved sequences were locally searched against SwissProt database using the NCBI BLAST + client software (ncbi-blast-2.2.28+-win32.exe) to find homologue sequences, from which the functional annotation can be transferred to the studied sequences. In this work, the top ten blast hits with E-value less than 1e-3 for each query sequence were retrieved and loaded into Blast2GO (version 3.3.5) for gene ontology (GO) mapping and annotation. In this work, an annotation configuration with an E-value filter of 1e-6, default gradual EC weights, a GO weight of 5 and an annotation cut-off of 75 was chosen. Un-annotated sequences were then re-annotated with more permissive parameters. The sequences without BLAST hits and un-annotated sequences were then selected to go through an InterProScan against EBI databases to retrieve functional annotations of protein motifs and merge the InterProScan GO terms to the annotation set. The GO annotation results were plotted by R scripts.
Kyoto Encyclopedia of Genes and Genomes pathway annotation
The FASTA protein sequences of differentially changed proteins were blasted against the online Kyoto Encyclopedia of Genes and Genomes (KEGG) database (http://geneontology.org/) to retrieve their KEGG orthology and were subsequently mapped to pathways in KEGG. The corresponding KEGG pathways were extracted.
Functional enrichment analysis
To further explore the impact of differentially expressed protein in cell physiological process and discover internal relations between differentially expressed proteins, enrichment analysis was performed. GO enrichment on three ontologies (biological process, molecular function and cellular component) and KEGG pathway enrichment analyses were applied based on the Fisher’s exact test, considering the whole quantified protein annotations as background data set. Benjamini–Hochberg correction for multiple testing was further applied to adjust derived P values. Only functional categories and pathways with P values under a threshold of 0·05 were considered as significant.
Results
Obesity and liver steatosis
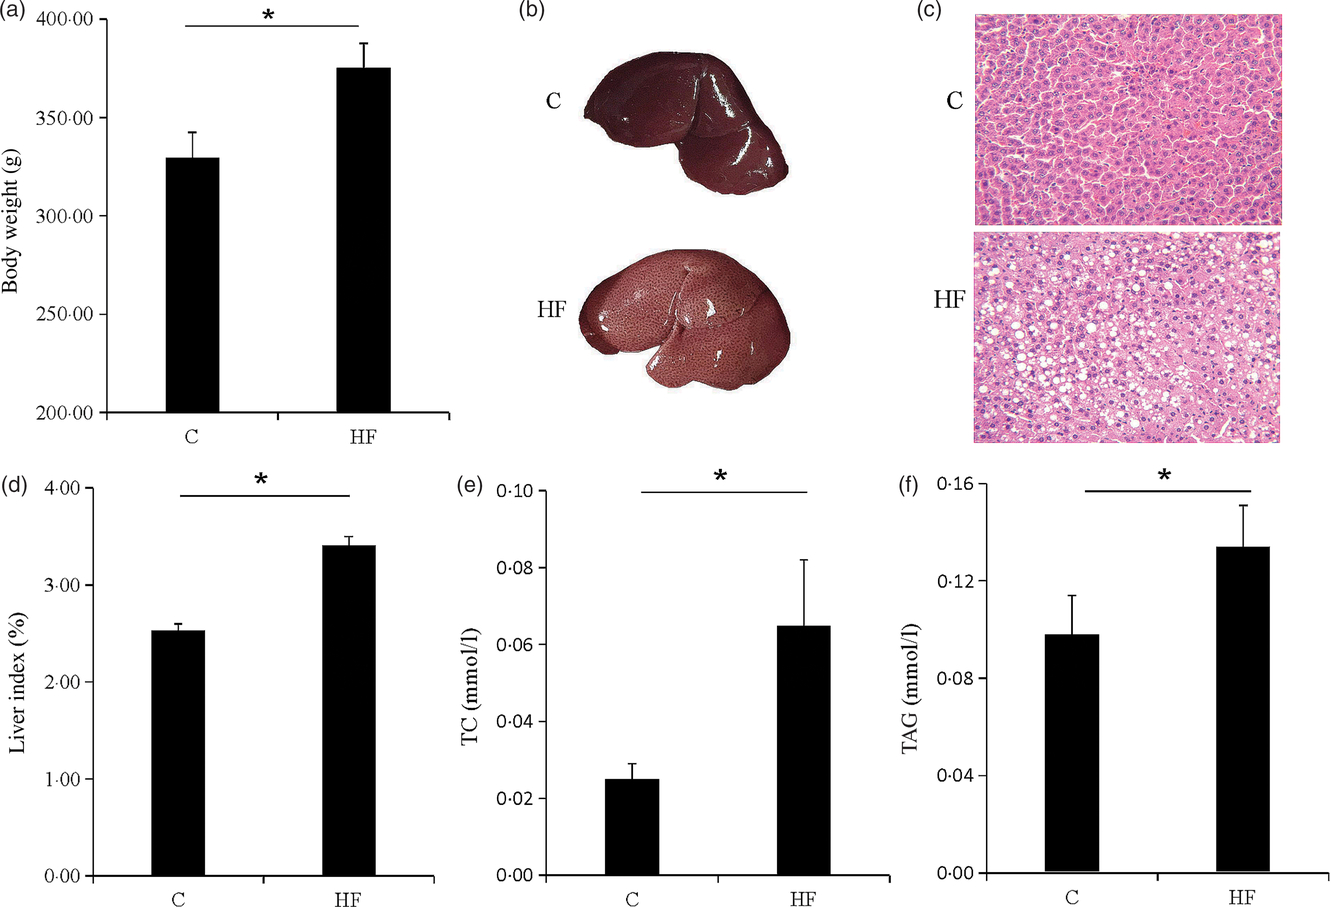
The symptoms of obesity were observed in the HF. The body weight of the HF was significantly increased (P < 0·05) (Fig. 1(a)). The liver of the rat was swollen and brittle (Fig. 1(b)), and haematoxylin–eosin staining showed that the structure of the liver cells was destroyed and a large number of fat vacuoles were observed (Fig. 1(c)). Liver index, liver TAG and total cholesterol were significantly increased (P < 0·05) (Fig. 1(d)–(f)). The high-fat diet caused rat liver fat accumulation, and the lipid metabolism balance in the liver was destroyed.
Obesity and liver steatosis. (a) Body weight of rats. (b) Images of representative rat livers. (c) Haematoxylin–eosin staining of livers. (d) Liver index of livers. (e and f) Total cholesterol (TC) and TAG of livers. Values are means (n 9), with their standard errors represented by vertical bars. * P < 0·05. C, control group; HF, high-fat diet group.
Screening of differentially expressed proteins
A total of 4056 proteins were identified by MS. Proteins that conformed to the following screening criteria were deemed as differentially expressed: 1·2-fold for up-regulated proteins and 0·83-fold for down-regulated proteins (P < 0·05). A total of 198 differentially expressed proteins (103 increased, ninety-five decreased) were found between HF and C (Table 2, online Supplementary Table S2).
Differentially expressed proteins (top 20)
Hierarchical clustering
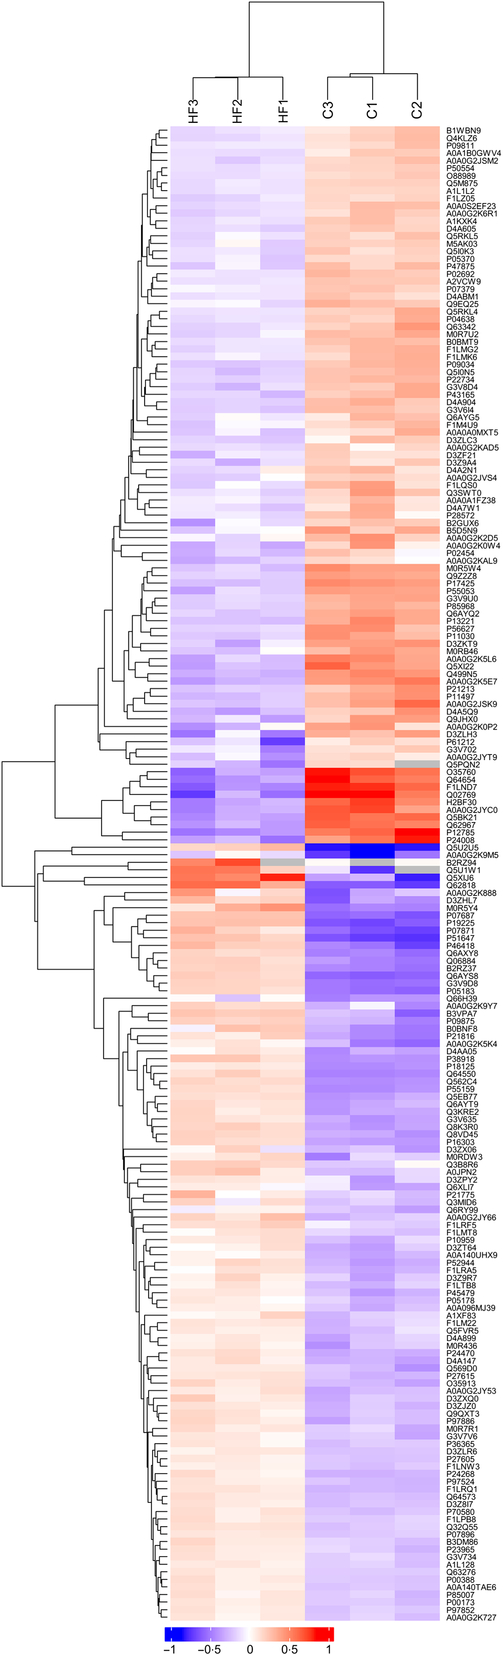
Hierarchical clustering results were expressed as a tree heat map (Fig. 2). The differentially expressed proteins screened in the present study can effectively separate the HF from the C. The hierarchical clustering analysis thus supported that the differentially expressed proteins screened out were reasonable.
Hierarchical clustering. X-coordinates represent samples and Y-coordinates differentially expressed proteins. Log2-expression of differentially expressed proteins in tested samples is displayed in different colours in the heat map, with red representing up-regulation and green indicating down-regulation.
Gene ontology functional annotation analysis
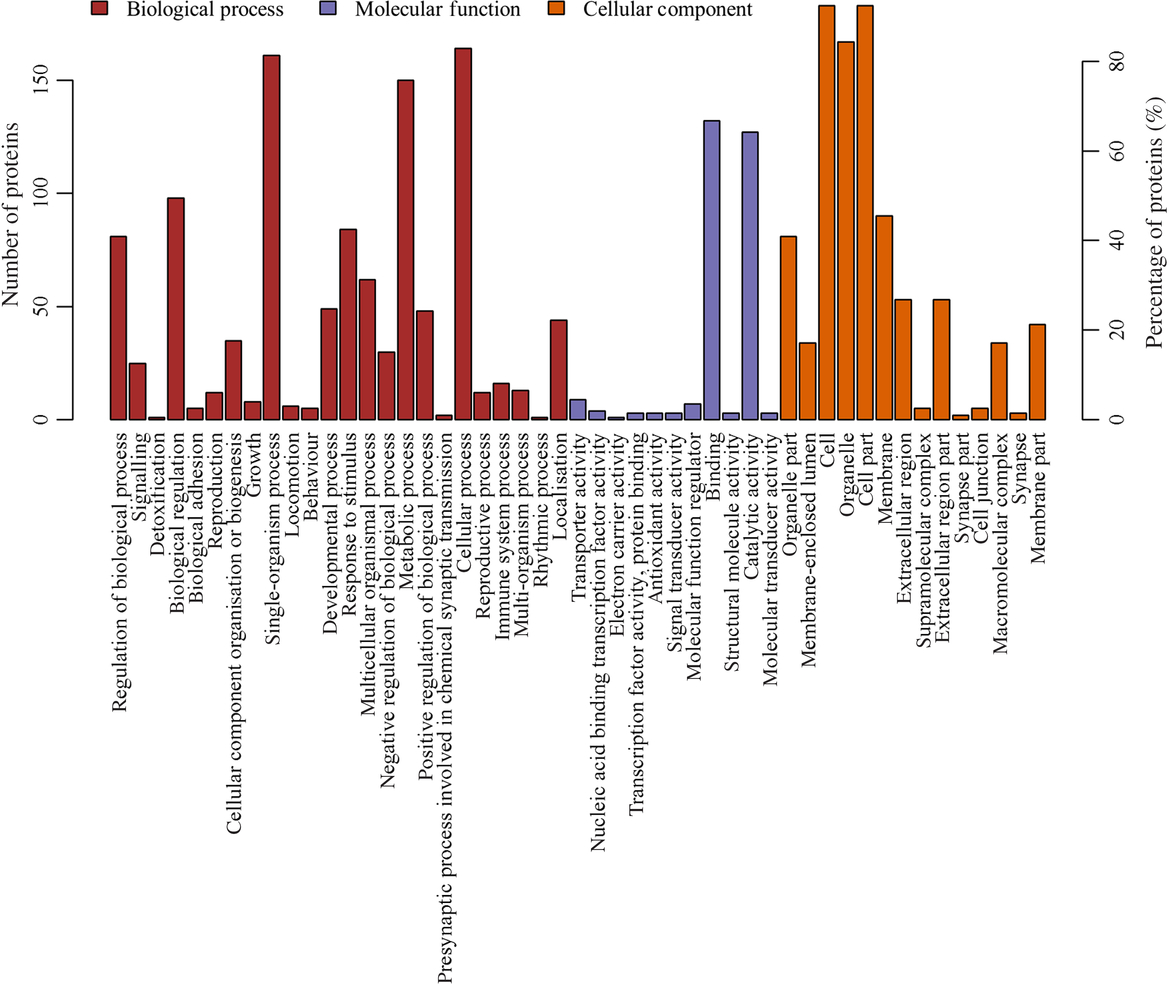
The most prevalent biological processes were biological_process (178), cellular process (164), single-organism cellular process (161) and metabolic process (150). The most prevalent cellular components were located in the cellular_component (194), cell (183), cell part (183) and intracellular (177). The most predominant molecular functions were molecular_function (182), binding (13) and catalytic activity (127) (Fig. 3, online Supplementary Table S3).
Gene ontology (GO) functional annotation analysis of the differentially expressed proteins. X-coordinates represent GO functional annotations and Y-coordinates represent the number and percentage of proteins.
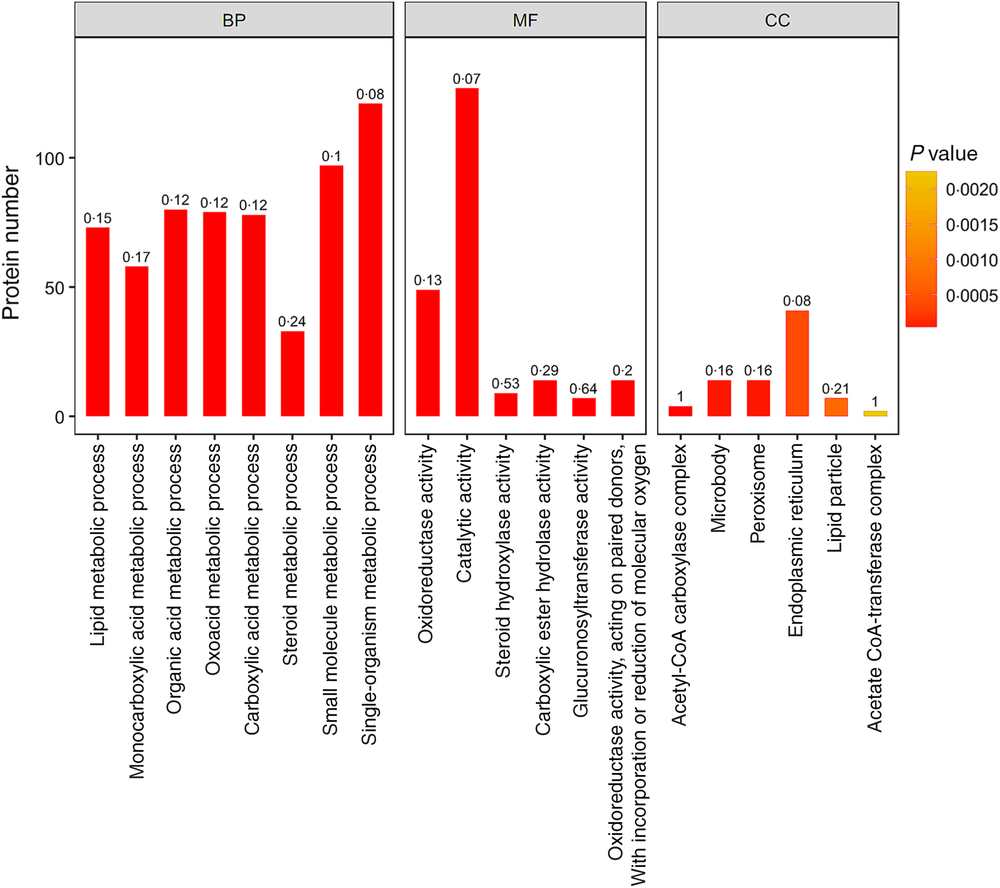
In addition, lipid metabolic process, monocarboxylic acid metabolic process, organic acid metabolic process, oxoacid metabolic process, carboxylic acid metabolic process and other important biological processes changed significantly. Oxidoreductase activity, catalytic activity, steroid hydroxylase activity, carboxylic ester hydrolase activity, glucuronosyltransferase activity and other molecular function change significantly. Acetyl-CoA carboxylase complex, microbody, peroxisome, endoplasmic reticulum, lipid particle and other positioning proteins changed significantly (Fig. 4).
Gene ontology (GO) functional enrichment analysis of the differentially expressed proteins (top 20). The bar graph colour indicates the significance of the enriched GO functional classification, and the P value is calculated based on Fisher’s exact test. The colour gradient represents the magnitude of the P value. The closer to the red, the smaller the P value, and the higher the significance level of the corresponding GO functional category enrichment. The label above the bar graph shows the enrichment factor (rich Factor ≤ 1), and the enrichment factor indicates the ratio of the number of differentially expressed proteins annotated to a GO functional category to the number of all identified proteins annotated to the GO functional category. BP, biological processes; MF, molecular functions; CC, cellular components.
Kyoto Encyclopaedia of Genes and Genomes pathway analysis
A total of 143 KEGG pathways (online Supplementary Table S4) had been enriched, and forty important KEGG pathways (Table 3) changed significantly such as retinol metabolism, steroid hormone biosynthesis, PPAR signalling pathway, fatty acid metabolism, IR and so on.
Significantly changed pathways of high-fat diet group:control group

Discussion
The liver is the main site of lipid metabolism. On the one hand, the liver takes up NEFA from the blood to synthesise TAG. On the other hand, the liver secretes endogenous TAG synthesised into the blood, thereby transporting it to the extrahepatic tissues. The two are in a dynamic balance. Once the balance is destroyed, it will cause fat to accumulate in the liver. Studies have reported that high-fat diet has an important impact on the lipid metabolism process in rat liver(Reference Benard, Lim and Apontes8). The present study further validates this view and discovers some new differentially expressed proteins. GO functional enrichment analysis revealed significant changes in the multiple biological processes associated with lipid metabolism, and the KEGG analysis found significant changes in the pathways of fatty acid synthesis, degradation and metabolism. The high-fat diet caused significant changes in proteins such as peroxisomal bifunctional enzyme (Ehhadh), 3-ketoacyl-CoA thiolase B (Acaa1b), 3-ketoacyl-CoA thiolase A (Acaa1a), Acetyl-CoA carboxylase 1 (Acaca1) and Acetyl-CoA acetyltransferase (Acat) on these pathways. Ehhadh is part of the classical peroxisomal fatty acid β-oxidation pathway. It is a downstream target gene of PPARα and regulates its gene expression through PPARα to participate in intracellular lipid metabolism(Reference Houten, Denis and Argmann9). Overexpression of Ehhadh leads to a decrease in intracellular fatty acid content(Reference Fang, Zhao and Jiang10). Acaa1a and Acaa1b are two different peroxisomal 3-ketoacyl-CoA thiolases for very-long-straight-chain fatty acids(Reference Chevillard, Clemencet and Etienne11). There are four enzymatic steps in each cycle of peroxisomal β-oxidation: oxidation, hydration, dehydrogenation and thiolytic cleavage. Acaa1a and Acaa1b catalyse the final step in the peroxisomal β-oxidation of straight-chain acyl-CoAs(Reference Poirier, Antonenkov and Glumoff12–Reference Wanders and Waterham14). Acaca1 is a rate-limiting enzyme for fatty acid synthesis which catalyses the first step of fatty acid synthesis. Acaca1 is mainly found in adipose tissue and liver, and its main function is to produce malonyl-CoA as an activated two-carbon unit for fatty acid synthesis(Reference Davis, Solbiati and Cronan15). Acat is a membrane protein located on the endoplasmic reticulum of cells and is the rate-limiting enzyme for the synthesis of cholesterol and long-chain fatty acyl-CoA(Reference Kursula, Ojala and Lambeir16). In the present study, the expression of Ehhadh, Acaa1a and Acaa1b was significantly up-regulated and the expression levels of Acaca1 and Acat were significantly down-regulated in the HF. It indicates that after ingesting a high-fat diet, the body inhibited fatty acid synthesis, promoted the oxidation process of fatty acids in peroxisomal and accelerated the degradation of fatty acids in order to maintain lipid metabolism balance.
The liver is the main target organ for insulin action(Reference Hundal, Krssak and Dufour17). IR is the basis for the link between obesity and most of its associated metabolic disorders, including type 2 diabetes, fatty liver disease, dyslipidaemia and CVD, and is usually only manifested in the clinical manifestations of obesity(Reference Semple, Savage and Cochran18). The KEGG analysis revealed significant changes in the IR pathway and insulin signalling pathway. Proteins such as acetyl-CoA carboxylase β (Acacb), phosphoenolpyruvate carboxykinase and glycogen phosphorylase were significantly down-regulated in the HF. Acetyl-CoA carboxylase β plays an important role in the regulation of lipid synthesis and oxidation in lipid metabolism and has a close relationship with insulin(Reference Wang, Zhang and Zhang19). Insulin can restore activity by dephosphorylation of Acacb by the action of protein phosphatase. Acetyl-CoA carboxylase β reduces the oxidation of fatty acids and increases the accumulation of fat in the body, which in turn increases the body’s IR(Reference Tang, Leung and Chan20). Phosphoenolpyruvate carboxykinase is a key rate-limiting enzyme in gluconeogenesis that catalyses the conversion of oxaloacetate to phosphoenolpyruvate(Reference Matsuoka, Shima and Kuramoto21). Glycogen phosphorylase is a key enzyme in glycogen metabolism(Reference Diazlobo, Garciaamoros and Fita22). By inhibiting the protein expression of Acacb, phosphoenolpyruvate carboxykinase and glycogen phosphorylase, the body inhibits the gluconeogenesis pathway and enhances catabolism and increases the sensitivity of hepatic insulin after a high-fat diet.
At the same time, the liver is also the main site of amino acid metabolism. Amino acids are decomposed into α-keto acids by deamination. Part of α-keto acid produces glucose through gluconeogenesis, and some α-keto acids participate in fat metabolism to produce fat(Reference Bergman and Heitmann23). The KEGG pathway analysis revealed significant changes in a variety of amino acid metabolic pathways such as glycine, serine and threonine metabolism, cysteine and methionine metabolism, alanine, aspartate and glutamate metabolism and tyrosine metabolism. In these pathways, aspartate aminotransferase cytoplasmic (GOT1), argininosuccinate synthase (ASS1), l-serine dehydratase/l-threonine deaminase (Sds) and 4-aminobutyrate aminotransferase (Abat) were significantly down-regulated. We speculate that the body inhibits gluconeogenesis and fat metabolism by inhibiting partial amino acid metabolism.
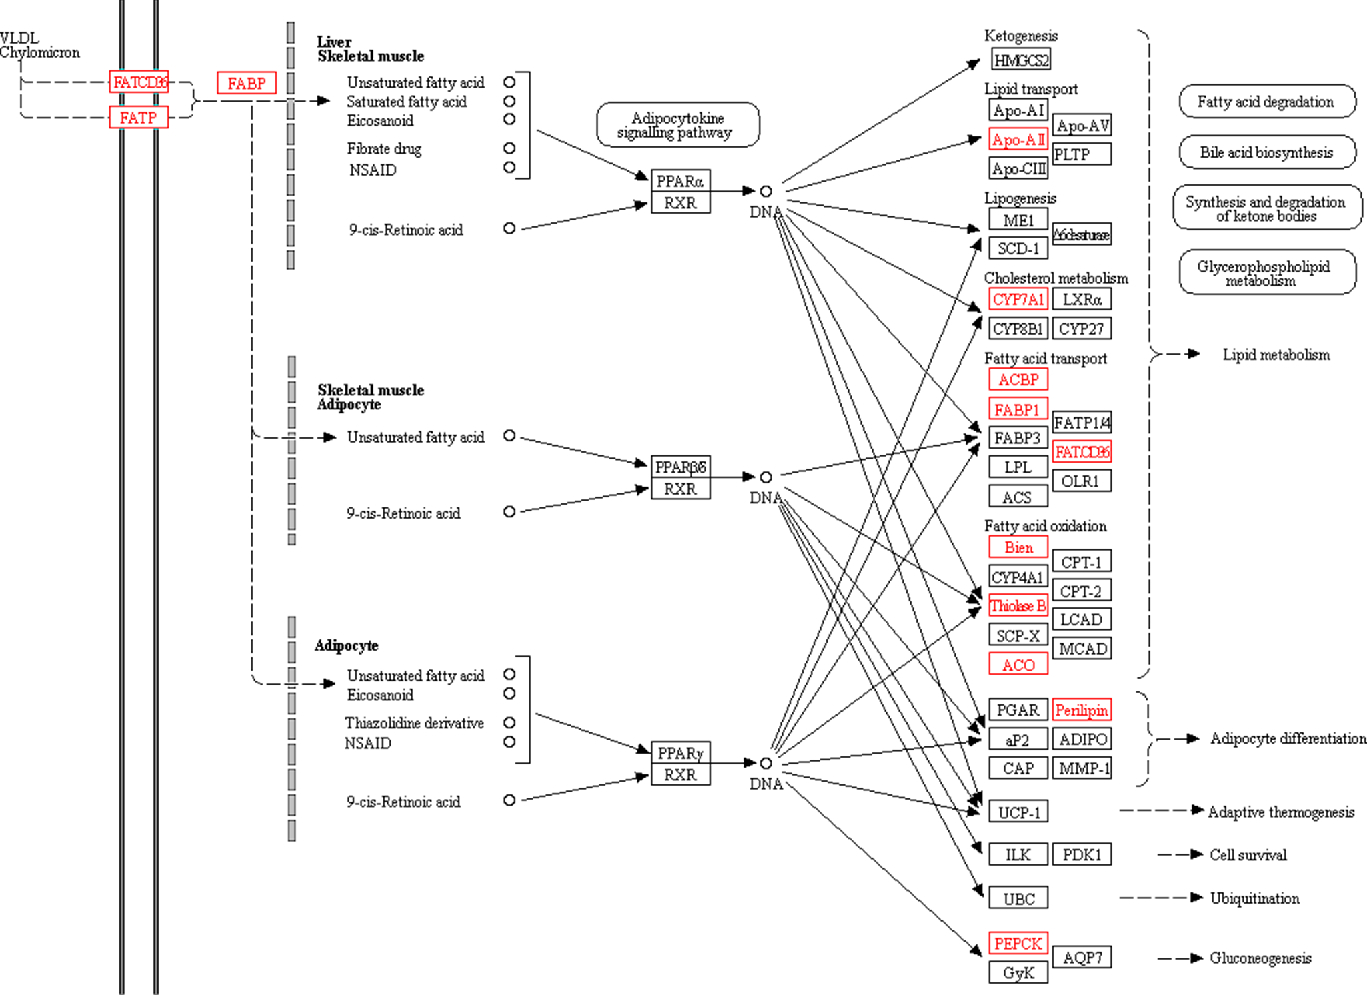
The PPAR signalling pathway plays an important role in regulating lipid metabolism and glucose metabolism. The KEGG pathway analysis also found significant changes in the PPAR signalling pathway. Peroxisome proliferator-activated receptors consist of three receptor subtypes, PPAR-α, β/δ and γ. Peroxisome proliferator-activated receptor-α plays a key role in regulating fatty acid uptake, β-oxidation, ketone synthesis, bile acid synthesis and TAG transport(Reference Cave, Clair and Hardesty24, Reference Desvergne and Wahli25). Peroxisome proliferator-activated receptor-β/δ is involved in the regulation of mitochondrial metabolism and fatty acid β-oxidation(Reference Mackenzie and Lione26, Reference Tanaka, Yamamoto and Iwasaki27). Peroxisome proliferator-activated receptor-γ regulates adipocyte differentiation and lipid metabolism(Reference Li, Wang and Lama28). In the present study, a total of fourteen PPAR-related proteins were significantly changed (Fig. 5). The body inhibits the expression of fatty acid-binding protein by increasing the expression of platelet glycoprotein 4 (FATCd36). Cholesterol metabolism-related protein (cholesterol 7-α-mono-oxygenase (CYP7A1)) and fatty acid oxidation-related proteins (3-ketoacyl-CoA thiolase B (thiolase B/Acaa1b) and acyl-CoA oxidase) were significantly up-regulated. Lipid transport-related protein (apo A-II (Apoa2)) and fatty acid transport-related proteins (acyl-CoA-binding protein and liver fatty acid-binding protein (Fabp1)) were significantly down-regulated. In turn, it affects lipid metabolism and accelerates fatty acid degradation. In addition, perilipin was significantly up-regulated to promote adipocyte differentiation, and Phosphoenolpyruvate carboxykinase was significantly down-regulated to inhibit gluconeogenesis.
PPAR signalling pathway. All differentially expressed proteins involved in this pathway are identified by red borders and fonts. Small circles represent small molecule metabolites, and large round boxes represent other pathways.
As the most important detoxification organ, the liver contains most of the phase I and phase II metabolic enzymes, which affect the metabolism of endogenous and exogenous substances(Reference Cerda, Hirata and Hirata29). KEGG pathway analysis revealed that metabolism of xenobiotics by cytochrome P450, drug metabolism – cytochrome P450, drug metabolism – other enzymes, steroid hormone biosynthesis and other pathways had changed significantly. The most important enzymes involved in these metabolisms were cytochrome P450 (CYP450) and UDP-glucuronosyltransferase (UGT). CYP450 is an enzyme system involved in phase I metabolism(Reference Sanwald, David and Dow30). The metabolism of exogenous compounds (drugs, environmental pollutants, carcinogens, etc.) and endogenous compounds (steroid hormones, cholesterol, fatty acids, etc.) is mainly catalysed by CYP450(Reference Fanni, Ambu and Gerosa31). The protein expression of CYP2C70, CYP7A1, CYP3A2, CYP3A23/3A1, CYP2C23, CYP3A18, CYP2C6 and CYP3A9 in the HF was significantly up-regulated in the present study. The KEGG pathway analysis revealed that these significant differential proteins are primarily involved in the steroid hormone biosynthesis pathway and the retinol metabolic pathway. This suggests that a high-fat diet can induce the expression of part of CYP450 in the liver, thereby promoting the metabolism of steroid hormones and retinol. The uronic acid-binding reaction is an important phase II metabolic pathway in vivo and mainly catalysed by UGT. UGT is a type of microsomal glycoprotein on the endoplasmic reticulum. When the liver lacks UGT, the liver’s detoxification function of endogenous compounds (bilirubin, bile acids, thyroid hormones, and steroids) and exogenous compounds (drugs) will be affected, which in turn causes liver cell to be damaged(Reference Kostrubsky, Sinclair and Strom32). In the present study, the protein expression of UGT1A1, UGT2B15, UGT1A5, UGT2A3, UGT1, UGT2B (F1LM22), UGT (RGD1559459), UGT2B (A1XF83) and UGT2B1 in the HF was significantly up-regulated. It indicated that the intake of high-fat diet had a certain induction effect on the expression of UGT. The body accelerates the biotransformation of bile acids, steroids and hormones by increasing the expression of UGT, so as to avoid damage to the liver caused by poisons. Studies had shown that in the liver damage state of liver fibrosis and early liver cirrhosis, the expression of UGT in rat liver was up-regulated(Reference Debinski, Mackenzie and Lee33), which may also indicate the occurrence of early liver fibrosis in the HF.
In addition, the phase I metabolic enzyme carboxylic ester hydrolase/carboxylesterase (Ces (LOC108348093), Ces1d (P16303), Ces2a, Ces2h, Ces1d (A0A0G2JY66), Ces1c and Ces2g), and phase II metabolic enzyme glutathione S-transferase α-5 (Gsta5) and N-acetyltransferase (Nat8 and Nat8f2) were significantly up-regulated. It showed the induction of metabolic enzymes by high-fat diet to promote liver metabolism.
The present study performed proteomic approaches and analszed the changes from a macro perspective. In future research, validation analysis of the results and more in-depth research will focus on some of the significantly changed proteins and pathways which we are interested in.
Conclusions
In the present study, rats were fed a high-fat diet and tandem mass tag-based proteomics techniques were used to study the effects of high-fat diet on rat liver. We identified a total of 198 significant differential proteins, and more new differentially expressed proteins were discovered. These significant differentially expressed proteins are primarily involved in lipid metabolism and glucose metabolism processes. In order to maintain physiological balance, the body inhibits fatty acid synthesis by regulating some key proteins, thereby promoting the oxidation of fatty acids and accelerating the degradation of fatty acids. These can be understood as the body’s self-protection mechanism to counteract liver fat accumulation and degeneration. It is of great significance to study the mechanism of promoting the effect of high-fat diet on rat liver.
Acknowledgements
We are grateful to Shanghai Applied Protein Technology Co., Ltd for their technical assistance.
The study was supported by the Strategic Priority Research Program of the National Natural Science Foundation of China (no. 31571855 and no. 31701627).
J. S., R. G., Y. H., W. X. and C W. had substantial contributions to conception and design. H. Q., D. C., X. C., B. Y. and Y. H. had substantial contributions to data acquisition and analysis. J. S. and H. Q. drafted the article and revised it critically for important intellectual content. Y. H. and R. G. approved the final version to be published.
The authors declare that they have no conflicts of interest.
Supplementary material
For supplementary material/s referred to in this article, please visit https://doi.org/10.1017/S0007114519001740


