


1. Introduction
Why do people use metaphoric language rather than literal language? One answer to this question is that the metaphoric use of concrete, embodied concepts facilitates the understanding of more abstract concepts (e.g., Lakoff & Johnson, Reference Lakoff and Johnson1980). Yet, there is a long tradition in the study of metaphor that focuses on the role of metaphor in conceptualizing emotion, which is itself embodied (Asch, Reference Asch and Werner1955, Reference Asch, Tagiuri and Petrullo1958; Kövecses, Reference Kövecses2003). For example, Lakoff (Reference Lakoff1987) presented a case study of metaphors in English for the conceptualization of anger, identifying several different metaphor families, with the most productive one being the idea of anger as the heating of a fluid within the container of the body which can result in explosions, letting off steam, or merely cooling down. Lakoff and Johnson’s (Reference Lakoff and Johnson1980) ideas about metaphor have spread to more subtle literary analyses (e.g., Otis, Reference Otis2019) that consider the way in which conceptual metaphors, such as advising someone to “move on” can be used in the cultural control of emotion. Both Kövecses and Otis explored the extent to which communication concerning emotions is facilitated by the use of metaphoric language, but in what sense is emotion “abstract”? Emotion seems like a fundamentally embodied experience, so why do we need to use metaphors to understand it? And what about the communication of emotion itself?
For the past decade, Citron and colleagues have been using neuroimaging to show that metaphoric texts convey more emotion than do literal texts that have ostensibly the same meaning (Citron et al., Reference Citron, Güsten, Michaelis and Goldberg2016; Reference Citron, Cacciari, Funcke, Hsu and Jacobs2019; Reference Citron, Michaelis and Goldberg2020; Citron & Goldberg, Reference Citron and Goldberg2014, Citron & Zervos, Reference Citron, Zervos, Baicchi, Digonnet and Sandford2018). This was found even for conventional metaphors and idioms that had ostensibly very little to do with emotion. Citron et al. (Reference Citron, Michaelis and Goldberg2020) argued that the use of metaphoric language, as well as the use of idioms, is effective and often preferred because it produces emotional responses. In designing their study, Citron et al. (Reference Citron, Güsten, Michaelis and Goldberg2016) matched literal and metaphoric stimuli on explicit ratings of arousal and valence, seeking to show that the emotional responses to metaphors they observed with neuroimaging could not be explained by explicitly available emotional content of the stimuli. These studies are fascinating and important in seeming to show that metaphor can evoke emotional responses without people necessarily being aware of their emotional responses.
The present investigation seeks to replicate and extend these observations of Citron et al. (Reference Citron, Güsten, Michaelis and Goldberg2016) by using a different kind of behavioral measure that might allow us to (1) more closely characterize the emotional content conveyed by metaphoric language and (2) to do so without relying on brain imaging technology. For this purpose, we used the semantic differential method originally developed by Osgood (Reference Osgood1952); Osgood et al. (Reference Osgood, Suci and Tannenbaum1957). We first apply the method to conventional metaphoric language in short vignettes, such as those used by Citron et al. We then use it to test a further question: (3) whether emotional responses differ between metaphor and simile.
1.1. The semantic differential method
In the semantic differential method, participants are asked to rate items on several sets of polar adjectives arranged as Likert scales, such as sweet/bitter, loud/quiet, and warm/cold. Osgood (Reference Osgood1952) originally developed the method of having participants rate words along dozens of polar semantic dimensions in an attempt to quantify the semantic content of words. Using factor analysis, Osgood et al. (Reference Osgood, Suci and Tannenbaum1957) found that exactly three dimensions reliably showed up across many different contexts. He labeled these dimensions “evaluation,” “potency,” and “activity.” Ultimately, Osgood et al. (Reference Osgood, May and Miron1975) concluded that these were affective dimensions that showed up across 20 diverse languages and cultures. Some have mapped them to emotional constructs of valence, dominance, and arousal, respectively (e.g., Bradley & Lang, Reference Bradley and Lang1994).
We will treat these dimensions as latent, or implicit dimensions of human judgment that capture emotional content. The semantic differential method typically produces similar dimensions of affective judgment even when the semantic dimensions used for ratings are not obviously affective terms. This is true whether it is applied to judging social categories (e.g., Billups et al., Reference Billups, Thelamour, Thibodeau and Durgin2022) or odors (Dalton et al., Reference Dalton, Maute, Oshida, Hikichi and Izumi2008). In some cases, the dimensions revealed include dynamism (i.e., arousal) in place of activity and potency (Osgood et al., Reference Osgood, Suci and Tannenbaum1957). Others have found evidence for a dimension of emotional depth (Bottenberg, Reference Bottenberg1975; Russell, Reference Russell1978). Data from the semantic differential method can be analyzed using principal component analysis (PCA: Dunteman, Reference Dunteman1989), which finds the underlying dimensions implicit in ratings that capture the most variance in those ratings. This is the method of analysis used by Billups et al. in their study of race and gender biases. They replicated the observation by Kervyn et al. (Reference Kervyn, Fiske and Yzerbyt2013) that even the popular dimensions of “warmth” and “competence,” can be articulated in terms of the semantic differential dimensions of valence and potency. Billups et al. found that black-white racial bias in the US aligned with differences on the evaluation dimension while gender bias aligned with differences on the potency dimension.
1.2. Social meanings of sensory metaphor
It is worth noting that the very processes of rating items using semantic differential scales may typically involve thinking metaphorically. Many of the scales used by Osgood et al. (Reference Osgood, Suci and Tannenbaum1957) involved sensory contrasts (big v. small; dark v. light; loud v. quiet; sweet versus bitter) that may often be understood metaphorically. Asch (Reference Asch and Werner1955, Reference Asch, Tagiuri and Petrullo1958) noted that the most sensory words have a figurative meaning that is applied to social objects (e.g., many languages have metaphors for a bitter person, an abrasive person, a warm person, or can describe a person’s actions as “dark” or “big,” etc.). Asch found that these figurative meanings are typically similar (or mutually intelligible) across quite different languages. The seemingly non-arbitrary nature of these mappings encouraged us to inquire if the emotions conveyed by metaphors include an underlying structure which motivates these alignments. Recently, Zhu et al. (Reference Zhu, Chen and Durgin2024) have found that concepts metaphorized by the same sensorimotor categories seem to show more categorical alignment than can be explained by their literal meaning, suggesting the possibility of emotional alignment. Further considerations regarding potentially metaphoric rating scales will be addressed in the general discussion.
1.3. Using the semantic differential method on simile
Whereas simile is generally regarded as a form of figurative language, it has been argued by Glucksberg and Haught (e.g., Reference Glucksberg and Haught2006) that the meaning of similes (e.g., His job was like a jail.) differs substantially from that of the corresponding metaphor (i.e., His job was a jail.). In addition to replicating and extending the findings of Citron et al. (Reference Citron, Güsten, Michaelis and Goldberg2016), it therefore seemed worthwhile to also use the semantic differential method to test whether the ability to evoke emotion is a capacity unique to metaphors or if it can be generalized to simile, a question that has not yet been addressed with neuro-imaging methods.
1.4. The present study
In Experiment 1, an existing set of conventional-metaphor stories and corresponding literal stories were used as items. They were first evaluated using explicit measures like those used for norming by Citron et al. (Reference Citron, Güsten, Michaelis and Goldberg2016). These explicit measures included ratings of valence and arousal. The emotional values of these stories were then tested implicitly, with a different set of participants, using semantic differential methods. To anticipate, the semantic differential method revealed three orthogonal affective dimensions, (evaluation; dynamism; depth), each of which was (1) correlated with the explicit judgments of emotional valence that had been provided by other raters, and each of which (2) differed between metaphoric stories and their literal controls – despite that the explicit judgments of valence had not differentiated between metaphoric and literal stories. Experiment 2 collected semantic differential ratings of words used figuratively (both as metaphors and as similes) and literally (both as categorizations and as literal comparisons) and again found differences along all three affective dimensions between figurative and literal uses, but no differences between similes and metaphors.
2. Experiment 1. Replication of Citron et al. using the Semantic Differential method
Citron et al. (Reference Citron, Güsten, Michaelis and Goldberg2016) used two emotional norming variables (emotional arousal and emotional valence), to ensure that their stimuli did not differ in these explicit judgements of emotion. They tested other dimensions as well. Those norming surveys were used on the present stimuli for comparison with semantic differential methods.
2.1. Materials and methods
2.1.1. Ethical and open science
The methods reported here (including sample size, experimental design, analysis plan, and exclusion criteria) were approved by the local IRB and preregistered on aspredicted.org: https://aspredicted.org/B2J_H9Q. The analyses of Experiment 1 departed from the pre-registration by not limiting analysis to a normed subset of the stimuli (see Supplementary Materials online for more information). Complete data and analysis files for both Experiment 1 (including pre-registered analyses) and Experiment 2 as well as the full set of linguistic materials are available at: https://osf.io/cvf9p/?view_only=0258e7a4fca44607bf0faf501f3c0e57.
2.1.2. Materials
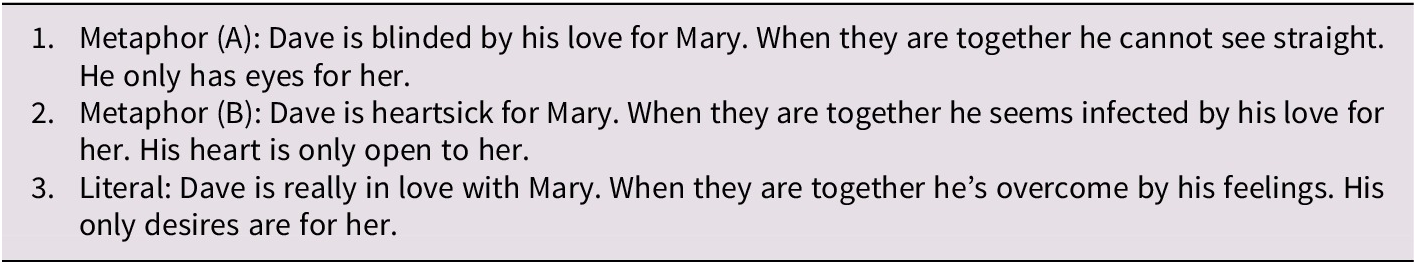
The story stimuli were adapted from Sikos et al. (Reference Sikos, Thibodeau, Strawser, Klein and Durgin2013); see also Thibodeau, Sikos & Durgin (Reference Thibodeau, Sikos and Durgin2017) and consisted of 72 metaphor stories, in pairs that aligned with 36 literal versions of the stories. An example set is shown in Table 1.
Example item for Experiment 1 with two metaphor versions and one matched literal version

2.1.3. Survey administration
Participants were recruited using Amazon’s Mechanical Turk administered through Cloud Research (formerly TurkPrime, Litman et al., Reference Litman, Robinson and Abberbock2017), limiting accounts to those in the US and Canada that had at least 90% acceptance rate on at least 500 tasks. Accounts that had participated in the norming surveys were prevented from participating in the main experiment. Before completing the main experiment, participants completed a brief attention screening task which involved a simple odd versus even number task. If the error rate was greater than 20%, they were disqualified from taking the survey. The experiments were created using PsyToolkit (Stoet, Reference Stoet2010, Reference Stoet2017).
2.1.4. Participants
Prior to conducting the main experiment, 240 participants were recruited (in September of 2022) to take norming questionnaires (replicating the norming surveys used by Citron et al., Reference Citron, Güsten, Michaelis and Goldberg2016) using the same attention tests, and processes of exclusion as were used for the main experiment. Thirty participants each were tested on six property surveys and two meaning-similarity surveys.
For the main experiment (semantic differential survey), 180 participants (30 for each of six experimental surveys) were recruited in November of 2022. Following the pre-registered exclusion criteria, 123 high-quality participants were retained. The tested population had a mean age of 41 years (SD = 12, min = 22, max = 77); gender categories were distributed as: 51% men, 47% woman, 1% non-binary, and 1% prefer not to answer; self-reported US race and ethnicity were: 3% American Indian or Alaska Native, 7% Asian or Asian American, 15% Black or African American, 75% White, and 5% Hispanic, Latino, or of Spanish origin.
2.1.5. Explicit ratings
The norming scales used by Citron et al. (Reference Citron, Güsten, Michaelis and Goldberg2016) were administered, in part, for comparison of their explicit ratings of emotion (valence and arousal) with the implicit measures of emotion we expected to obtain using the semantic differential method in the main experiment. Two different kinds of explicit survey were administered. For the first group of surveys (property surveys), participants were asked to rate the stories on seven-point Likert scales for six properties: imageability, understandability, naturalness, metaphoricity, emotional valence and emotional arousal. A second set of surveys asked other participants about the similarity in meaning between the literal stories and their metaphor counterparts.
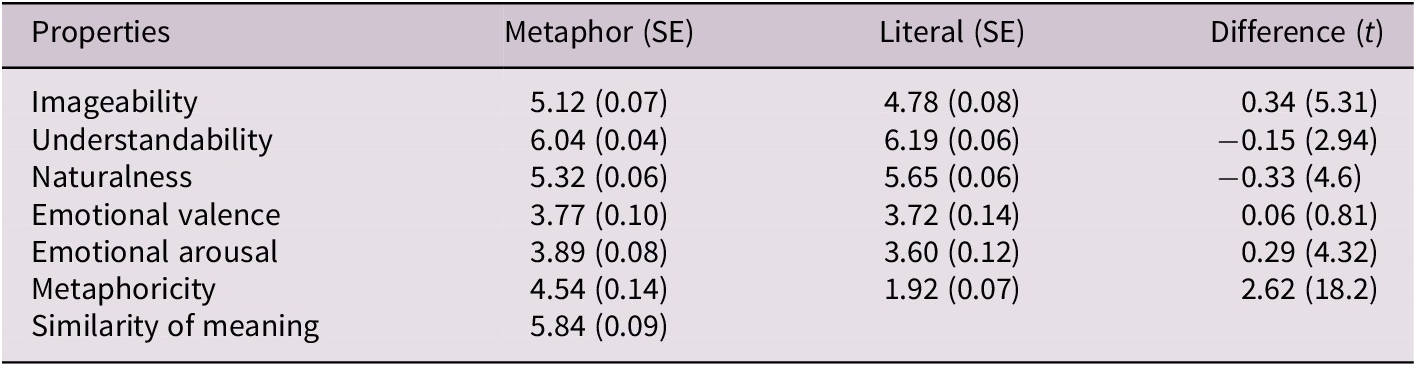
Citron et al. (Reference Citron, Güsten, Michaelis and Goldberg2016) identified 11 story pairs that did not differ reliably on the normed variables. In replicating this process, we found that a norming process that reduced our stimulus set to 12 story pairs could meet this criterion, but this was an insufficient number for effective modeling, so our analyses were applied to the entire set. Explicit ratings statistics of the full stimulus set are shown in Table 2. Note that the full stimulus set shows no differences in ratings of emotional valence between metaphorical and literal stories, whereas it was this variable that will be shown to be correlated most highly with each of the implicit measures of emotion in the main experiment.
Descriptive statistics of psycholinguistic and affective variables of the 72 metaphorical and 36 literal stories

2.1.6. Semantic differential surveys
The six semantic differential surveys asked participants to rate each story along ten rating scales made up of adjective pairs. Three scales were intended to tap the evaluation dimension (good-bad, bitter-sweet, simple-dramatic), three the potency dimension (weak-strong, deep-shallow, forceful-subtle), and three the activity dimension (slow-fast, dull-sharp, noisy-serene). In each of those three lists, the first two items are taken from Osgood et al. (Reference Osgood, May and Miron1975), while the third was a modification of prior scales with an eye toward literary aesthetics. An abstract-concrete scale, was also included. To reduce the burden on individual raters, each participant rated only 18 stories from the full set including both literal and metaphorical items, but no more than one from each triplet. The order of presentation of items was randomized within each survey.
2.2. Results
2.2.1. Principal component analysis of the experimental data
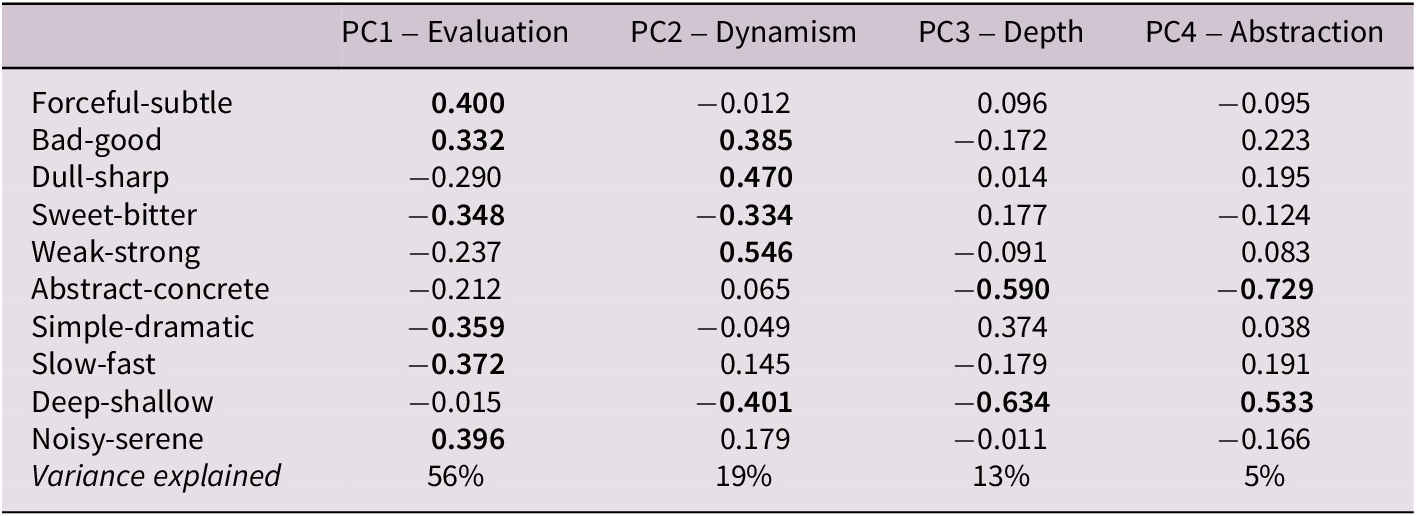
In accordance with the pre-registration, means of the semantic differential ratings for each item were submitted to principal component analysis (PCA; Dunteman, Reference Dunteman1989) with normalized variables (scaled, centered), singular variable decomposition (Mardia et al., Reference Mardia, Kent and Bibby1980), and orthogonal rotation. The resulting loadings (Table 3) were used to convert the individual ratings of participants to four implicit variables (of which the first three were of primary interest). Although we had expected to see evaluation, potency and activity dimensions, the dimensions observed were slightly different than anticipated, but still seemed to capture three emotional dimensions, as described below.
PCA loadings along the 10 rating scales and the variance explained by each PC. A high negative loading means the left end of the rating scale is aligned with the PC. Bolded loadings have absolute values higher than the mean for that PC

The first four principal components (PCs) accounted for 56%, 19%, 13%, and 5% of the variance in the ratings. The first PC (PC1) in the analysis is an evaluation scale that captures both aesthetic preferences (i.e., simple, serene, subtle) as well as the general positive emotional value of the stories (sweet) including two markers intended to capture the passive end of the activity scales: (serene, slow). The loadings for PC2 were high for both strong (normally a potency marker) and sharp (normally an activity marker), and thus, based on Osgood et al. (Reference Osgood, Suci and Tannenbaum1957), seemed to correspond to dynamism. In emotional terms, dynamism may be related to arousal. Thus we chose the dynamism label based on Osgood’s labeling system when a single dimension seemed to reflect both potency and activity. The loadings for PC3 were highest for deep (normally an indicator of potency) and abstract; this seems to be interpretable as an (emotional) depth dimension (Bottenberg, Reference Bottenberg1975; Russell, Reference Russell1978), which we included as the third implicit emotional dimension given that it will also be shown to be correlated with explicit judgments of emotional valence. Although we had only preregistered analysing three dimensions, PC4, with high loadings for shallow and abstract, was also analyzed as a control for abstraction, per se, because it seems to pair with PC3 in differentiating emotional depth (PC3) from shallow abstraction (PC4); PC4, uniquely, was not found to be correlated with the explicit judgments of emotional valence. Both PC3 and PC4 were correlated with explicit judgments of metaphoricity. The contrast between PC3 and PC4 motivated our labeling of PC3 based on the single dimension (deep) which loaded highest on PC3.
2.2.2. Relationship of PCs to norming variables
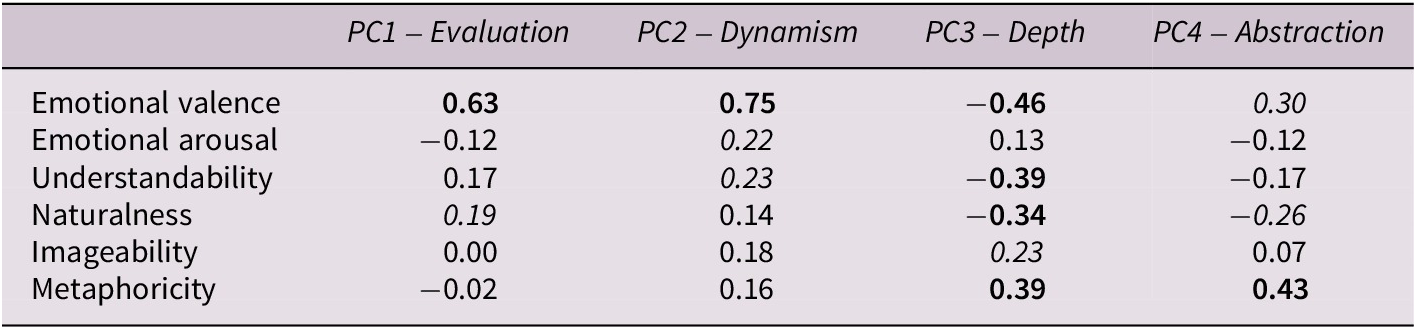
As pre-registered, the correlations between principal components in the semantic differential ratings and the explicitly rated norming variables for all 108 items are shown in Table 4. Although the principal components are orthogonal to each other, all of the first three components are significantly correlated with explicit judgments of emotional valence. This outcome, though not anticipated, is consistent with the hypothesis that the semantic differential method is successfully extracting implicit emotional variables and helps to motivate the interpretation of PC3 as emotional depth.
Correlations across item means between the principal components (main experiment) and the norming variables (collected from different participants). Bold numbers represent reliable correlations (p < .05; based on Bonferroni correction for the 24 comparisons). Italic values represent nominally reliable (and weak) correlations (with a raw p-value < .05)

Why should the correlations of the first three components be strongest with explicit judgments of emotional valence, while only one weak correlation shows up with ratings of emotional arousal? Intuitively, it seems possible that this is because participants’ explicit awareness of emotion is relatively undifferentiated. Apparently, a variety of emotional dimensions were all expressed in explicit judgments of the emotional valence dimension (good/bad). It thus seems possible that nearly all the sensitivity to emotional information (with valence in both directions) was carried in an undifferentiated form by explicit judgments of emotional valence collected during the simulated norming process. In brief, the first three components may be thought of as capturing different implicit components of what participants in the pre-experiment norming study rated explicitly as emotional valence.
2.2.3. Differences between metaphoric and literal stories along the four PCs
Separate linear mixed-effect regressions (LMER) were performed for each of the four PCs. PC2 and PC3 had been pre-registered as the variables of interest, but PC1 had proven to also be correlated with emotional valence. In each LMER, story type (literal or metaphorical) was the main predictor, and items and subjects and their slopes were sources of error (i.e., all LMERs were maximal). Degrees of freedom were computed using the Satterthwaite approximation (see Luke, Reference Luke2017) using the lmerTest library (Kuznetsova et al., Reference Kuznetsova, Brockhoff and Christensen2017) in R (v4.2.1; R Core Team, 2022).
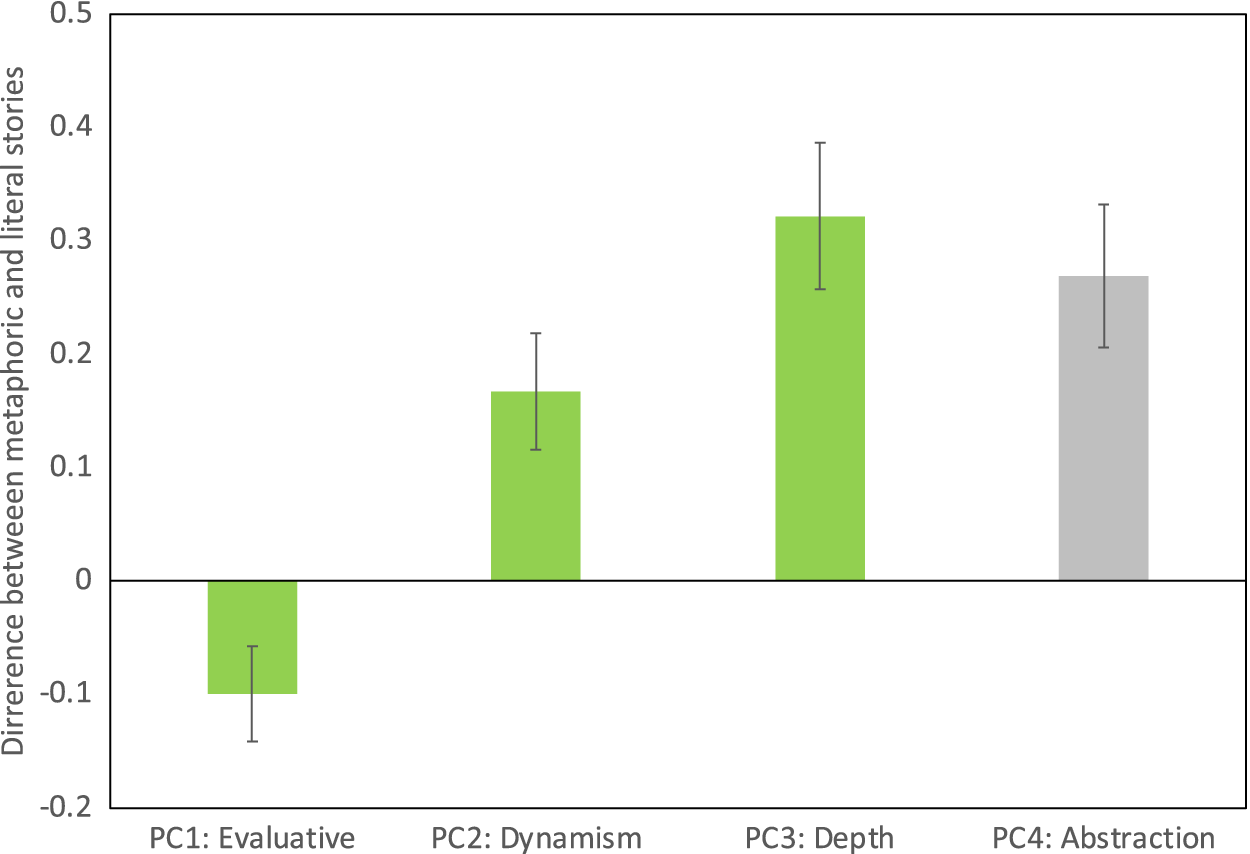
The differences between metaphors and literal stories are shown in Figure 1. Both Dynamism and Depth were significantly higher for metaphoric stories than for their literal controls, β = 0.17, t(44.3) = 3.23, p = .002, β = 0.32, t(45.1) = 5.03, p < .001.
Results of Experiment 1. Bars indicate the differences between metaphoric stories and their paired literal versions along each of the implicit semantic differential dimensions (a positive value means that the metaphoric items were rated higher on the dimension). The three orthogonal dimensions that were correlated with explicit ratings of emotional valence are shown in green. Standard errors of the means from the LMER models are shown.

Metaphoric stories were lower than their literal counterparts in the evaluation dimension (PC1), β = −0.10, t(37.8) = 2.38, p = .022. The fact that the evaluation dimension differentiates the metaphoric stories from the literal stories, despite their being matched on explicitly-rated emotional valence, is consistent with the idea that explicit ratings of emotional valence may incorporate multiple emotional dimensions that were only distinguished by the semantic differential method.
Because the abstract-concrete scale loaded highly on PC3, and might itself code for metaphoricity, an exploratory analysis examined PCs computed without the abstract-concrete scale data included. This had essentially no effect on the first two PCs, and deep versus shallow still had the highest loadings on the third PC (PC3’) (−0.794). Moreover, PC3’ was still negatively correlated with explicit judgments of emotional valence (r = −0.51), but was no longer strongly correlated with explicit judgments of metaphoricity (r = 0.17). Nonetheless, even with the abstract-concrete scale removed, PC3’ (Depth) was significantly higher for metaphoric stories than for literal stories, β = 0.15, t(29.2) = 2.92, p = .007.
Unsurprisingly PC4 (abstraction) was reliably higher for metaphoric than for literal sentences, β = 0.27, t(41.8) = 4.30, p < .001. This dimension does not seem to be tracking affective differences however, and is included here simply to help clarify that PC3 was measuring emotional depth, and not abstraction/metaphoricity, per se.
2.2.4. Discussion
The present experiment was primarily designed to identify emotional dimensions associated with metaphoricity by using the implicit measuring technique of the semantic differential, analyzed with PCA. With respect to this goal, three implicit emotional variables were identified, and labeled based on previously identified emotional dimensions: evaluation, dynamism, and depth. All three of these dimensions correlated with explicit judgments of emotional valence (with medium to strong correlations). Conventional metaphoric stories differed along all three of these dimensions from their literal counterparts. These findings are particularly striking, given that explicit judgments of emotional valence did not differ between literal and metaphoric stories. Nonetheless, these three orthogonal variables (evaluation, dynamism and depth), which were each correlated with emotional valance ratings, did differ significantly between literal and metaphoric stories. In this sense, the semantic differential method seems to be a useful tool for implicitly measuring emotional content without using neuroimaging. Like Citron et al. (Reference Citron, Güsten, Michaelis and Goldberg2016), we have identified differential affective responses that were not identified by explicit ratings of the emotional content of metaphoric stories. The semantic differential method also seemed to provide information about what those dimensions were.
Although the intent of the experiment was to test the traditional semantic differential dimensions (evaluation, potency, activity), the dimensions we actually observed differed from this expectation. Specifically, although they included an evaluation dimension, they also included what Osgood has called a dynamism dimension (combining potency and activity). Although dynamism might normally be thought of as a proxy for arousal (in the valence-arousal space of traditional emotion research), our dynamism dimension was only very weakly correlated with explicit judgments of arousal, but was highly correlated with explicit judgments of valence. We interpret this as evidence that explicit ratings of arousal may be quite limited tools for actually measuring the emotional impact of stories, whereas the semantic differential method seems quite sensitive to subtler shades of affective influence.
The depth dimension is not a traditional semantic differential dimension. The deep-shallow scale is listed as 1 of 4 standard measures of potency in English, as well as in several other languages carefully investigated by Osgood et al. (Reference Osgood, May and Miron1975), including Cantonese, Flemish, Thai and Turkish. However, given that both strong(−weak) and deep(−shallow) loaded on PC2, it seemed wiser not to label PC3 as a potency dimension. Moreover, prior work supports the idea of depth as an emotional dimension, and this motivated us to simply label PC3 as a depth dimension. It is well known that a limitation of PCA is that labeling the underlying dimensions it provides is not straightforward. Thus, these labels are tentative and meant mainly to refer to the empirically derived dimensions that we measured.
3. Experiment 2. Affective properties of words used figuratively
Given the apparent success of the semantic differential method for producing affective dimensions in Experiment 1, a second set of experiments were designed to use the method to compare the emotional content of figurative and literal uses of the same words (including both metaphor and simile forms). Comparison of similes and metaphor seemed useful because Glucksberg and Keysar (Reference Glucksberg and Keysar1990) argued that simile and metaphor are interpreted quite differently. Specifically, Glucksberg and Haught (Reference Glucksberg and Haught2006) claimed that, in simile forms, the referent is regarded literally, even though it requires a figurative interpretation. That is if someone says that “a beach can be like a grill,” the figurative vehicle, grill, can still be understood as referring to a literal grill, with its property of scorching heat being the source of alignment, whereas if they say “a beach can be a grill,” this seems to require an analysis that treats grill as a superordinate category of very hot things that might scorch flesh. Although both cases involve understanding that the emphasis is on the idea that the sand can become quite hot in the sun, Glucksberg and Haught argued that in the case of simile, this does not involve transforming the vehicle into a superordinate category.
Not all researchers agree with this interpretation. For example, Kennedy and Chiappe (Reference Kennedy and Chiappe1999) pushed back against the view that metaphors are “stronger” than similes. Moreover, eye-tracking studies suggest that the figurative meanings of similes may simply be processed later (more often on second pass) than metaphors (Durgin & Gelpi, Reference Durgin and Gelpi2017). Because Citron et al. (Reference Citron, Cacciari, Funcke, Hsu and Jacobs2019) additionally showed that neural signatures of emotional engagement extend to idioms, it seemed useful to explore whether or not similes differ from metaphors with respect to emotional variables, as this would tend to support the common notion that words in similes are indeed being used figuratively. The understanding that similes are figurative was suggested by Aristotle (Reference Kennedy1991) who discussed simile as an instance of metaphor in Book III of his writings on Rhetoric, saying “A simile is also a metaphor.” (p. 299). If Aristotle was correct, then we might expect to see very little difference between the affective content of metaphors and similes.
Matching nominal similes to metaphors is relatively easily done, (similes and metaphors can normally be matched in English by the addition of the word “like”). For this reason, they offer a context where direct experimental comparison appears ideal. Thus, the present experiments use the semantic differential method to test whether the implicit emotional content of similes differs from that of metaphors while comparing both of these to the same words used literally.
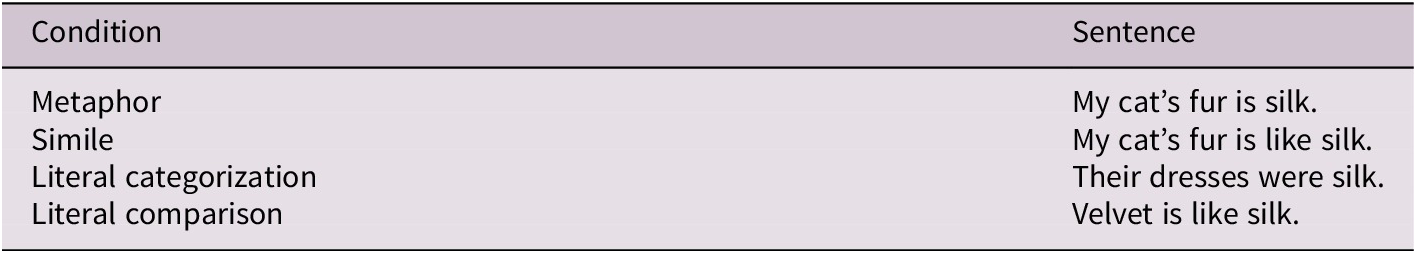
In this case, the literal sentences used for comparison, (either literal categorizations or literal comparisons) were not perfectly matched to the figurative ones in meaning but did include the same critical words in an alternative context. Example stimuli are shown in Table 5. Comparisons were considered literal when the two terms belong to the same conceptual domain (e.g., silk and velvet are both fabrics; bronze and steel are both metal alloys).
Example sentences from Experiment 2 showing one item (silk) in all four conditions

Whereas in Experiment 1 the experimental ratings were made with regard to short vignettes, in Experiment 2, single declarative sentences were used as stimuli. Citron and Goldberg (Reference Citron and Goldberg2014) showed that even short metaphoric stimuli show evidence of emotional activation. However, because the stimuli consisted of single sentences, yet it was the interpretation of a single word (the figurative vehicle) that seemed most important, two versions of the experiment were conducted. In the main version, the ratings were made with respect to the critical word, that is, of the figurative vehicle itself (whether presented in simile or metaphor form), and literal comparisons and literal categorizations using the same word literally, were included. Presumably this style of test might be sensitive to the differences between simile and metaphor that Glucksberg and Haught (Reference Glucksberg and Haught2006) have argued for.
However, in case the impressions of the entire sentence might differ between similes and metaphors, a second version of the experiment was also conducted where the ratings were made with respect to the entire sentence. In this version, no literal sentences were included, since no effort had been made to match the literal sentences in meaning to the figurative ones. Both the word-rating method and the sentence method were implemented with the same figurative stimuli, but across different participants. For both versions of the experiments the important theoretical question was: Would the semantic differential method show less emotional content for figurative vehicles in similes than in metaphors?
3.1. Method
The methods, including sample size, exclusion criteria, designs, and analysis strategy of the two version of the experiment were all preregistered on aspredicted.com.
3.1.1. Materials
The stimuli, 72 distinct words used in four different forms, were adapted from Durgin and Gelpi (Reference Durgin and Gelpi2017), which included similes, metaphor, and literal comparison versions. Literal categorization statements were added for each of the 72 items (see Table 5 for examples). Thus, there were 72 stimulus words used in each of four conditions of the word-rating task, whereas only the figurative versions were tested in the sentence-rating task. The full stimuli list is included in online Supplementary Materials on OSF.
3.1.2. Design
For the word-rating experiment, each participant rated 9 of each of the four types of stimuli (metaphor, simile, literal comparison and literal categorization), including 36 distinct items (words), in random order. Eight separate surveys were used to test all 72 words in all four conditions.
For the sentence rating experiment, each participant again rated 36 items, but only similes and metaphors were tested, because only these were matched at the sentence level. Thus, only four surveys of 36 items were required for sentence rating. These surveys also mixed together the two conditions evenly, and were randomly ordered for each individual participant.
3.1.3. Exclusion criteria
In addition to a simple attention check, and restrictions like those used in Experiment 1, the present study used a modified version of the data quality restriction imposed in Experiment 1. For each survey, the 10 participants whose rating vectors had the lowest correlations with the mean rating vector for each survey were eliminated from analysis, as insufficiently attentive.
3.1.4. Participants
The pre-registered goal was to administer each of the 12 surveys to 30 qualified participants to yield a total of 240 participants of high quality, with 20 retained for each survey. A total of 360 participants were recruited in January and February of 2023 to take the online questionnaire through Amazon’s Mechanical Turk through Cloud Research (formerly TurkPrime, Litman et al., Reference Litman, Robinson and Abberbock2017). There were 240 participants in the word-rating survey (30 each for eight unique word rating surveys) and 120 participants in the sentence rating survey (30 each for four different sentence rating surveys). After exclusions were applied, the demographics of the 240 included participants were as follows. The mean age was 43 years (range: 23–77), and 51% were men, 48% women, and fewer than 1% were non-binary or preferred not to answer. With respect to race and ethnicity, 78% identified as White, 13% as Black or African-American, 7% as Asian or Asian-American, 6% as Hispanic, Latino, or of Spanish origin, 1% as Native Hawaiian or other Pacific Islander, and less than 1% as Native American or Alaska Native.
3.1.5. Semantic differential surveys and the PCAs
Two changes were made to the semantic-differential survey. In place of “noisy-serene,” a scale of “emotional-serene” was used to try to get at emotional arousal more clearly, because we were not collecting explicit emotional valence ratings for these stimuli. Additionally, clear/murky replaced bitter/sweet, to better capture understandability, which is a basic dimension in many studies of metaphor (see Thibodeau et al., Reference Thibodeau, Sikos and Durgin2017). These changes had the consequence of making dynamism the first PC in both versions of the experiment (for which separate PCAs were conducted as for Experiment 1; see Table 6).
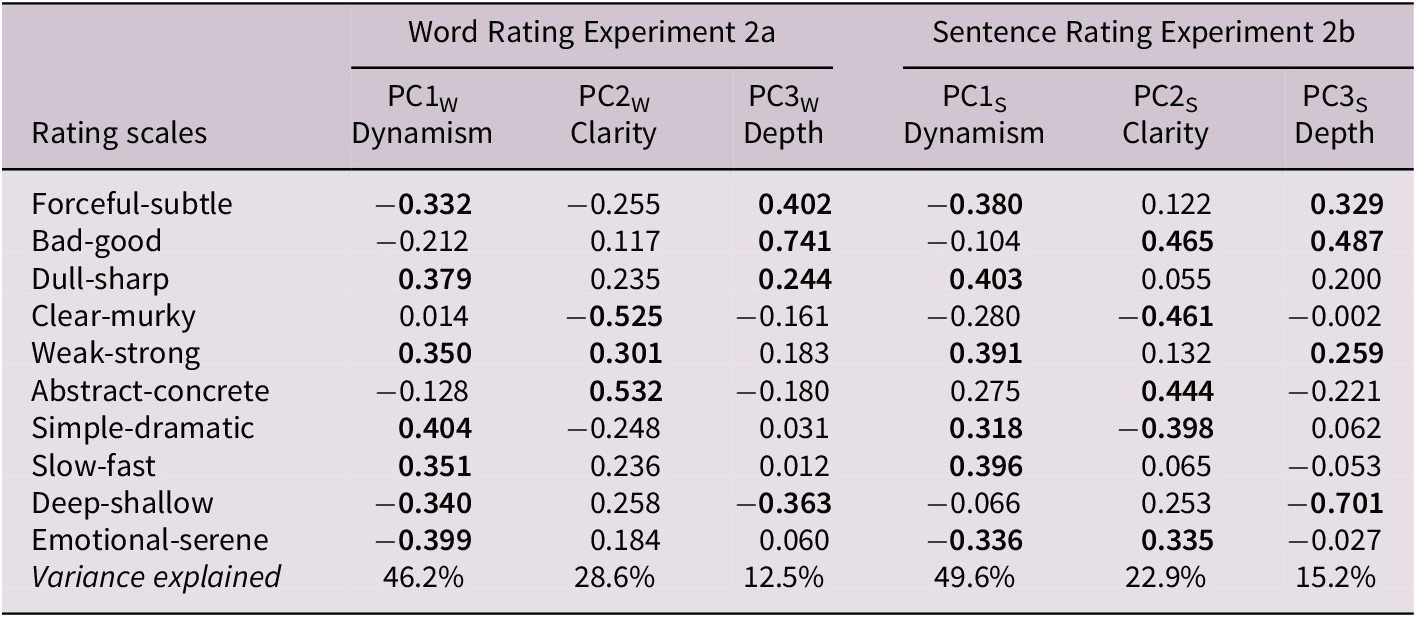
PCA loadings along 10 rating scales and the variance explained by each PC for word andsentence rating versions of Experiment 2. A negative loading means the left end of the scale is aligned with the PC. Bolded loadings have absolute values higher than the mean for that PC

For the word rating experiment, the first three PCs respectively accounted for 46%, 29% and 13% of the variance in the ratings. The scales that loaded most highly on PC1W were, in order: dramatic, emotional, sharp, fast, strong and deep. Similar to the dynamism dimension in Experiment 1, these scales seem to capture both activity and potency and converge on the notion of dynamism. Moreover, this can clearly be understood as an emotional dimension given that the emotional end of the emotional-serene scale loaded exclusively on this component. PC2W showed high loadings (and about equally) from two of the other scales: concrete (versus abstract) and clear (versus murky). This dimension tends to capture content related to clarity or understandability. Because abstract-concrete loads strongly on this dimension, it is likely that any differences between literal and figurative items on PC2W will be hard to interpret (over-predicted), whereas comparisons between similes and metaphors along this dimension may be particularly informative. If Haught and Glucksberg (2006) are correct that figurative vehicles in similes remain literal PC2W may show this difference. The loadings for PC3W were highest for good, followed by subtle and deep; PC3W seems to be an evaluation dimension related to depth and subtlety of meaning, that will continue to be labeled as depth, though, once more, this label is somewhat tentative and is selected in part because deep loads even more strongly on PC3S in the sentence rating data.
For the sentence rating experiment, the first three PCs respectively accounted for 50%, 23%, and 15% of the variance in the ratings as shown in the Table 6. The scales that loaded most highly on PC1S were, in order: sharp, fast, strong, forceful, and emotional. These dimensions seemed to again converge on the notion of dynamism (both potency and activity) and include emotional arousal. It is similar to the PC1W and is again labeled dynamism. The scales that loaded most highly on the PC2S were good and clear, closely followed by concrete and simple. PC2S appears to be an evaluation dimension, with a focus on clarity. Deep loaded quite strongly on PC3S, which will again be referred to as the depth dimension. Because this version of the experiment only included figurative items, the high loading of abstract-concrete on PC2S again means that the comparison of simile and metaphor along this dimension could be particularly telling.
Because of the re-ordering of dynamism as PC1 (PC1W and PC1S), as well as the evidence in Experiment 1 that all three PCs related to emotional content, all three PCs were analyzed for each version of Experiment 2, but with special focus on the first and third PCs in each case. Overall, the results will suggest that figurative speech is seen as more dynamic, and more emotionally deep than literal speech, and that simile and metaphor do not differ in this regard.
3.2 Results
3.2.1. Word Rating Experiment 2a
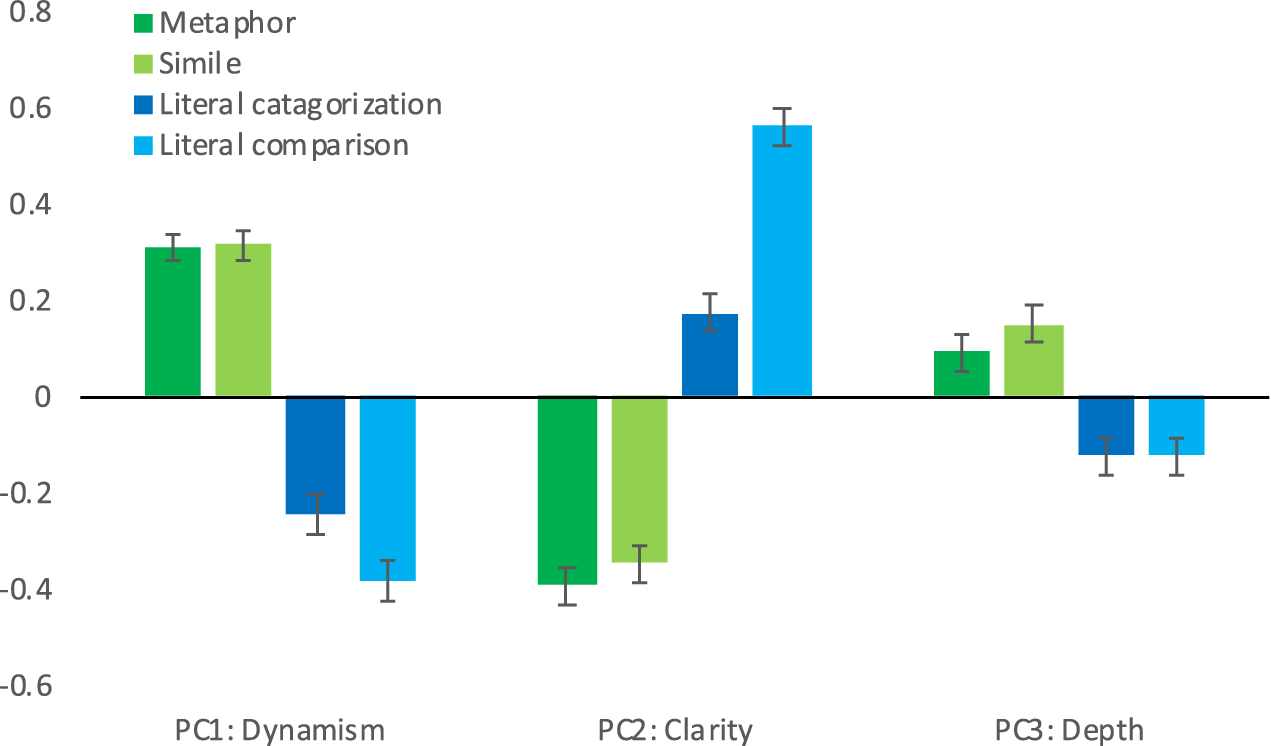
Figure 2 shows the mean ratings across for all four types of stimuli for each of the word-rating version of the Experiment. The metaphor and simile ratings are quite similar to each across all the three PCs, whereas all three show strong differences between words used figuratively and the same words used literally.
Word ratings in Experiment 2 showing mean normalized ratings along PC1 (Dynamism), PC2 (Clarity - an Evaluative dimention), and PC3 (Depth) for each of the four types of items. Error bars represent standard errors of the means.

For PC1W, the dynamism dimension, an initial linear mixed-effects maximal model was run that included both form (categorization versus comparison) and sense (literal versus figurative) and their interaction as predictors, with both items and subjects as random effects with slopes included in the error terms. In addition to the much greater dynamism of figurative senses than literal ones, β = 0.56, t(111.7) = 9.11, p < .001, there was evidence that the effect of form differed as a function of sense, β = 0.14, t(69.6) = 2.64, p = .010, so separate analyses of dynamism were conducted for figurative and literal senses. Words used in literal comparisons were significantly less dynamic than those used in literal categorization statements, β = −0.14, t(68.1) = 3.33, p = .001, which is consistent with intuitions that literal categorization statements are stronger than literal comparisons. In contrast, no such difference emerged between metaphors and similes, β = 0.004, t(66.7) = 0.15, p = .88.
For PC3W, the depth dimension, figurative senses of words were deeper than literal senses, β = 0.21, t(105.9) = 3.29, p = .001, whereas there was no significant effect of the form (categorical or comparative) on this dimension, β = −0.003, t(68.7) = 0.07, p = .94. To be safe, a direct comparison of metaphors and similes was tested, and a marginal difference was found, suggesting that similes were judged marginally deeper than metaphors, β = 0.06, t(154.5) = 1.75, p = .083. This direction of effect appears to be opposite to that predicted based on the idea that the figurative word in a simile is treated literally.
Although it is less obvious that clarity is an emotional dimension, it does correspond to an Evaluative dimension, and a similar analysis was conducted on PC2W, the clarity dimension. A reliable interaction indicated that the effect of form (comparison or categorization) differed as a function of sense (figurative or literal), β = −0.34, t(92.5) = 5.29, p < .0001. There was no reliable difference in clarity between metaphors and similes, β = 0.04, t(81.3) = 1.15, p = .27. In contrast, the literal comparisons used here were judged clearer than the literal categorizations, β = 0.39 t(94.8) = 7.28, p < .0001. Overall, words used figuratively seemed less clear (i.e., murkier and more abstract), than literal uses of the same word, β = −0.57, t(108.9) = 8.25, p < .0001. If murkiness (or uncertainty) is regarded as the more emotional end of the PC2W scale, this observation also fits with the greater emotionality of figurative language, including both metaphor and simile.
3.2.2. Sentence Rating Experiment 2b
The results of the sentence-rating version of the experiment involved only metaphors and similes, so three LMERs were conducted to compare simile and metaphor along each of the three PCS. There were no significant differences between metaphor and simile along any of the PCs: PC1S, dynamism, β = −0.017, t(55) = −0.46, p = 0.65, PC2S, clarity, β = 0.034, t(376) = 1.09, p = 0.28, or PC3S, depth, β = 0.015, t(69) = 0.44, p = 0.67. These results are consistent with the null hypothesis that there is no significant difference between metaphor and simile with respect to affective responses, at least with the present stimuli.
Null hypotheses are theoretically important where such results guide conclusions regarding the status of theories. A Bayesian approach can use data itself to determine probability of likelihood of null hypothesis. Bayesian analyses were performed on the data from sentence rating experiment using the Bayes Factor package with default prior (Rouder et al., Reference Rouder, Morey, Speckman and Province2012) in R to run Bayesian ANOVAs on the PCs computed by item. Across the 72 different items, the data for PC1S, PC2S, and PC3S were found to be, respectively, 5.0, 3.4, and 5.3 times as likely under the hypothesis of no difference between metaphor and simile forms than the alternative hypothesis that they differed. Based on this, it appears that, at the sentence level (as well as at the word level), metaphor and simile do not differ along the dimensions revealed by PCA in this study. Both show similar levels of dynamism, clarity, and depth.
3.2.3. Discussion
Experiment 2 sought to use the semantic differential method to test whether similes and metaphors differed in any of the implicitly measured dimensions. Whereas Glucksberg and Haught (Reference Glucksberg and Haught2006) had argued that the figurative vehicles used in similes remained literal, we found no difference between similes and metaphor along any of the dimensions that successfully dissociated figurative uses of words from literal uses of the same words. Thus, it appears that the emotional effects of figurative language are retained in similes.
4. General discussion
Inspired by the work of Citron et al. (Reference Citron, Güsten, Michaelis and Goldberg2016), who used fMRI to show stronger emotional activation for figurative stories than for literal stories, the current study sought to use implicit behavioral measures to identify the emotional dimensions that differ for metaphoric stories. Experiment 1 showed that the semantic differential method of collecting ratings on 10 distinct scales created three orthogonal dimensions of judgment that were all correlated (one negatively) with explicit judgments of emotional valence. All three dimensions, evaluation, dynamism and depth, were found to differentiate metaphorical language from literal language even though explicit ratings of emotional valence did not differentiate metaphorical language from literal language.
Dynamism, which is often associated with arousal, seems a likely candidate for the activation demonstrated by Citron et al. (Reference Citron, Güsten, Michaelis and Goldberg2016), but depth may also play an important role. These dimensions showed up again in the word-rating version of Experiment 2 (2a) and were again higher for figurative language than for literal language but did not differentiate metaphor from simile. In the sentence-rating version of Experiment 2 (2b), these dimensions were found even when there was no juxtaposition of figurative language and literal language. Both depth and dynamism appear to be affective dimensions that are higher for figurative language.
The differences in evaluation between the literal and metaphorical stories had not been anticipated in Experiment 1, because there were no differences in the norming data for emotional valence. However, the first dimension in Experiment 1 (PC1) seemed to be an evaluation dimension normally associated with valence, and this dimension was lower for metaphors than for literal stories. In Experiment 2, a similar dimension arose as the second PC in each version of the experiment; this was labeled as clarity, and it differentiated between words used literally and words used figuratively, with figurative words receiving a lower rating. It may be that figurative language may include a level of negative emotion linked to the uncertainty that is evoked by words being used with a less usual meaning, and that this is additionally evident in the contribution of clear versus murky to PC2W and PC2S in Experiments 2a and 2b. Access to this kind of emotional preference for literal language was not directly available from explicit norming questions about emotional valence, but was detected using the semantic differential method.
The present study provides evidence convergent with Citron et al. (Reference Citron, Güsten, Michaelis and Goldberg2016) that metaphoric speech is more emotionally evocative than literal speech, which may motivate people to use figurative language persuasively. The results of our studies speak to embodiment and abstraction theories of metaphor. Metaphors link abstract concepts to our sensory-motor perceptual faculties, including emotion (Jamrozik et al., Reference Jamrozik, McQuire, Cardillo and Chatterjee2016; Lakoff, Reference Lakoff2016). Metaphors allow us to draw on concrete, familiar domains to acquire and share abstract concepts. Metaphors allow emotional content that is embodied in a visceral, rather than conceptual, way to be applied to a target domain via figurative language. Emotion is (literally) motivating. By activating emotions, figurative language may, on the one hand, serve to more persuasively engage listeners, and may also help motivate speakers and listeners to see the significance of analogical connections (Bowdle & Gentner, Reference Bowdle and Gentner2005). This is consistent with Black’s (Reference Black1977) interactionist theory of metaphor, which emphasizes the creative potential of metaphors for thinking new thoughts.
4.1. The use of metaphoric scales in the semantic differential method
Osgood (Reference Osgood1952), Osgood et al. (Reference Osgood, Suci and Tannenbaum1957), (Reference Osgood, May and Miron1975) discovered a method that seems to implicitly capture affective dimensions. The method, interestingly enough, involves having people rate things on adjective scales that are often not literally applicable to the items being rated (in our case, stories, sentences and words in sentences). Participants do not seem to mind. They seem to adopt figurative interpretations of those scales, when needed, and generate ratings that are highly correlated across individuals. When their ratings across many scales are analyzed using factor analysis or PCA, the dimensionality of the data turns out to be fairly small – typically three dimensions.
Osgood et al. (Reference Osgood, Suci and Tannenbaum1957) started with dozens of scales and rigorously sought to identify the scales most likely to pick up on the three dimensions of interest. Later, Osgood et al. (Reference Osgood, May and Miron1975) conducted their cross-cultural studies by first having native speakers list adjectives for many nouns until they had generated a very large list of adjectives were then used as scales for native speakers. From these data, culture-specific scales were defined that all seemed to capture the same three-dimensional space first identified by Osgood et al. (Reference Osgood, Suci and Tannenbaum1957) in English. In the present study we used several scales that were developed by Osgood, and added some of our own. Billups et al. (Reference Billups, Thelamour, Thibodeau and Durgin2022) in their study of race and gender bias also used a mixture of classic and novel scales and found strong alignment with dimensions reported by Osgood et al. (Reference Osgood, Suci and Tannenbaum1957).
Although the semantic-differential method refers in part simply to the use of polar scales anchored by concepts at both ends, it is normally associated with an evaluation dimension and a potency dimension, as well an activity dimension. Sometimes there is a dynamism dimension combining potency and activity scales. However, the dimensions that emerge from a semantic differential task, do, of course depend on the scales chosen for testing. We sought to use a sufficient variety of scales to capture the classic three-dimensional space reported by Osgood et al., while also including scales that seemed likely to capture aesthetic contrasts relevant to understanding sentences. Although the resulting dimensions extracted by our PCAs departed in some ways from the classic space, the dynamism scale emerged in all three of the PCAs we conducted and always discriminated between literal and figurative items. Moreover, in Experiment 2, the added “emotional” scale loaded strongly on this dimension.
The second dimension that seemed most pertinent to interpret as emotional depended on the deep-shallow scale (one of Osgood et al.’s potency scales), which loaded on the dimension that we ended up calling “depth” in both experiments. This dimension showed up even when the abstract-concrete scale was excluded. It also emerged when only figurative items were used (Experiment 2b), and in both Experiment 2a and 2b it no longer included loading from the abstract/concrete scale. This depth dimension may require further investigation, but its emergence is consistent with the intuition that metaphor can deepen our understanding in a way that is emotionally engaging. Moreover, this is an emotional dimension that has previously been proposed (Bottenberg, Reference Bottenberg1975; Russell, Reference Russell1978).
In the end, the facts that Osgood’s method (1) makes use of metaphoric scales and (2) seems to tap into human affective judgments are both coherent with the neuro-imaging evidence from Citron and colleagues that metaphor activates emotional areas in the brain. The unveiling, by the semantic differential method, of emotional responses that differentiate literal and figurative stimuli seems to validate the use of this method. Indeed, it may even turn out that the very dependence of the semantic differential method on metaphoric scales is what makes it particularly effective at tapping into latent dimensions of emotional experience.
4.2. Limitations of the present study
The linguistic stimuli used for this study were not designed for the present investigation, but rather were pre-existing items developed originally for other studies in which emotion was not being considered. Although this is, in some sense, a methodological strength, it remains possible that the present results might not generalize to more naturalistic examples of figurative language. Future work could seek to randomly sample metaphoric and non-metaphoric text from natural contexts to ensure that the present results emerge even with naturally occurring figurative language. However, because idioms may be regarded as naturally occurring language it seems relevant that Citron et al. (Reference Citron, Cacciari, Funcke, Hsu and Jacobs2019) found that idiomatic expressions also produce stronger responses in areas of the brain associated with emotion.
A second limitation of the present work is that the data-defined dimensions revealed by PCA are not always straightforward to interpret. The semantic differential method is well-established as a method for retrieving affective content, with a set of commonly observed outcome dimensions (i.e., evaluation, potency, activity, and sometimes dynamism dimensions). However, the dimensions recovered by PCA in the present study were similar but not identical across the two experiments. Both dynamism and emotional depth, however, seemed to be well motivated choices for capturing the dimensions observed here. The strongest supporting evidence that the depth dimension is an emotional depth dimension rather than a purely conceptual depth dimension was the unanticipated correlation between the depth dimension and explicit ratings of emotional valence observed in Experiment 1. Nonetheless, the labeling of dimensions we have employed here are open to revision by future investigations.
5. Conclusion
Why do humans use metaphorical expressions instead of literal ones? The present study contributes to the observation of Citron et al. (Reference Citron, Güsten, Michaelis and Goldberg2016) that figurative language is more emotional than literal speech. This emotional content of figurative language may be revealed using behavioral methods that implicitly tap into emotional representations of speech by using abstract ratings scales. These rating scales seem to capture emotional content by appealing to semantic spaces defined largely by metaphor. These methods revealed that metaphoric language is not only experienced as more dynamic (arousing), but also as emotionally deeper than literal speech.
Data availability statement
Complete materials and de-identified data and analysis files are available at https://osf.io/cvf9p/?view_only=0258e7a4fca44607bf0faf501f3c0e57
Competing interests
The authors declare none.
Preregistration
The experiments conducted here were preregistered on aspredicted.org. The preregistrations documents may be accessed at: https://aspredicted.org/NNR_9HD and https://aspredicted.org/B2J_H9Q.

 Open access