

INTRODUCTION
Seroepidemiology can be used to assess the burden of infectious diseases and to optimize immunization strategies for vaccine-preventable diseases. This can be achieved by carrying out serological surveys aimed at identifying susceptible cohorts that can subsequently be targeted by public health interventions. Estimating seroprevalence (i.e. the percentage of population that shows markers of having the disease) as opposed to simply prevalence (based on clinical symptoms) has the advantage of more accurate definition of those infected that also includes those vaccinated and with asymptomatic infections [Reference Giesecke1, Reference Kafatos2].
Once serum samples have been collected they can be tested to determine susceptibility to the infection. The amount of antibody present in a sample can be measured in the laboratory using a serological assay that returns a quantitative measurement. Each sample is classified into positive (recent/past infections or vaccinated) or negative (susceptibles) according to a pre-defined cut-off. Positive measurements close to the cut-off are often further classified into equivocals (low positives); however, for simplicity this will not be considered here [Reference Kafatos2]. The proportion of positives over the total number of samples included in the serosurvey equals the seroprevalence estimate.
The method described above is used for routine diagnostic testing but it is also used to classify serosurvey samples into susceptibles and non-susceptibles. Therefore, the choice of assay cut-off is crucial since it has a direct impact on seroprevalence estimation [Reference Vyse3, Reference Vyse4]. There are different methods for estimating such cut-offs, and well-conducted seroepidemiological studies are expected to include details of how these were calculated [Reference Giesecke1]. However, regardless of the method used, the optimum value for a cut-off depends on the aims of the study as well as the seroprevalence and type of the infection. For example, an assay used to test prior history of chickenpox in pregnant women needs to be highly specific to ensure that all true negatives are classified as negatives whereas a test for screening population for HIV needs to be highly sensitive to make sure it flags all potential cases. However, the seroprevalence of the disease is also important since for a given sensitivity and specificity, the performance of the test varies for different proportions of positives [i.e. the change in positive predictive value (PPV) and negative predictive value (NPV)]. Finally, the type of the disease is also important, e.g. an HIV assay needs to be highly sensitive to make sure the true positives are tested as positive but also specific (to avoid falsely informing individuals that are positives), whereas the latter might not be so important for a bacterial infection [Reference Kafatos2].
An alternative method to fixed cut-offs for estimating population seroprevalence is mixture modelling. Mixture models can be used to estimate seroprevalence directly from the quantitative serosurvey data, rather than initially classifying individual samples into positive or negative according to a pre-defined cut-off. This can be achieved by fitting a mixture of distributions and obtaining the proportion of samples belonging to each underlying component [Reference Gay5]. Mixture models have been used in the past to estimate population seroprevalence of various infectious diseases [Reference Vyse3, Reference Gay5–Reference Vyse7]. One of the assumptions required for the mixture mode to work is to have reasonably high proportions of data in each underlying component [Reference Kafatos2]. This was not the case for the blood donor serosurvey presented here where samples were tested for human parvovirus 4 (HP4) as that infection is particularly associated with people who inject drugs (PWID). As an alternative, we propose using serological assay cut-offs to distinguish between HP4 positive and negative samples.
Estimating seroprevalence using assay cut-offs has limitations compared to mixture models; however, it is still widely used mainly because of convenience (once the assay cut-off has been set, it can be used in different serosurveys). The aim of this paper is to compare existing and proposed cut-off estimates and assess their impact on estimating seroprevalence.
METHODS
HP4 dataset
A time-resolved fluorescence immunoassay (TRFIA) developed to test exposure to HP4 was used as an example. In brief, a HP4 IgG TRFIA was developed using a panel of 184 sera from PWID that ensured a high number of positive samples. The aim was to estimate an assay cut-off that could be subsequently applied to a serosurvey of 608 blood donors' sera collected in 1999 and 2009. More information about how the individuals were selected and how samples were tested is given elsewhere [Reference Maple8].
Mixture modelling
A simple mixture model was considered for the PWID dataset. Assuming two underlying populations of positive (past/current infections) and negative samples (individuals with no past infection), a two-component mixture model can be fitted of the type:
 $$g\left( x \right) = \left( {1 - p} \right)f_ - \left( {x;\theta _ -} \right) + pf_ + \left( {x;\theta _ +} \right)\comma$$
where f
− and f
+ are the density functions for the negative and positive components, respectively, and θ
− and θ
+ are the parameters defining the shapes of the underlying distributions. For a simple model of this form, the proportion of the sample in the positive underlying component $\hat p$
can be used as an estimate of seroprevalence whereas the proportion of susceptibles is given by
$\hat p$
can be used as an estimate of seroprevalence whereas the proportion of susceptibles is given by $1 - \hat p$
[Reference McLachlan and Peel9].
$1 - \hat p$
[Reference McLachlan and Peel9].
Cut-off estimation
There are no definite rules for the choice of cut-off point, and it must depend on the reason for performing the test. Reports from good serological studies should always include an account of how the cut-off point was set [Reference Giesecke1]. A number of methods can be used for setting an assay cut-off depending on the information available when developing the assay. Assuming that the true status of the samples can be estimated by another method (e.g. by an established assay that can serve as gold standard or by questionnaires recording any past infections) then the quantitative assay results can be plotted against the true status using a receiver-operating characteristic (ROC) curve. The optimal combination of sensitivity and specificity can then be chosen [Reference Bland10, Reference Maple11].
Method 1
Often an estimate of the true status is not available. Then a commonly used cut-off is the mean of the log-transformed titres of a group of samples that are known to be negative plus 2, 3 or 4 standard deviations (s.d.) [Reference Kafatos2, Reference Maple11–Reference Ridge and Vizard14]. This is the most commonly used method by the assay manufacturers due to its simplicity [Reference Ridge and Vizard14]. It produces tests with high specificity, disregarding the effect this may have on sensitivity. In terms of seroprevalence, this may lead to some truly positive samples being classified as susceptible [Reference Kafatos2, Reference Vyse3, Reference Hardelid6]. In this paper, the mean of negative samples +2 s.d. (giving assay specificity of 97·5% assuming a normal distribution) will be examined as a commonly used method for estimating the assay cut-off.
Alternatively, once a mixture model has been fitted to the development panel results, a cut-off can be estimated based on the model's parameter estimates [Reference Maple11, Reference Tong, Buxser and Vidmar13]. Three methods for cut-off estimation are described here:
Method 2
Assume that from a mixture model, $\hat p$
is the seroprevalence estimate and
$\hat p$
is the seroprevalence estimate and ${\hat {\theta}} _ - $
and
${\hat {\theta}} _ - $
and ${\hat {\theta}} _ + $
are the parameter estimates for the negative and positive underlying component distributions, respectively. For a given cut-off C, the proportions of falsely classified positive samples (false negatives) can be defined as
${\hat {\theta}} _ + $
are the parameter estimates for the negative and positive underlying component distributions, respectively. For a given cut-off C, the proportions of falsely classified positive samples (false negatives) can be defined as $F_ + \left( {C;\; {\hat {\theta}} _ + } \right)$
and the false positive as
$F_ + \left( {C;\; {\hat {\theta}} _ + } \right)$
and the false positive as $1 - F\_ ( {C;\; {\hat \theta}\_}),$
where f
− and f
+ are cumulative distributions of the density functions f
− and f
+, respectively, as defined above. One way is to estimate a cut-off that minimizes the total misclassification, i.e. maximizes the following fraction:
$1 - F\_ ( {C;\; {\hat \theta}\_}),$
where f
− and f
+ are cumulative distributions of the density functions f
− and f
+, respectively, as defined above. One way is to estimate a cut-off that minimizes the total misclassification, i.e. maximizes the following fraction:
 $$\displaystyle{1 \over {\left( {1 - \hat p} \right)\left( {1 - F_ - \left( {C;\; {\hat \theta}_ -} \right)} \right) + \hat pF_ + \left( {C;\; {\hat{\theta}} _ +} \right)}}. $$
This is a method that has been proposed and used in the past [Reference Tong, Buxser and Vidmar13].
Method 3
An alternative cut-off proposed here is to set the number of false-negative samples to be equal to the number of false-positive samples. This occurs when
 $$\left( {1 - \hat p} \right)\left( {1 - F_ - \left( {C;\; {\hat{\theta}} _ -} \right)} \right) = \hat pF_ + \left( {C;\; {\hat{\theta}} _ +} \right)\comma$$
which can be obtained by solving:
 $$\vert{({1 - {\hat p}})( {1 - F\_( {C;\; {\hat{\theta}}\_})}) - {\hat p}F_{+} ( {C;\; {\hat{\theta}}_{+}} )}\vert = 0.$$
This method's cut-off should provide unbiased seroprevalence estimates for a population with the same characteristics.
Method 4
Another cut-off proposed here is to set the number of false-negative samples relative to the negative samples correctly classified to be equal to the number of false positives relative to the number of positive samples correctly classified. This is given by:
 $$\displaystyle{{\left( {1 - {\hat p}} \right)\left( {1 - F\_ - \left( {C;\; {\hat {\theta}}\_ -} \right)} \right)} \over {\left( {1 - {\hat p}} \right)F\_ - \left( {C;\; {\hat{\theta}}\_ -} \right)}} = \displaystyle{{{\hat p}F_{+} \left( {C;\; {\hat \theta}_{+}} \right)} \over {{\hat p}\left( {1 - F_{+} \left( {C;\; {\hat{\theta}}_{+}} \right)} \right)}}\comma$$
which can be obtained by solving:
 $$\left \vert {\displaystyle{{1 - F_ - \left( {C;\; {\hat \theta} _ -} \right)} \over {F_ - \left( {C;\; {\hat{\theta}} _ -} \right)}} - \displaystyle{{F_ + \left( {C;\; {\hat{\theta}} _ +} \right)} \over {1 - F_ + \left( {C;\; {\hat {\theta}} _ +} \right)}}} \right \vert = 0.$$
The cut-off estimate from method 4 has the advantage of not being affected by the proportion of samples belonging in each underlying component.
Comparison of the different methods using simulations
Simulations were generated aiming to compare seroprevalence estimates using the different methods. This was done in two steps. The objective of the first step was to estimate the cut-offs. For this, simulations were generated from a dataset based on the PWID data. The process was as follows:
-
(1) Location (mean μ – for the negative underlying component and μ + for the positive component), dispersion (standard deviation σ – for the negative component and σ + for the positive component), and seroprevalence (p) parameters were set to define a mixture model that data can be simulated from. Four scenarios were chosen with different location parameters for the positive underlying component while all the other parameters in the models remained fixed.
-
(2) One thousand simulated datasets (i = 1, …, 1000) were generated from each of the four mixture models using the following method. For each simulation, 184p samples were assumed to have been sampled from the positive (recent or past infection/vaccinated) population and the rest 184(1 − p) samples from the susceptible population. Samples assumed to belong to the positive population were simulated from N(μ +, σ +) whereas samples belonging to the susceptible population were simulated from N(μ −, σ −).
-
(3) Following each simulation a mixture model was fitted. Substituting the estimates $\hat \mu _{ - i} $
,
$\hat \sigma _{ - i} $
,
$\hat \mu _{ + i} $
,
$\hat \sigma _{ + i} $
and
$\hat p_i $
, cut-offs
$\; \hat C_{hi} $
(h denotes the four cut-off estimates) were estimated using the methods described above. The mean of the cut-off estimates
$\bar C_h $
was calculated over the 1000 simulated datasets. The 95% percentile intervals were given as a measure of uncertainty.
$\hat \mu _{ - i} $
,
$\hat \sigma _{ - i} $
,
$\hat \mu _{ + i} $
,
$\hat \sigma _{ + i} $
and
$\hat p_i $
, cut-offs
$\; \hat C_{hi} $
(h denotes the four cut-off estimates) were estimated using the methods described above. The mean of the cut-off estimates
$\bar C_h $
was calculated over the 1000 simulated datasets. The 95% percentile intervals were given as a measure of uncertainty.


The objective of the second step was to apply the estimated cut-offs to the serosurvey, thus obtaining seroprevalence. Specifically, each cut-off was applied to a simulated population of 608 samples (based on the blood donor serosurvey) with varying proportions of positive population. The simulation methodology for this population is described below.
-
(1) The same location and dispersion parameters that were used to generate the original datasets were selected for the four scenarios. For each model a number of seroprevalence parameters p were chosen ranging from 5% to 50%. One thousand simulations of 608 samples were generated for each of the models and scenarios in the same way as before.
-
(2) The estimated cut-offs
$\bar C_h $
were applied to the simulated datasets and hence, a seroprevalence estimate was derived for each simulation by grouping the samples into positive and susceptible. The mean of the seroprevalence estimates was calculated over 1000 simulations. The 95% percentile interval was given as a measure of uncertainty.

The analysis was carried out using Stata statistical software release 12.1 (StataCorp, USA). For the cut-off estimation, to find the root of the continuous monotonic functions, the optimize command was used in R version 2.10.1 (R Foundation for Statistical Computing, Vienna, Austria,).
RESULTS
Seroprevalence estimation for PWID and UK blood donors
Following a log transformation, the distribution of the assay development PWID sera and the fitted line of the mixture model are given in Figure 1a
. The model estimates for the negative component were ${\,\hat \mu} _ - = 4.6,\; \; \hat \sigma _ - = 0.3$
, and for the positive component were
${\,\hat \mu} _ - = 4.6,\; \; \hat \sigma _ - = 0.3$
, and for the positive component were ${{\hat \mu}} _ + = 6,\; \; \hat \sigma _ + = 0.2$
and the seroprevalence estimate for PWID was 20·6% (
${{\hat \mu}} _ + = 6,\; \; \hat \sigma _ + = 0.2$
and the seroprevalence estimate for PWID was 20·6% ( $\hat p = 0.206$
). Based on these model estimates, cut-offs were estimated using different methods. After applying these cut-offs to the UK blood donors' sera resulted in the following seroprevalence estimates: 6·9% [95% uncertainty interval (UI) 5·0–9·2] for method 1, 2·5% (95% UI 1·4–4·0) for method 2, 2·5% (95% UI 1·4–4·0) for method 3 and 2·8% (95% UI 1·6–4·4) for method 4.
$\hat p = 0.206$
). Based on these model estimates, cut-offs were estimated using different methods. After applying these cut-offs to the UK blood donors' sera resulted in the following seroprevalence estimates: 6·9% [95% uncertainty interval (UI) 5·0–9·2] for method 1, 2·5% (95% UI 1·4–4·0) for method 2, 2·5% (95% UI 1·4–4·0) for method 3 and 2·8% (95% UI 1·6–4·4) for method 4.
Distributions of HP4 Europium counts. (a) Sera collected from 184 people who inject drugs. (b) Sera collected from 608 UK blood donors.

Cut-off estimation for simulation scenarios
Based on the estimates derived from PWID sera, four simulation scenarios were defined in Table 1. The underlying components of the mixture distributions together with the results of one simulation are displayed in Figure 2.
Mixture model distributions by scenario based on the dataset of 184 people who inject drugs.

Definition of four mixture model scenarios based on people who inject drugs
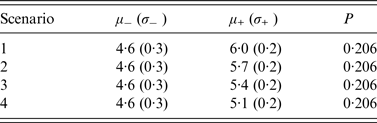
For each simulation, cut-offs were estimated using the methods described above. The cut-off estimates averaged over the number of simulations together with their corresponding 95% UIs are given in Table 2. The cut-off estimate using the mean of negative samples +2 s.d. (cut-off 5·2, 95% UI 5·1–5·3) did not vary between the different scenarios. This is because it is solely based on the shape of the underlying distribution of the susceptible individuals that remains fixed across the different scenarios. The cut-off estimates of the three other cut-off methods varied little with the method 3 cut-off being slightly lower than the others. As the location parameter of the positive component was reduced between scenario 1 and scenario 4 the cut-off estimates also became smaller.
Cut-off estimates and 95% uncertainty intervals following 1000 simulations

Seroprevalence estimation for simulation scenarios
The estimated cut-offs were used to calculate seroprevalence from simulated datasets based on the serosurvey of 608 blood donors. The distribution of the blood donors’ serological results following a log10 transformation are given in Figure 1b . The estimated seroprevalence together with the corresponding 95% UI for each cut-off method and scenarios are given in Table 3 generated from models with true seroprevalence of 5%, 15% and 25%. In addition to the estimates obtained by the cut-off methods, seroprevalence was estimated by directly fitting mixture models (proportion of samples belonging to the positive underlying component).
Seroprevalence estimates and 95% uncertainty intervals following 1000 simulations for each scenario

When the true seroprevalence was 15% or 25% (i.e. close to the 20·6% estimated from the development PWID serosurvey) all cut-off estimation methods gave estimates close to the true one for scenarios 1–3. For higher overlap between the underlying components (scenario 4) the estimates deviated from the true value with method 1 giving the most biased estimate. For true seroprevalence of 5%, all cut-off estimation methods gave estimates close to the true one for scenarios 1 and 2, whereas for scenario 3 method 4 gave the most biased estimate ( $\hat p$
= 11%, 95% UI 5–27). For scenario 4, all methods gave seroprevalence much higher than 5% except for method 1 (
$\hat p$
= 11%, 95% UI 5–27). For scenario 4, all methods gave seroprevalence much higher than 5% except for method 1 ( $\hat p$
= 4%, 95% UI 1–7). It should be noted that about 1% of mixture models failed to converge for scenario 4 and were excluded from further analysis.
$\hat p$
= 4%, 95% UI 1–7). It should be noted that about 1% of mixture models failed to converge for scenario 4 and were excluded from further analysis.
The mixture model distributions are presented in Figure 3 together with the distribution of one simulated dataset of blood donor results. The cut-off estimates by the four methods used are also displayed. Figure 4 shows the seroprevalence estimates by each scenario and method for a range of seroprevalences (5–50%). All methods seem to work well for scenarios 1 and 2 where there is little overlapping between the negative and positive components. For scenario 3 there are some deviations with the mixture model estimates being closer to the true one followed by methods 2, 3, and 4.
Distributions of simulated serosurveys of 608 samples and estimated cut-offs for different scenarios.

Comparison of seroprevalence estimates between different methods and scenarios.

DISCUSSION
Fixed cut-offs are often used in serological studies to estimate seroprevalence [Reference Kafatos2]. This is preferred by many scientists because it is easier to apply compared to say, a mixture modelling approach. Moreover, once the cut-offs have been estimated, they can be easily applied to samples tested at different times in different centres although caution is advised in such cases to avoid changes in assay testing techniques [Reference Andrews15, Reference Kafatos, Andrews and Nardone16]. An example where fixed cut-offs were used successfully is the European Seroepidemiology Network (ESEN and ESEN2) that included serological samples from eight antigens and 22 national laboratories [Reference Osborne, Weinberg and Miller17]. Fixed cut-offs can also be applied to surveys where it is difficult to fit a mixture model for a number of reasons such as low proportion of samples belonging to an underlying component. An additional benefit of using a fixed cut-off is that it enables data to be characterized at the individual level as positive/negative for a specific antibody. This allows the possibility of undertaking additional analyses that makes use of other demographic information that may also be available at the individual level. This is less straightforward to do using mixture models by applying the probability of each sample ‘belonging to one of the mixture model components' [Reference Hardelid18, Reference Vyse, Hesketh and Pebody19].
However, fixed cut-offs have limitations which can question their appropriateness for seroepidemiological studies. The main limitation is that cut-offs are often defined by the assay manufacturer for diagnostic purposes and therefore, are not appropriate for seroepidemiology [Reference Vyse7]. In this paper, the method for estimating the diagnostic assay cut-off was compared to alternative cut-offs specifically estimated for seroepidemiology. In the simulation scenarios used, the seroprevalence based on the manufacturers' approach gave, in general, estimates further from the true value compared to the other methods shown especially for high overlap between susceptible and positive underlying populations. The other three cut-off estimation methods presented gave very similar results. Given that method 4 is not being affected by the proportion of samples belonging to each underlying component, this method may be preferred over the other two methods.
One important assumption needs to hold for the estimated cut-off to be applicable for seroprevalence estimation. The development serosurvey where the cut-off is estimated must have the same characteristics as the serosurvey the cut-off is applied to. Given that there is no change in assay method or testing techniques this assumption should hold for the location and dispersion parameters. However, the proportion of samples attributed to each underlying component can vary like the example given here with higher seroprevalence of HP4 in PWID compared to blood donors. From the simulation examples when the seroprevalence in the development serosurvey is similar to the serosurvey the cut-off is applied to, the final estimates were closer to the true value.
Another limitation of fixed cut-offs is that they cannot adjust for important confounders [Reference Vyse3, Reference Vyse7]. This can be taken into account by estimating separate cut-offs for each level of the confounding variable (e.g. separate cut-offs by age group). Although age-specific cut-offs are meaningless from a diagnostic point of view they can be useful in seroepidemiology if they are used as a vehicle for estimating seroprevalence. An application of such age-specific cut-off has been shown previously [Reference Kafatos2].
Often antibody prevalence data using serum samples reflecting populations who are either susceptible or have experienced natural infection can be differentiated into clearly distinguishable distributions. These describe those previously infected who generally elicit strong antibody responses that are clearly distinct from those remaining susceptible where antibody is absent. This greatly facilitates employing a fixed cut-off with any potential resulting misclassification that may occur of relatively limited impact. Such circumstances therefore greatly favour employing a fixed cut-off. By contrast, however, this may not always be the case and distributions may sometimes significantly overlap where it can be much more difficult to visually distinguish those susceptible from those with evidence of antibody. For example, such situations may be encountered when considering highly vaccinated populations where significant proportions may demonstrate only lower antibody levels or when investigating infectious diseases where antibody levels wane significantly over time. This can result in larger proportions of samples with only low levels of antibody which tend to aggregate around proposed fixed cut-off points. Justifying any fixed cut-off point selected is therefore much more challenging and less intuitive in these instances, and may compromise the extent to which antibody prevalence can ultimately be meaningfully estimated. Such scenarios might therefore be argued to favour a mixture modelling approach to estimate seroprevalence, stratifying by age/time [Reference Vyse3].
Apart from serum samples oral fluid is another important type of sample with significant compliance advantages that has often been employed for large antibody prevalence studies. However, IgG is present at much lower levels in oral fluids with large proportions of data often aggregating in those regions where a fixed cut-off is most likely to be placed. This makes the choice of a fixed cut-off challenging and therefore, a mixture modelling approach may be more appropriate [Reference Gay20].
In conclusion, fixed cut-offs have certain advantages compared to mixture modelling and provide valid seroprevalence estimates when there is little overlap between the underlying positive and susceptible populations. The bias can be reduced by using fixed cut-offs estimated specifically for seroprevalence studies.
DECLARATION OF INTEREST
The lead author (G.K.) declares no conflict of interest at the time the research was carried out. He is currently employed by a biotechnology company (Amgen Ltd) and owns shares in a biotechnology company (Amgen Ltd). The remaining authors declare no conflict of interest.


