

Market categories matter. In 1998, when industry analyst firm Gartner launched the Enterprise Resource Planning (ERP) category, it did more than label a group of software products – it heralded a new class of computer solution that set the market’s direction for the next decade. However, two years later, it would suddenly declare ERP dead and introduce its new ERP II category. Yet, a few months later, and somewhat surprisingly, Gartner would then withdraw the ERP II category (Bond et al., Reference Bond, Genovese, Miklovic, Zrimsek and Rayner2000). Similarly, in 2008, following the launch of Facebook and LinkedIn, the same industry analyst firm introduced the Social Software category. When Facebook released its Facebook at Work product, it added further sub-categories to Social Software, including Externally Facing Social Software (EFSS). However, Gartner would soon withdraw the newly introduced EFSS category (Mann et al., Reference Mann, Drakos and Gotta2016). The above cases raise a puzzle. Why do powerful gatekeepers like Gartner introduce bold new categories, only to discard them more or less rapidly afterwards? What kind of market work is being done through these acts of naming, renaming, and erasing? And how do such fleeting categories still exert influence in shaping hype and structuring markets?
The introduction – and often rapid adjustment or abandonment – of market categories has become a defining feature of the digital economy. In a context marked by extraordinary technological change, industry analysts have created hundreds of market-defining categories over the past few decades to help clients navigate shifting landscapes. While some categories endure for years, many prove far more transient (Wang, Reference Wang2010), with some disappearing after only a few months (Pontikes & Kim, Reference Pontikes, Kim, Durand, Granqvist and Tyllstrom2017).
There is a clear gap in Information Systems (IS) research regarding why a market gatekeeper, such as an industry analyst, launches a category and subsequently adjusts or abandons it shortly after. When IS researchers and others discuss these ephemeral terminologies and classifications, they depict them as part of the rhetoric accompanying new technologies (Barrett et al., Reference Barrett, Heracleous and Walsham2013), as fads and fashions (Baskerville & Myers, Reference Baskerville and Myers2009; Hirschheim et al., Reference Hirschheim, Murungi and Peña2012; Cram & Newell, Reference Cram and Newell2016; Piazza & Abrahamson, Reference Piazza and Abrahamson2020; Heusinkveld et al., Reference Heusinkveld, van Grinsven, Groß, Greatbatch and Clark2021), or organising visions (Swanson & Ramiller, Reference Swanson and Ramiller1997; De Vaujany et al., Reference De Vaujany, Carton, Dominguez-Péry and Vaast2013; Davidson et al., Reference Davidson, Østerlund and Flaherty2015; Liao, Reference Liao2016; Wang, Reference Wang2021). Yet, these broad-brush approaches tend to leave the complex topology of digital economy product markets underspecified and tell us little about what prompts this gatekeeper to permit, and in some cases, foster an ever-changing category system. However, it is essential to understand these developments, as even short-lived categories herald significant technological and market changes (Wang, Reference Wang2010).
To shed light on this puzzle, we turn to Category Sudies, which has provided deeper insights into how market gatekeepers categorise technologies (Durand et al., Reference Durand, Granqvist, Tyllström, Durand, Granqvist and Tyllström2017). Scholars have begun to ask what spurs a market gatekeeper to create a category in the first place (e.g., Durand & Khaire, Reference Durand, Granqvist, Tyllström, Durand, Granqvist and Tyllström2017; Delmestri et al., Reference Delmestri, Wezel, Goodrick and Washington2020). However, there are still crucial gaps in this literature, particularly on the question of ‘how categories emerge and fall out of use’ (Kennedy & Fiss, Reference Kennedy and Fiss2013, p. 1139). Specifically, Category Studies has ‘overemphasised the stability of categories and the inertia of classificatory systems’ (Durand & Paolella, Reference Durand and Paolella2013, p. 1109). Moreover, the mechanisms and forms of organisation within gatekeepers that launch, modify, and truncate the career of the category have not been thoroughly investigated (Kennedy & Fiss, Reference Kennedy and Fiss2013). This prompts our research questions: How and why do gatekeepers continuously introduce, adjust, and abandon categories?
This chapter addresses these questions by drawing on empirical evidence from a long-term, in-depth qualitative study of the ‘Big Three’ industry analyst firms. Examining these firms provides insight into how they develop and promote categories that clients find helpful, and then modify or abandon those that detract from this goal. Furthermore, we link IS research with developments in practice-based category discussions (Granqvist & Ritvala, Reference Granqvist and Ritvala2016; Durand et al., Reference Durand, Granqvist, Tyllström, Durand, Granqvist and Tyllström2017; Granqvist & Siltaoja, Reference Granqvist and Siltaoja2020). This allows us to demonstrate how industry analysts attempt to make their expertise relevant to client decisions through a set of material and visual processes, which we theorise as category-work, figuring-work, and client-mapping. Together, these create ‘client-induced categories’, defined as temporary-probing mechanisms devised to help technology adopters navigate complex digital markets (Khaire & Wadhwani, Reference Khaire and Wadhwani2010).
7.1 Market Gatekeeper Priorities during Category Creation
Market categories have been depicted as ‘disciplining standards’ (Kennedy & Fiss, Reference Kennedy and Fiss2013, p. 1139) and defined as ‘devices that create order in markets’ (Beckert & Musselin, Reference Beckert2013, p. 7). Categories channel how consumers search for and evaluate products (Rosa et al., Reference Rosa, Porac, Runser-Spanjol and Saxon1999; Lounsbury & Rao, Reference Lounsbury and Rao2004). For instance, when an industry analyst issues a report on a new technological category, buyers will use it to find and compare vendors (Pontikes & Kim, Reference Pontikes and Barnett2017). Consequently, because they guide adopters in deciding what and where to buy, vendors must consider (and perhaps adapt to) categories to avoid illegitimacy discounts (Zuckerman, Reference Zuckerman1999).
For instance, when Gartner introduced its Enterprise Resource Planning (ERP) category, software vendors had little choice but to rebadge and redesign offerings under the ERP banner, as these solutions were sought by adopter organisations (Swanson, Reference Swanson2020). Alternatively, research has shown that if a vendor does not identify as part of a category, it could be ‘screened out’ of consideration (Zuckerman, Reference Zuckerman1999, p. 1399). For instance, Pollock and Williams (Reference Pollock and Williams2011) discuss the case of a software producer that failed to actively position itself in Gartner’s emerging customer relationship management (CRM) category and subsequently lost out in a procurement contest.
Technology vendors are especially keen to be included in categories produced by a market gatekeeper, such as an industry analyst, as these receive the most attention from technology buyers (Pontikes & Kim, Reference Pontikes and Barnett2017). Such gatekeepers emerge to help technology adopters choose and evaluate complex products. Conceived as neutral third parties (Aspers & Beckert, Reference Aspers, Beckert, Beckert and Aspers2011), gatekeepers are viewed as possessing the necessary expertise and having no stake or interest in market categories (Khaire, Reference Khaire, Durrand, Granqvist and Tyllström2017). When a gatekeeper launches a new category, it is thus assumed that they are providing consumers with a comprehensive and inclusive picture of market offerings (Rosa et al., Reference Rosa, Porac, Runser-Spanjol and Saxon1999, Reference Rosa, Judson and Porac2005; Lounsbury & Rao, Reference Lounsbury and Rao2004); that they faithfully represent the market. For instance, Lounsbury and Rao (Reference Lounsbury and Rao2004) hypothesise that a gatekeeper is spurred to launch a new category when ‘new entrants’ flood into an area, therefore expanding the ‘variety of product models’ and stretching the category boundary (p. 976). Such surges of new entrants typically reflect intense excitement around a technology, suggesting that gatekeepers launch categories to capitalise on that moment of heightened attention.
In contrast, more recent work describes gatekeepers as not passively reflecting markets (Lounsbury & Rao, Reference Lounsbury and Rao2004) but actively constituting them (Carruthers & Stinchcombe, Reference Carruthers and Stinchcombe1999; Beunza & Garud, Reference Beunza and Garud2007). Evidence has emerged that shows gatekeepers categorise vendor offerings around the decision-making concerns of clients, rather than providing complete pictures (Kodeih et al., Reference Kodeih, Bouchikhi and Gauthier2018). For instance, in her examination of film critics, Hsu (Reference Hsu2006) provides evidence that intelligible categories are ‘awarded attention and legitimacy by consuming audiences’ (p. 489). Similarly, Pontikes and Kim (Reference Pontikes and Barnett2017) describe how, because their clients ‘favour category clarity’, an industry analyst could ‘exclude a firm from a report’ that ‘complicates their narrative’ (p. 85).
Together, these studies support the notion that market gatekeepers shape category systems in response to client concerns. However, the processes through which gatekeepers use these concerns to construct categories remain poorly understood. For example, the creation of more selective or meaningful pictures (Hsu, Reference Hsu2006; Khaire, Reference Khaire, Durrand, Granqvist and Tyllström2017), where producer developments are excluded (Pontikes & Kim, Reference Pontikes and Barnett2017), contrasts with previous assumptions that gatekeepers built exhaustive knowledge of producer offerings (Carruthers & Stinchcombe, Reference Carruthers and Stinchcombe1999; Rosa et al., Reference Rosa, Porac, Runser-Spanjol and Saxon1999, Reference Rosa, Judson and Porac2005; Lounsbury & Rao, Reference Lounsbury and Rao2004). Indeed, a gatekeeper’s decision to omit significant technological developments could appear as an oversight, for which it could be challenged (Lounsbury & Rao, Reference Lounsbury and Rao2004; Navis & Glynn, Reference Navis and Glynn2010).
In this context, there are growing calls to study the pragmatic circumstances surrounding category construction (Durand et al., Reference Durand, Granqvist, Tyllström, Durand, Granqvist and Tyllström2017; Grodal & Kahl, Reference Grodal and Kahl2017), including the work practices and artefacts that produce categories (Blanchet, Reference Blanchet2017). Indeed, while Pontikes and Kim (Reference Pontikes and Barnett2017) note the specificity of industry analyst category formats – for instance, they are incorporated in ‘visual’ reports – they do not give this importance. However, it might be assumed that when the gatekeeper foregrounds client concerns, the figures utilised will have some bearing on the categorisation process (Delmestri & Greenwood, Reference Delmestri and Greenwood2016; Blanchet, Reference Blanchet2017). Thus, to move forward, we must focus on the material and, specifically, visual processes gatekeepers enact in the process of building categories to serve client requirements.
7.2 Material and Visual Processes for Foregrounding Client Concerns
For this purpose, we build on recent calls for research on what market gatekeepers do when they categorise entities in markets (Durand et al., Reference Durand, Granqvist, Tyllström, Durand, Granqvist and Tyllström2017) and aim to identify categories and categorisation processes (Kennedy & Fiss, Reference Kennedy and Fiss2013). While earlier research considered categories as ‘theoretical constructs’ (Rosa et al., Reference Rosa, Porac, Runser-Spanjol and Saxon1999, p. 64) or ‘conceptual tools’ (Negro et al., Reference Negro, Koçak and Hsu2010, p. 4), we build on later scholarship, which calls for practice-based investigations (Granqvist & Ritvala, Reference Granqvist and Ritvala2016) that forge an understanding of the various ‘acts of categorisation’ (Durand et al., Reference Durand, Granqvist, Tyllström, Durand, Granqvist and Tyllström2017, p. 13). Early literature suggested that simply ‘listing products’ (Lounsbury & Rao, Reference Lounsbury and Rao2004, p. 1974) was sufficient to spark a category system, but later contributions have described a more structured progression. For instance, Beckert and Musselin (Reference Beckert2013, p. 2) describe categorisation as involving processes of framing (i.e. the ‘construction of categories to which goods can be allocated’), allocation (i.e. how particular goods are ‘defined as belonging to this category’), and discrimination (i.e. ‘the establishment of quality differences within a product category’).
However, the sociomaterial mechanisms underpinning categorisation processes (see Wagner et al., Reference Wagner, Newell, Ramiller and Enders2018) are still under-researched. Such mechanisms include how categories are tied to material processes, directing our focus towards the visual character of schemata – a topic attracting increasing attention among category scholars (Delmestri & Greenwood, Reference Delmestri and Greenwood2016; Blanchet, Reference Blanchet2017). For example, Espeland and Stevens (Reference Espeland and Stevens1998) have demonstrated the importance of visualisations in related market processes, such as ‘commensuration’. Delmestri and Greenwood (Reference Delmestri and Greenwood2016) see ‘appearance’ as part of a more extensive process of ‘visual framing’, which is crucial in the social valuation of a category (p. 34). Further studies of visualisation complement Category Studies, which conceives category turnover as driven only by ‘linguistic’ (Vergne & Wry, Reference Vergne and Wry2014) or ‘discursive’ (Grodal & Kahl, Reference Grodal and Kahl2017) interventions. Delmestri and Greenwood (Reference Delmestri and Greenwood2016) argue that the ‘persuasive rhetoric of visuals’ may be more potent than the linguistic, as it provides for immediate kinds of visual apprehension (p. 34; see also Puyou & Quattrone, Reference Puyou and Quattrone2018). While these studies help us understand how figures persuade, they throw little light on our quest to uncover how gatekeepers go about making categories more valuable to clients.
Building on the above studies, we can refine our initial research question. First, if the market gatekeeper views its primary goal as increasing the value of categories for clients, what categorisation acts (Durand et al., Reference Durand, Granqvist, Tyllström, Durand, Granqvist and Tyllström2017) are involved? Second, to what extent are the resulting processes of material and visual display performing as constitutive elements in the construction of categories?
7.3 Helping Clients Understand the Complex Market of Offerings
Industry analyst informants from the ‘Big Three’ – Gartner, Forrester, and IDC – viewed their primary goal as creating categories to support and help their clients understand the complex market of offerings. In prioritising value categories given to clients, we found that industry analysts conducted three sets of processes. The first concerned how analysts constitute the market for offerings through category-work. These processes include framing, allocating, discriminating, and figuring.
7.3.1 Framing: Defining an Emerging Technology Field
Framing captures how analysts participate in helping define and develop a shared understanding of emerging innovation. The process starts when they seek to identify growing fields where their interventions, such as giving a name to a product market, help catalyse its formation. Framing interventions play a historical role here. As noted by an analyst discussing his firm’s role in shaping the now well-established ERP category, ‘[We] sometimes define the terminology that gets used to describe a particular innovation. Many people claim ERP, but Gartner was one of the original players behind the ERP term and trying to make that more widespread in use’ (A1, interview). In framing a competitive space, analysts engage in a specific type of category-work. As another analyst described, ‘It puts a stake in the sand’ (A2, interview). Thus, framing interventions help focus attention on a promising area and help mobilise the resources needed to develop and exploit that innovation. The same analyst continued, ‘[It] puts a box around what we consider a particular market, which we can then put revenue dollars around, market sizes around, growth rates around’ (A2, interview). Framing interventions also create a space where another kind of category-work can be undertaken: allocating.
7.3.2 Allocating: Putting Vendors into the New Category
At the next stage, specific vendors are allocated to the new category. One informant stated: ‘The role of analysis is to categorise things … analysts do try to pigeonhole into categories to understand where we cover, where we don’t cover, to some degree’ (A3, webinar). A new category encourages a swarming of offerings in the early stages, with multiple vendors attempting to enter with diverse offerings. An analyst described how, as soon as a new category is created, vendors will approach them: ‘So vendors are coming now to us to present their offering. They say, “You know what, that’s very good, what you produced in terms of the description. We think that we are fitting to your category, and we want to participate [in] the next update”’ (A4, interview). Other analysts described similar processes: ‘Once you publish a report about a new sector that’s emerging and that it’s high growth, my God, the phone doesn’t stop’ (A5, interview).
7.3.3 Discriminating: Creating Evaluation Criteria for Category Entrance
As time continues, an emerging category begins taking shape, and more and more solutions are developed. As further evidence becomes available about the effectiveness of these solutions, analysts establish tools to discriminate between different producer offerings in their category. One informant, reflecting on many years of experience as an analyst, discussed how: ‘In being able to compare apples against apples and understanding … whatever technologies are growing the fastest in which organisations, that’s critical to our base business’ (A2, interview). In discriminating between products, the idea is not merely to compare technologies but also to identify notable differences between vendors. To this end, analysts develop a set of evaluation criteria. As another analyst explained, she will: ‘Try and define a measurable set of criteria but also a reasonable number, so not too many. You might have five key criteria and various sub-criteria, maybe 25 or something in total’ (A6, interview). The analyst plays around with these different approaches to achieve the kind of discrimination they think is helpful. As one analyst put it, ‘It’s not also just a matter of defining criteria, it’s also understanding, obviously, what can be measured, but also what will give … a degree of diversity’ (A6, interview). The same analyst highlighted the problems that would arise if no such discrimination strategy was implemented: ‘It’s important that you get things that have a degree of diversity. It would be a fairly poor measurement if [all vendors] were “lumped in the middle” because your measurements were not specific enough’ (A6, interview). Through discriminating, analysts produce lists of vendors and ultimately figurations that enable technology buyers to select between the leading providers.
7.3.4 Figuring: Incorporating Categories in a Graphical Figuration
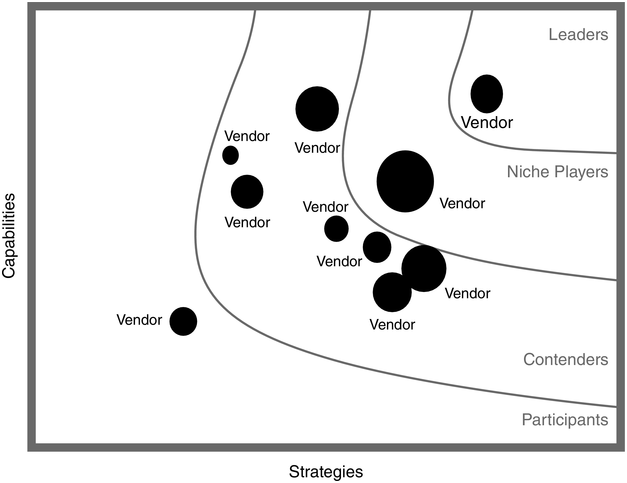
Figuring the category is a decisive process in these contexts. Attached to many industry analyst categories is a graphical figuration. For example, Gartner produces its Magic Quadrant, and Forrester and IDC author similar instruments, called the Forrester Wave and IDC MarketScape. These figurations further discriminate between vendors. For instance, the IDC MarketScape will rank vendors along two axes, labelled capabilities and strategies, and place vendors in one of four segments: leaders, niche vendors, contenders, and participants. Those vendors set further to the right are seen to have comprehensive strategies, while those placed towards the top have a high capability. Vendors thus seek to ensure that their products are ‘up and to the right’ (Stiennon, Reference Stiennon2012).
7.4 Client-Friendly Pictures Lead to Category Segmentation
The second set of processes we identified in our data captures creating figurations, theorised as figuring-work, which involves depicting, splitting, and drawing in.
7.4.1 Depicting: Creating Figurations in a Way that Helps Clients Make Decisions
Depicting, primarily by creating figurations that told a story, was vital in helping the client towards a decision. Below, we examine the circumstances in which these figurations are seen to be optimally designed to provide information that can assist clients in procurement decisions. Here, there is a lifecycle element in that the influence of figurations varies across different moments in the evolution of a category. In the early stages, when scores of vendors are attracted to a promising application field, there are too many vendors to draw a meaningful figuration. A figuration with two hundred vendors on it, an analyst told us, would be ‘unreadable’ (A7, interview). Another analyst said: ‘If you look at the Magic Quadrant as it stands today … it can get a little bit cluttered, and … people have to spend a bit of time scrutinising it to read it’ (A8, webinar).Footnote 1 Later, when a field is mature, with some products prevailing, and where applications are well characterised, procurement becomes less uncertain, and there may ultimately be little need for a figuration.
Over the years, however, analysts have recognised an ideal range or number of vendors that enhance the effectiveness of categories for clients. For example, according to analyst A7, the optimal number of dots on a Gartner Magic Quadrant was about 15 to 25. A similar heuristic existed surrounding the Forrester Wave, where they looked to have ‘10 to 12 vendors’ (A11, internal meeting). Likewise, according to A6 at IDC, MarketScape should contain around 10 to 15 vendors. An analyst described the rationale for why they sought to avoid ‘crowding’ on the figuration:
By providing more relative space between [dots], it’s much easier to read and view and take a snapshot of which vendor is where. You can see clearly the dot positions, and you can actually see the distances and the deltas between the dots a little bit more.
Analysts are guided not only by a number range; there is also a market picture drafted for directing categorisation work. Two types of market pictures enhance the category construction process. One analyst told us how, when constructing figurations, they wanted to capture the ‘good market’ (A6, interview) and another how they sought ‘beautiful pictures’ (A7, interview). The words ‘good’ and ‘beautiful’ were a framing mechanism that pointed towards producing aesthetic figurations that were not so crowded as to confuse the client and not so sparse that they lacked complexity (see Figure 7.1). Additionally, it was necessary for the figuration to have a reasonable number of vendors and for there to be a clear message for the decisions faced by would-be adopters.

Figure 7.1 Long description
A bubble chart plots vendors based on their capabilities (y-axis) and strategies (x-axis). The space is divided into four sections: Leaders at the top right, Niche Players in the upper middle, Contenders in the lower middle, and Participants at the bottom right. Several vendors are plotted as bubbles of varying sizes, with larger bubbles indicating a greater market presence. The vendors are distributed across all four sections, with a concentration in Contenders section. The largest bubble is in the niche player section. Participants and leaders sections have one moderately sized bubble each.
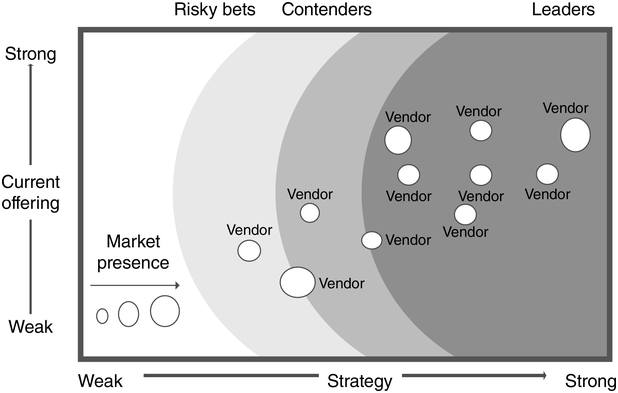
There were also diagrammatic devices to enhance how vendors appear on a figuration. For instance, analysts sought to arrange vendors within Waves to create a ‘rugby ball’ or ‘torpedo shape’ (A7, interview), which suggested a desire not just to fill the figuration randomly but also to discriminate between vendors in a way that gave it a structure with an implicit narrative of improvement: a torpedo meant vendors were not bunched within one part of the diagram (see Figure 7.2). Instead, there would be vendors with an even spread of capacities (e.g., challengers, contenders, strong performers, and leaders). In other words, the figurations were fashioned to allow analysts to create a set of ordered associations that helped guide clients, similar to how an artist leads a viewer’s eyes through a painting, which served to give the figuration significance so that the picture would indeed tell a story about the different capacities of vendors.

Figure 7.2 Long description
The plot visualizes vendor positions across two dimensions: Current offering, along the y-axis, ranging from Weak to Strong, and Strategy, on the x-axis, also ranging from Weak to Strong. The plot is divided into three regions: 'Risky bets', 'Contenders', and 'Leaders'. Several vendors are plotted as hollow circles labeled 'Vendor' within these regions, with varying sizes and positions. Market presence is represented by the size of the circles, with larger circles indicating greater market presence. Leaders have the highest concentration of vendors followed by contenders, and risky bets.
7.4.2 Splitting: Segmenting the Category
Splitting the category is where the analyst sought to manufacture the desired market picture. Our data show that these market pictures mattered. If the circumstances did not deliver them, analysts would actively attempt to create these pictures. For example, an analyst explains how he segmented a category when the Forrester Wave became ‘overly crowded’ (A4, interview). He started by explaining what overly crowded meant: ‘We have more than 15 vendors in a category [which is a problem] because our Wave process cannot get a good representation in terms of positioning of those 15 vendors. [This is] more than 15, meaning 20, 30, 40 vendors in our graphic … so we are limiting [the Wave] to 15 vendors’ (A4, interview). He then describes what limiting meant: ‘[When] we are getting too many vendors, which is the case for one of the categories that I am studying currently … we are getting too many vendors, so, I decided, in that case, to split the category in two’ (A4, interview).Footnote 2
To clarify, one might assume that if an analyst decides to split a category, notable differences have emerged between vendor products. However, this is not what is happening here. The analyst described how he sees this split emerging while showing that it is not easy to achieve in practice:
I try to split [through] getting some products which are more for SMEs, small and mid-size rather than others which are more for [the] large enterprise. So, more a tactical choice in the first place or more strategic choice in the second category. But I am struggling anyway, just to share with you some of the problems.
The analyst attempted to differentiate between products offered to smaller and larger vendors. Still, it is difficult to create two distinct categories because the vendors do not want to conform. He reported that after he created the split, he hoped vendors would offer products for both categories, but this did not happen and ‘[Some] of the vendors want to participate in only one [category]’ (A4, interview). Thus, the analyst wondered whether he should persist: ‘We are facing some problems of deciding how we should split or not split’ (A4, interview).
Crucially, if the category split does not resolve itself organically, analysts have other means at their disposal to help encourage it. For example, the analyst could modify the category entrance criteria to include only those vendors who follow his lead and differentiate their products: ‘I try to limit [category entrance] to vendors who are participating in both [categories]’ (A4, interview). The analyst continued: ‘[We decide] which are the most representative vendors in that category, and that’s our decision, so we have some sort of criteria to discriminate which one should participate, which one should not participate’ (A4, interview). Of course, this begs the question of why industry analysts split categories in this way. To answer, we show how the basis of these categorisations revolves around efforts to draw in clients.
7.4.3 Drawing In: Creating Categories That Enrol Clients
Analysts devise their categories to draw in those who buy and consume this research, specifically, their clients. Analysts were clear how, when categorising nascent fields, discriminating between vendors, and creating these market pictures, they were doing this for clients and not vendors: ‘We are an advocate for the end-user’ (A8, interview) (recall Chapter 4’s theme that analysts position themselves as advocates of technology adopters). Another described how this imperative to bring value to their clients permeated everything they did: ‘If we try and look at the vendors and say “oh yes, let’s come up with a term,” it doesn’t work that way. Can’t work because you have not got the customer in mind’ (A7, interview). Ensuring clients maintained their subscriptions was the immediate priority, requiring analysts to respond to queries and provide advice that offered practical help:
If you have got the customer in mind, you are thinking what the customer wants to do is this, this, this, and this, and [if] that’s the direction everything is consolidating in, then we can name something. So, when push comes to shove, and there [are] deadlines to be met and customers are screaming at us and wanting something … you are going [to] go and serve the client.
7.5 Building Categories around Client Concerns
The third and final set of processes we identified in our data captures how industry analysts directly build categories around client concerns, theorised as client-mapping, which involves probing, cycling, and killing off.
7.5.1 Probing: Launching and Adjusting Categories to Understand Client Buying Preferences
When categorising an emerging technology, the industry analyst must answer a fundamental question – how many categories to create? The difficulty is that they do not know how the technology will play out in the market: will it develop and sell as a broad ‘suite’ of solutions or fragment into many smaller, more specialised applications? They attempt to understand this through probing their client base. The industry analyst will launch an initial categorisation and probe for a reaction. Where this yields a negative response, it becomes the basis for further interventions such as adjusting or adding to a category. We investigate this further by examining Gartner’s categorisation of CRM.
Gartner started with a single broad category – the ‘CRM Suite’ – but as an analyst describes, this did not last long: ‘Back in 2002, we had a CRM Suite [category, but] we got rid of it because it was mindless as far as we were concerned’ (A7, interview). It was mindless because their probing revealed that clients were not interested in buying the broad CRM suite but only specialised applications:
The problem was that nobody bought [a CRM suite]. 90% of our questions [from clients] were: ‘I want to buy a Marketing Campaign solution; what is this CRM Suite thing?’ You go: ‘Well, most of it is irrelevant to you if you only want to buy a Marketing [campaign solution]’. [Clients go] ‘Why don’t you just tell me about the Campaign Management vendors?’ [You go] ‘Well, you need these other vendors who are not on that Magic Quadrant’. ‘Well then, what is the point in the Magic Quadrant?’ the clients ask.
Since it was recognised that the single categorisation was unhelpful, the analysts decided to segment CRM further to capture the areas where clients were spending money. The same analyst describes how the CRM category went from one to sixteen categories overnight: ‘[We] have 16 Magic Quadrants, [where] each one is describing a market’ (A7, interview). How did they choose which sixteen specific areas to cover? Again, probing the client base was key: these were ‘[t]he 16 [specialist applications] that we get most asked about [by clients]’ (A7, interview).
Adjusting and augmenting categories based on client probing was an effective means to locate client purchase dynamics. Yet, it could create another problem – proliferating categories. Industry analysts must balance the need to inform clients of new developments whilst avoiding over-burdening them with too many market pictures. Presenting selective and meaningful pictures in highly dynamic areas like CRM is challenging, however, as there are constantly new specialist applications coming on stream about which clients need to know.
7.5.2 Cycling: Moving between Front and Backroom Categories
Industry analysts sought to overcome the problem of overloading clients through an internal innovation: cycling between front and backroom categories. There were two aspects to this. The first was to identify a threshold number of categories that could be communicated publicly to clients. An analyst describes how hundreds of vendors continue to enter the CRM category: ‘[Most] people think [CRM] is all standardised on a few vendors, but we track 300 vendors, and we know that we don’t track them all’ (A7, interview). As another analyst describes, however, they could not just continue to segment the CRM category as ‘the problem for the buyer then is … [y]ou’ve got these segments which are sub-segmented and sub-sub-segmented … which [sub-category] do [they] look in?’ (A9, interview). Since a separate analyst could own each category, the result would be that ‘[buyers] might have to speak to 8 different Gartner analysts to find out what they should be doing’ (II, interview).
Therefore, when Gartner expanded the number of CRM categories, it calculated that this could be no more than ‘16’. These would become the categories published and communicated to clients and others. Yet, as analysts revealed, this 16 represents only a fraction of the market: ‘There [are a further] 48 sub-markets that we look at’ (A7, interview). These 48 categories have similarities to the 16, but there is a significant difference. They are not communicated to clients the same way. Whereas the 16 are given publicity, the 48 are deliberately hidden from public view and catalogued internally – thus, we might think of the former as ‘front room’ and the latter as ‘backroom’ categories.Footnote 3
The second aspect, to ensure clients are kept abreast of changes, was that frontroom and backroom categories are not fixed but could be upgraded or downgraded. An analyst describes what caused an upgrading: ‘At least once every 18 months or so we kind of have a pow-wow, and we sit down like we are now to say, “This doesn’t really quite work, does it, guys! Let’s tweak it around a bit”’ (A7, interview). The reason there is flexibility, he suggested:
In the 48, there [are] three main [categories] – Campaign Management, Customer Care, and Sales Force Automation – and that represents 70% of packaged software spend in just three categories. So, the other 30% is split across the other 45 categories. So, they are much more smaller markets with ‘nicher’ players.
He went on: ‘[It] is quite dynamic, so we watch those in … not as much detail as the big three, but we do, on some of them … pick them out and write the particular market where we know it has firmed up as a market; we know who the 20 players are’ (A7, interview). The notion of ‘firming up’ and the number ‘20’ are highly significant in these contexts. It means that the desired number of vendors has emerged for a Magic Quadrant to be drawn, and a meaningful story could be told to the client about the category. This is also a trigger to tell the analyst that a frontroom category has emerged.
It is also possible that the reverse will happen; that is, some of the frontroom categories will be downgraded:
For example, we’re in a conversation that is going on this week, actually, where we will tweak around our 48, where we will probably create a couple, kill a couple, merge a couple of these sub-markets…. We’ll say, ‘these vendors are actually sort of competing against each other all the time’, so we’ll put those two little sub-markets together, and this group over here, really that is not a very good way of viewing it, so we have to be quite flexible.
We have shown how industry analysts constantly cycled between what might be thought of as front and backroom categories when client-buying patterns were found to be moving in a different direction. In the next part, we delve further into how and why an industry analyst might downgrade or abandon a category.
7.5.3 Killing Off: Abandoning Categories that No Longer Offer Client Value
Our informants identified the factors that encouraged industry analysts to introduce and then – at times – kill off categories. These actors gear their research processes to determine areas where something is changing. One analyst told us: ‘We try to identify the future of [the] market rather than the past of the market’ (DD, interview). They must sustain the perception, as another analyst stated, ‘We are always ahead of you, we are always more on the button about what is going on in our area’ (A7, interview). As another analyst saw it,
from a commercial point of view, [industry analysts] are incentivised to keep [adjusting categories], and the problem is that you get to a point where you have named everything: What do you do? You have to rename it. And that is what you find more and more.
Analysts can be damaged if they miss a significant trend or arrive in an area that a rival has already framed. It is common, however, for analysts to propose a category too prematurely that does not take off. Washouts are an inevitable aspect of their category-work: ‘We sort of take for granted that we are going to be wrong’ (A10, interview). It might seem safer to wait until patterns are more evident, but this would run the risk of allowing others to take the initiative – such as a competitor analyst organisation or consultant. For instance, an analyst recounted the story of how an industry analyst firm attempted – prematurely in his view – to modify the ‘Software Oriented Architecture’ (SOA) category. This caused ‘a bit of a backlash’ (A10, interview) amongst the client base, forcing the abandonment of the new category:
[The analyst firm] attempt[ed] to define a new trend, not to uncover a new trend but to define a new trend – and I use my words quite carefully – which they called SOA 2.0. So, the idea was everyone out there in the industry, you’ve heard of SOA, you love SOA, but now we’ve got this thing called SOA 2.0, which is blah, blah, blah.
Surprisingly, analysts can sometimes kill off categories unintentionally – as a simple consequence of creating a category. For instance, an informant describes the process an analyst went through when introducing the ‘Work-Force Optimisation’ (WFO) category and how this led to other, more established categories becoming redundant:
A colleague of mine … came up with the term WFO – Work-Force Optimisations. What he was picturing, and was quite right, was that there [were] four markets consolidating… And all he was pointing out was, look at these different vendors, they were all aiming for the same thing…. So he coined that term, but in doing that, he killed three other terms that were submarkets.
Analysts can also be damaged if they retain for too long a category that becomes uninteresting for clients. Areas of technological opportunity will, for various reasons, become exhausted. How would the analysts know in practice when a category is in decline? A category could be killed off when the allocated vendors drop below a specific number:
Because if [the market picture] drops to five dots, there’s five vendors in this market, it’s highly consolidated, so why would [clients] ring us? So, for example, Operating Systems, what’s the point of having a Magic Quadrant for Operating Systems? Let’s take Operating Systems on Desktop PCs … there is about three or four. It is a religious war…. Likewise, another one is Desktop Productivity Applications. We used to have [a category] for that back in ’94, ’95. Once Microsoft killed everybody, we just dropped them.
Falling numbers of vendors in a category is a problem because ‘[w]here you have got down to just a handful like five vendors in a market’ there is no longer a ‘market that can be evaluated here’ (A7, interview). This would mean there would be little distinction between vendors, and the category would struggle to maintain a community of interest. Critically, if there is no longer a meaningful story to be told to clients, why would they ring the analysts? Client disinterest would be the final nail in the coffin, and the category would be killed off.
7.6 Discussion: Fostering a Changing Category System
In addressing how and why industry analysts foster an ever-changing category cycle, we find that they want to ensure their expertise is seen as relevant to client decisions. Bringing together insights from IS research and Category Studies and studying the Big Three industry analyst firms, we found that analysts created and maintained categories that clients find valuable and adjust or abandon those no longer attracting attention. Furthermore, by deploying a practice-based category focus (Granqvist & Ritvala, Reference Granqvist and Ritvala2016; Durand et al., Reference Durand, Granqvist, Tyllström, Durand, Granqvist and Tyllström2017; Blanchet, Reference Blanchet2017), we show that analysts maintain a category system that seeks to engage clients through category-work, figuring-work, and client-mapping.
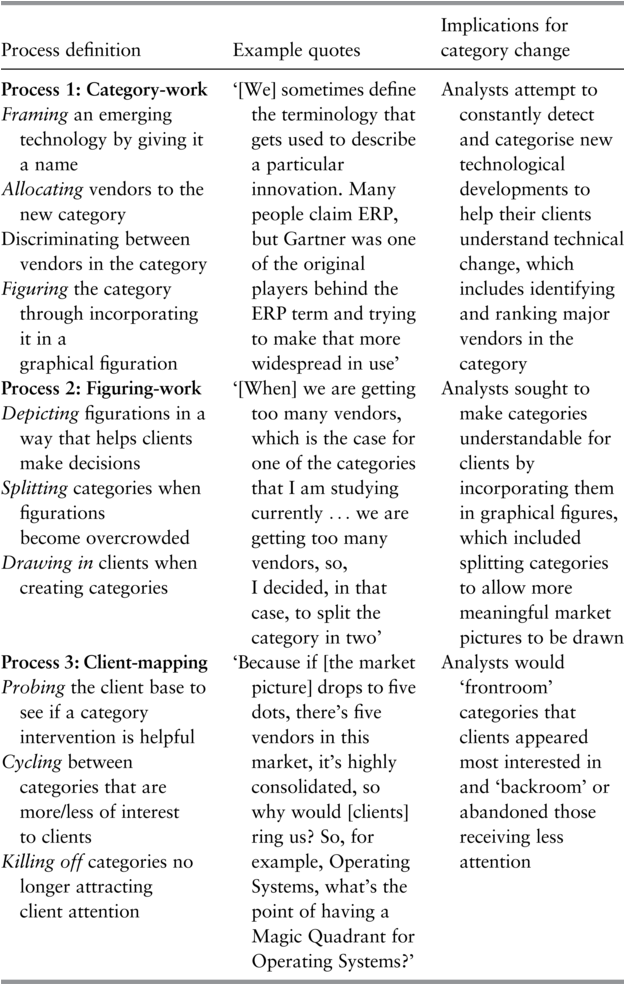
Category-work consists of framing, allocating, discriminating, and, by extending Beckert and Musselin’s (Reference Beckert2013) framework, figuring (i.e. creating a graphical figuration). Figuring-work reveals the constitutive elements of these figurations where the gatekeeper splits (i.e. segments) a category to allow the drawing of market pictures that tell the client a story. Client-mapping is where the gatekeeper probes for buyer preferences, cycling between frontroom and backroom categories and adjusting or abandoning categories no longer attracting client attention (see Table 7.1 for a summary of our findings). Together, these processes produce ‘client-induced categories’, defined as temporary-probing mechanisms devised to help technology adopters navigate complex markets in the digital economy. We will revisit this concept in Chapter 9, which reframes categories as part of moving from ‘hype in the wild’ to more managed hype systems.

Table 7.1 Long description
The table has three columns titled Process definition, Example quotes, and Implications for category change.
Row 1 column 1 reads. Process 1: Category-work.
Framing an emerging technology by giving it a name.
Allocating vendors to the new category.
Discriminating between vendors in the category.
Figuring the category through incorporating it in a graphical figuration.
Row 1 column 2 reads. We sometimes define the terminology that gets used to describe a particular innovation. Many people claim E R P, but Gartner was one of the original players behind the E R P term and trying to make that more widespread in use.
Row 1 column 3 reads. Analysts attempt to constantly detect and categorise new technological developments to help their clients understand technical change, which includes identifying and ranking major vendors in the category.
Row 2 column 1 reads. Process 2: Figuring-work.
Depicting figurations in a way that helps clients make decisions.
Splitting categories when figurations become overcrowded.
Drawing in clients when creating categories.
Row 2 column 2 reads. When we are getting too many vendors, which is the case for one of the categories that I am studying currently, we are getting too many vendors, so, I decided, in that case, to split the category in two.
Row 2 column 3 reads. Analysts sought to make categories understandable for clients by incorporating them in graphical figures, which included splitting categories to allow more meaningful market pictures to be drawn.
Row 3 column 1 reads. Process 3: Client-mapping.
Probing the client base to see if a category intervention is helpful.
Cycling between categories that are more/less of interest to clients.
Killing off categories no longer attracting client attention.
Row 3 column 2 reads. Because if, the market picture, drops to five dots, there’s five vendors in this market, it’s highly consolidated, so why would, clients, ring us? So, for example, Operating Systems, what’s the point of having a Magic Quadrant for Operating Systems?’
Row 3 column 3 reads. Analysts would ‘frontroom’ categories that clients appeared most interested in and ‘backroom’ or abandoned those receiving less attention.
In short, client-induced category creation exemplifies how hype interpretation has become part of the business of hype. The client-induced category should capture how the gatekeeper attempts to make things easier for its clients by providing them with selective and meaningful market pictures (Hsu, Reference Hsu2006; Pontikes & Kim, Reference Pontikes and Barnett2017). Although one might imagine that categories are created on their own terms – that is, separate from consumption – the notion of client-induced category captures how the gatekeeper introduces or adjusts categories to capture attention and client interest. If a category does not gain traction (and thus market value), it is quickly retired in favour of a new narrative. In other words, a category’s survival depends on its commercial relevance – analyst firms do not sustain a classification that fails to engage their paying audience. Instead, they pivot to new categories better aligned with client demand.
By continually tailoring and refreshing these classifications to match client interests, analysts ensure that hype is not only managed but also monetised – its interpretation packaged as a product in its own right. Thus, category creation is not merely an analytical exercise but a cornerstone of the business of hype, where interpreting and structuring hype for clients becomes a commodity. We therefore depict these categories as shaped by the dynamics of consumption. In practice, this means that as client interest (and hype) in an area swell, analysts carve the market into categories that reflect that excitement. This conception differs markedly from the accounts offered by Lounsbury and Rao (Reference Lounsbury and Rao2004) and Rosa et al. (Reference Rosa, Judson and Porac2005), for instance, who see gatekeepers as creating categories that are comprehensive and inclusive of innovation, simply reflecting the market.
Even though client-induced categories can be short-lived, this does not mean they are insignificant. Their fleeting nature does not make them insignificant – on the contrary, even brief client-induced categories help anchor moments of hype. As Kennedy and Fiss (Reference Kennedy and Fiss2013) argue, transient categories act as ‘disciplining standards’, directing attention towards which technologies are considered promising at a given moment. In doing so, they help shape the ‘social realities’ of innovation economies, even if only for a time (p. 1139).
We throw new light on how client-induced categories constitute markets in the digital economy. For instance, our study revealed that when there are many vendors in up-and-coming application areas, the gatekeeper will ‘split’ the category to allow meaningful market pictures to be drawn. In other words, we show that categories can be segmented not just because notable differences have emerged between vendor technologies but also to attract and capture clients (Cochoy, Reference Cochoy2007).
Finally, building on Khaire and Wadhwani (Reference Khaire and Wadhwani2010), the concept should capture how category emergence is ‘not always followed by stabilisation’ as client-induced categories endure only as long as they provide utility for primary audiences (p. 1283). After a short period, many of the categories no longer seem to achieve the same level of purchase with their intended audiences. When this happens, the gatekeeper will either backroom or abandon the category.
Below, we articulate how this theorisation of client-induced categories allows us to integrate and build bridges between IS and category scholarship and open up new research opportunities for studying markets in the digital economy.
7.7 How Organising Visions Relate to Category-Work
Few markets are as dynamic as that for digital solutions (Chiasson & Davidson, Reference Chiasson and Davidson2005). There is an almost continuous flow of new terminologies and classifications (Swanson & Ramiller, Reference Swanson and Ramiller1997). We contribute to this conversation by incorporating insights from Category Studies into our understanding of how the digital economy is constituted by ‘relatively transitory collective beliefs’ (Abrahamson & Fairchild, Reference Abrahamson and Fairchild1999, p. 709). IS scholars and others have usefully theorised transient terminologies as ‘organising visions’ (Swanson & Ramiller, Reference Swanson and Ramiller1997; De Vaujany et al., Reference De Vaujany, Carton, Dominguez-Péry and Vaast2013; Davidson et al., Reference Davidson, Østerlund and Flaherty2015; Liao, Reference Liao2016; Wang, Reference Wang2021), defined as a ‘focal community idea for the application of information technology in organisations’ (Swanson & Ramiller, Reference Swanson and Ramiller1997, p. 460). While some (e.g., Wang, Reference Wang2021) conceptualise the industry analyst categories described here as the same or similar to organising visions, we think it essential to differentiate these concepts as the former reveals processes not captured by the latter.
Industry analyst categories are not generic visions that attract and orient diverse players in forming new technological areas, like organising visions do. Instead, they are knowledge products that (re)make product-market boundaries as part of outputs designed to inform the actions and decisions of technology buyers. Our identification and theorisation of client-induced categories, therefore, articulate mechanisms not fully accounted for by existing concepts. We thus echo and give a new direction to the call by De Vaujany and colleagues (Reference De Vaujany, Carton, Dominguez-Péry and Vaast2013) to bring the abstract study of organising visions down to earth by showing how they relate to the concrete operation of markets and innovation alongside and in tandem with categorisation work, inviting further study of how the digital economy is constituted through the enactment of client-induced categories.
We consider the insights offered here necessary, not only because we identify the different dynamics underpinning client-induced categories but also because doing so deepens our understanding of how gatekeepers influence markets. Research in this space has usefully characterised organising visions as having ‘a career’, where many struggle to gain ascendancy before eventually being displaced (Ramiller & Swanson, Reference Ramiller and Swanson2003, p. 13). However, scholars have been less effective at explaining why specific organising visions take hold and others fade away (Liao, Reference Liao2016; Wang, Reference Wang, Grover and Markus2015). Our category lens suggests that scholars in this area have left underspecified the complex topology of digital product markets and have not given sufficient weight to the emergence of gatekeepers like industry analysts who exercise increasing influence over transient terminologies. The concept of the client-induced category moves this form of analysis forward and also responds to calls for more attention to be given to the role of ‘influential gatekeepers’ who ‘patrol’ category boundaries (Wang, Reference Wang2021, p. 414).
7.8 Creating Categories to Deliver Benefits to Clients
Our chapter further contributes by shedding light on a key but understudied question in the Category Studies literature: how and why categories emerge and fall out of use (Kennedy & Fiss, Reference Kennedy and Fiss2013, p. 1139). We identify and explain how this market gatekeeper creates, adjusts, and abandons categories and how this relates to their primary goal of delivering benefits to clients. Moreover, our chapter offers empirical depth and nuance to this conversation by revealing the different processes that shape industry analysts’ course of action. For instance, in theorising the notion of client-induced category, we build on the suggestion by Pontikes and Kim (Reference Pontikes and Barnett2017) that what matters to the gatekeeper is to provide clients with categories that they find valuable, and to this end, they will eliminate information and develop specific methods to manipulate categories.
While offering a point of departure for our study, we also provide a more nuanced theorisation of how and why gatekeepers might conduct these kinds of interventions, including revealing aspects that contrast with Pontikes and Kim’s (Reference Pontikes and Barnett2017) analysis. For instance, we find that the gatekeeper does not simply omit data during category creation, as they suggest, as this may appear as an oversight for which they could be challenged by clients and others (Lounsbury & Rao, Reference Lounsbury and Rao2004; Navis & Glynn, Reference Navis and Glynn2010). Instead, it operates a more dynamic system where new vendor developments and technologies are accounted for in further layers of the gatekeeper organisation and where specific categories are front and back roomed as client interests and buying patterns dictate.
7.9 How Figurations Impart New Dynamics to Categories
Our final contribution is to demonstrate how incorporating a category into a graphical figuration intensifies this cycle of category creation, adjustment, and abandonment. In our chapter, client-induced categories are linguistic, material, and, most importantly, visual (Delmestri & Greenwood, Reference Delmestri and Greenwood2016). We reveal how attempts by the gatekeeper to create market pictures that told a story for clients became a powerful mechanism shaping the creation and abandonment of a category. The Category Studies literature has not seriously examined how categories and graphic figurations interrelate and whether figurations might impart different dynamics to category systems. For instance, Category Studies suggests that shifts in ‘linguistic’ (Navis & Glynn, Reference Navis and Glynn2010) and ‘discursive’ (Grodal & Kahl, Reference Grodal and Kahl2017) frames intensify the cycle of category generation and exhaustion (see also Granqvist & Siltaoja, Reference Granqvist and Siltaoja2020). However, because in the contexts described in this chapter, the picturing of a category is seen to draw in an audience in ways that linguistic formats do not (Delmestri & Greenwood, Reference Delmestri and Greenwood2016), some categories might be considered ‘prelinguistic’ (Comi & Whyte, Reference Comi and Whyte2018). A further understanding of how a category develops through incorporation in a graphical figuration is essential because emergence through a market picture chronologically precedes linguistic developments, such as the introduction of new terminology (Comi & Whyte, Reference Comi and Whyte2018).
7.10 Research Opportunities for Studying Categories
The dynamics of markets in the digital economy take on a new hue when seen through a category lens, especially the notion of a client-induced category. Some assume it is simply innovation by technology vendors that intensifies the cycle of generation and exhaustion of categories (Kohli & Melville, Reference Kohli and Melville2019). However, our research reveals that this cycle is also a product of the gatekeeper category system and the business of hype. Our chapter invites future research to explore how the gatekeeper process of introducing, adjusting, and abandoning a category evolves. For instance, as recent research indicates (e.g., Pontikes & Kim, Reference Pontikes and Barnett2017), the lifespan of the categories described in this chapter is short – and getting shorter all the time. The interval between the industry analyst introducing and then adjusting or abandoning a category is diminishing from cycles measured in years to cycles measured in months, and future research might investigate why this is the case. For instance, one conjecture worth exploring is whether this faster category turnover results from the emergence of new industry analyst firms (Pollock & Williams, Reference Pollock and Williams2016), forcing the Big Three to compete more aggressively for the attention of audiences through launching evermore distinctive forms of categorisation (Bessy & Chauvin, Reference Bessy and Chauvin2013).
Further research is needed on the implications for technology vendors when categories are backroomed or abandoned. For instance, Pontikes and Kim (Reference Pontikes and Barnett2017) write that technology vendors have much to gain from becoming a ‘category king’, that is to say, dominating an industry analyst category. In such cases, the outcomes for a vendor are likely to be significant if an industry analyst decides to discontinue that category. Brandtner (Reference Brandtner2017), for instance, has written about the potential for powerful incumbents to suffer ‘status anxiety’ when there is no longer the same certainty about their category, as it will not be apparent ‘who is on top of the status order’ (p. 214).
Scholars could investigate whether client-induced categories have political ramifications (Bowker & Star, Reference Bowker and Star2000) or whether they disrupt traditional kinds of entrenchment (Durand & Khaire, Reference Durand and Khaire2017). For instance, it is widely thought that gatekeepers are ‘receptive to the interests of powerful incumbents’, such that they avoid ‘category reconstitution if a few incumbents dominated a category’ (Lounsbury & Rao, Reference Lounsbury and Rao2004, p. 991). Evidence presented here, however, indicates that the gatekeeper would no longer promote (and could even abandon) a category dominated by a few powerful incumbents, as it would be perceived as offering little value to its clients. Future research, therefore, might seek to understand whether client-induced categories act for or against influential vendors with entrenched product markets and if this invites hostility or resistance. It could also investigate whether these categories lead to a potential reordering of the composition and structure of markets, for instance, by killing off the competition between established vendors (Arora-Jonsson et al., Reference Arora-Jonsson, Brunsson and Hasse2020) or generating opportunities for other vendors to enter a category (Durand & Khaire, Reference Khaire, Durrand, Granqvist and Tyllström2017).
Finally, a further potential theme for development concerns how a focus on the socio-materiality of categories can be revealing. We found striking, for instance, that seemingly essential questions – when has a market emerged? – were prompted or settled through ‘small’ graphic props (e.g., analysts felt justified in launching a new category when there were fifteen to twenty-five dots in a figuration). This insight echoes research by McKendrick et al. (Reference McKendrick, Jaffee, Carroll and Khessina2003) on the number of vendors required before an area is recognised as a legitimate market. Similar issues arise as to when a category should be abandoned (e.g., fewer than five dots). This offers the ‘paper trail’ sought by Grodal and Kahl (Reference Grodal and Kahl2017) to study category decay, inviting further studies of how the competitive space is constituted through the material and visual enactment of categories.

 Open access