


Introduction
A variety of anthropometric indices have been used as a proxy for total fat or abdominal fat to assess risk for diseases, particularly CVD and diabetes. The most widely recognised is the BMI. Although this measure is correlated with total body fat, it does not distinguish fat from muscle or between different body fat distributions(Reference Soto Gonzalez, Bellido and Buno1). In the mid 20th century it was first observed that individuals with a central fat distribution were at greater health risk than those with peripheral fat(Reference Vague2, Reference Vague3). Vague observed that individuals with a ‘central type’ of fat distribution (android shape) were at greater health risk than those whose fat was deposited ‘peripherally’ (gynoid shape).
It has only been accepted in the last two decades that health risks (predominantly CVD and diabetes) can be determined as much by the relative distribution of the excess fat as by its total amount. The use of imaging techniques such as computed tomography (CT)(Reference Ashwell, Cole and Dixon4) and MRI(Reference Soto Gonzalez, Bellido and Buno1, Reference Seidell, Cigolini and Charzewska5) indicated that the ‘unhealthy apple shape’ is associated with a preferential deposition of fat in the internal, visceral fat depots rather than the external, subcutaneous fat depots, this fat distribution being characteristic of the more ‘healthy pear shape’(Reference Ashwell, Cole and Dixon4).
An attempt to assess relative fat distribution was made with the ratio of waist circumference (WC) to hip circumference. This was shown to be a good predictor of health risk and was popular for many years(Reference Bjorntorp6). However, although very useful for risk assessment, waist-to-hip ratio is not helpful in practical risk management because both waist and hip can decrease with weight reduction and so the ratio sometimes changes very little.
It was not until the end of the last century (1995) that WC by itself was proposed as an alternative proxy for central or abdominal obesity(Reference Han, van Leer and Seidell7). WC is strongly correlated with abdominal fat measures from advanced imaging techniques, and thought to represent fat stored in visceral depots. However, WC may over- and under-evaluate risk for tall and short individuals with similar WC.
At about the same time, several researchers independently proposed the waist-to-height ratio (WHtR) as another proxy for central obesity, correcting the WC for the height of the individual(Reference Hsieh and Yoshinaga8–Reference Lee, Aoki and Kawakubo12). Similar to WC, WHtR has been strongly correlated with abdominal fat measured using imaging techniques(Reference Soto Gonzalez, Bellido and Buno1, Reference Ashwell, Cole and Dixon13).
If an anthropometric index is to be used in a public health context and be used for screening, it is invariably useful to invoke cut-off or boundary values. The correction of WC for height offers the advantage that it is possible that a single WHtR boundary value may be useful in different ethnic, age and sex groups(Reference Ashwell and Hsieh14), while WC requires population-specific boundary values(15).
The present paper systematically reviews the evidence supporting the use of WHtR, a proxy for abdominal fatness, as a predictor of CVD and diabetes, and their risk factors. In order to put the relationships into context, the review draws on evidence from prospective and cross-sectional studies, in adults and in children, which report relationships between WHtR and either BMI or WC, or both. Receiver operator characteristic (ROC) analyses are also summarised to indicate sensitivity and specificity of the potential predictors and to investigate possible boundary values for WHtR.
Methods
Search methods
A systematic literature search of electronic databases was conducted using Medline (from 1950 to week 3 of November 2008) and EMBASE (from 1980 until week 50 of 2008). Search terms were:
BMI OR body mass index OR body mass OR waist circumference OR wst circumference OR wst OR wst circum OR WC
AND
Waist-to-height OR waist to height OR waist height OR waist to ht OR waist-to-ht OR waist ht OR wst height OR wst ht OR WHtR OR waist circumference to height OR (stature AND girth).
Searches yielded 174 203 articles on BMI, 13 646 on WC and 286 on WHtR. Combining categories (to select papers including WHtR and either BMI or WC) and removing duplicates yielded 156 articles. All additional searches were completed up to 19 April 2009. This resulted in some 2009 publications being included. An additional twenty papers were found by hand-searching bibliographies of identified publications and key obesity journals for new or advance online publications and an additional search for waist–stature papers. Where there was difficulty locating the full-text versions of articles and in extracting suitable information, authors were asked to supply. Two reviewers (L. M. B. and M. A.) assessed the suitability of these 176 articles, independently, using the following inclusion and exclusion criteria.
Study inclusion criteria
Inclusion criteria were: (1) human subjects, male, female or mixed, any age, adults or children, any ethnic group; (2) primary studies, either prospective or cross-sectional design; (3) WHtR and either BMI or WC measured at least once; (4) studies must also have a mortality, a cardiometabolic disease endpoint or cardiometabolic risk outcome measure, and present the relationship between obesity and the disease endpoint or risk outcome.
Study exclusion criteria
Exclusion criteria were: (1) literature reviews, intervention studies (although include and use baseline data if they fit inclusion criteria); (2) papers not written in English.
Search results
Figure 1 shows the selection of articles for inclusion in the present review. Of the 176 ‘database’ identified articles, screening papers by title and abstract identified sixty-three as unsuitable. Reviewing the remaining papers from the full text identified a further thirty-seven as unsuitable. This gave a total of ninety-eight papers to be excluded from the review, for the following reasons: eight papers were written in a foreign language, forty-eight did not contain a suitable metabolic outcome measure, seven did not present results for WHtR and either BMI or WC, three were review articles, three were meta-analyses of previously published data, three were intervention studies, two were published letters and twenty did not contain suitable statistical analysis. Finally, we were unable to obtain full-text copies of four publications(Reference Fasanmade and Okubadejo16–Reference Al-Mahroos and McKeigue19).
Flow of the systematic review procedure. WC, waist circumference; WHtR, waist-to-height ratio.
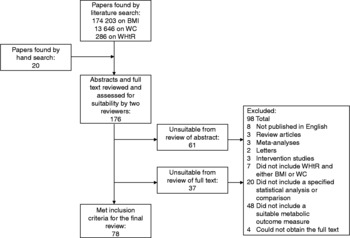
A total of seventy-eight papers met the inclusion criteria for the systematic review.
Results
The results have been divided by study design (prospective or cross-sectional) and subdivided by health outcome, diabetes and CVD including their respective traditional risk factors. Studies in children have been treated separately. Finally, separate to the analyses of all the data in the systematic review, we present the results of those studies found in the systematic review that included ROC analysis. Significance of study results is as reported in each article; in all cases this is P < 0·05.
Prospective studies in adults
There were twenty-two separate publications that analysed prospective datasets in adults.
Diabetes outcomes
Table 1 includes the details of nine prospective studies with diabetes as the outcome measure(Reference Bray, Jablonski and Fujimoto20–Reference Tulloch-Reid, Williams and Looker28). However, two publications described populations derived from the same study group, with the more recent paper describing a smaller subpopulation(Reference Bray, Jablonski and Fujimoto20, 27).
Details of prospective studies in adults with diabetes or CVD as the outcome measure

HR, hazards ratio; M, male; F, female; IGT, impaired glucose tolerance; IFG, impaired fasting glycaemia; RR, relative risk; MI, myocardial infarction.
Table 2 shows the predictive power of WHtR, WC and BMI for diabetes outcomes. Significant predictors were defined as significantly increased OR or hazards ratios (HR) of developing diabetes. WHtR and WC were significant predictors in prospective analyses within six of nine studies, which included men(Reference Hadaegh, Zabetian and Harati22), men and women(Reference Mansour and Al-Jazairi24, Reference Nyamdorj, Qiao and Soderberg25, 27, Reference Tulloch-Reid, Williams and Looker28) and in men and women of different ethnic backgrounds(Reference MacKay, Haffner and Wagenknecht23). BMI was a significant predictor in five of these same nine studies. Hadaegh et al. (Reference Hadaegh, Zabetian and Harati22) showed no significant increase in risk across four BMI groups in risk of developing diabetes, after adjustment for additional factors, whilst for WC and WHtR groups there was a significant increased risk.
Summary of the results of all prospective studies in adults, by outcome
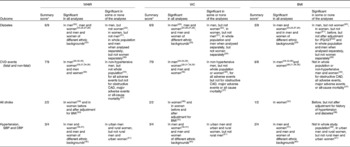
WHtR, waist-to-height ratio; WC, waist circumference; IFG, impaired fasting glycaemia; IGT, impaired glucose tolerance; CAD, coronary artery disease; SBP, systolic blood pressure; DBP, diastolic blood pressure.
* Summary score indicates the number of studies in which all the published analysis showed that the obesity measure was significant in predicting the outcome, out of the total number of studies for this outcome. Data analysed as odds or hazards ratio by cut-off or group of the specified obesity measure.
Other studies were significant in some, but not all of the analyses. Chei et al. (Reference Chei, Iso and Yamagishi21) and Sargeant et al. (Reference Sargeant, Bennett and Forrester26) showed that WHtR, WC and BMI were significant predictors in women, but not men. Bray et al. (Reference Bray, Jablonski and Fujimoto20) showed that WHtR, WC and BMI were significant in men, but not women. This contrasted with the result in the larger group from the same population(27), where WHtR, WC and BMI were significant predictors of diabetes in both men and women.
The values of OR and HR were similar for each of the three anthropometrical indices in most studies (values not presented in Table 2). However, in the Diabetes Prevention Program (DPP) population, the HR for WC in men was 1·42 (95 % CI 1·14, 1·77) for a 1 sd increase, while for WHtR in men the HR was 1·32 (95 % CI 1·08, 1·63) and for BMI was 1·30 (95 % CI 1·07, 1·57)(27). Bray et al. reported similar trends in their subpopulation analysis of the DPP(Reference Bray, Jablonski and Fujimoto20). In contrast, each of the categories used by Hadaegh et al. gave higher relative risk (RR) for WHtR than WC or BMI(Reference Hadaegh, Zabetian and Harati22).
CVD outcomes
Table 1 includes the details of prospective studies with any aspect of CVD as an outcome. In total, fourteen populations were studied, in fifteen separate analyses. One publication described two separate analyses in two distinct populations, the Women's Health Study and the Physicians' Health Study, which are tabulated separately(Reference Gelber, Gaziano and Orav29). Two publications described the same study population, with different outcomes and durations of follow-up, and are tabulated separately(Reference Zhang, Shu and Gao30, Reference Zhang, Shu and Gao31).
The studies have been subdivided by type of outcome, CVD events (fatal and non-fatal) and all-cause mortality(Reference Gelber, Gaziano and Orav29, Reference Zhang, Shu and Gao31–Reference Wessel, Arant and Olson37), stroke(Reference Zhang, Shu and Gao30, Reference Lu, Ye and Adami38) and hypertension and blood pressure(Reference Chei, Iso and Yamagishi21, Reference Fuchs, Gus and Moreira39–Reference Panagiotakos, Chrysohoou and Pitsavos41). One study was analysed for both diabetes and hypertension (included twice in Table 1)(Reference Chei, Iso and Yamagishi21), while one study(Reference Pischon, Boeing and Hoffmann35) was included after the addition of data published subsequently in response to a letter to the editor(Reference Gaglione, Can and Schneider42).
WHtR and WC were again significant predictors of outcomes in most (twelve of fifteen) of the studies, with BMI being a significant predictor in fewer (nine of fourteen) studies (Table 2). In cases where the anthropometric indices were not significant for the whole population, they were often significant in subpopulation analysis. In general, WC and WHtR tended to be significant more often than BMI. For example, Fuchs et al. found that WC and WHtR, but not BMI, were significant for hypertension in all study groups(Reference Fuchs, Gus and Moreira39), and Wessel et al. found that WC and WHtR, but not BMI, were significant for all cardiovascular events, fatal and non-fatal(Reference Wessel, Arant and Olson37).
The values of the statistical ratios (OR and HR) were similar for WHtR, WC and BMI in most studies (values not shown in Table 2). For example, Page et al. showed very similar OR after adjustment for multiple additional factors, 1·15 (95 % CI 1·10, 1·21) for WHtR, 1·17 (95 % CI 1·11, 1·25) for WC and 1·15 (95 % CI 1·07, 1·24) for BMI(Reference Page, Rexrode and Hu34). In two studies WHtR was a stronger predictor than WC. Aekplakorn et al. showed an OR per 1 sd increase in WHtR of 1·53 (95 % CI 1·21, 1·95) and for WC of 1·35 (95 % CI 1·06, 1·72)(Reference Aekplakorn, Pakpeankitwatana and Lee32). Pischon et al. showed for WHtR a RR for quintile 1 v. quintile 5 of 2·22 (95 % CI 1·94, 2·55) for men and 2·03 (95 % CI 1·76, 2·34) for women(Reference Gaglione, Can and Schneider42), but for WC, a RR of 2·05 (95 % CI 1·80, 2·33) for men and 1·78 (95 % CI 1·56, 2·04) for women(Reference Pischon, Boeing and Hoffmann35).
Waist-to-height ratio and waist circumference as independent predictors of disease after adjustment or stratification for BMI
Three studies determined whether WHtR and WC were significant predictors of outcome after adjustment for BMI. Two studies(Reference Zhang, Shu and Gao30, Reference Pischon, Boeing and Hoffmann35) showed that both WHtR and WC were significant predictors of stroke and all-cause mortality, respectively. However, in the Shanghai Women's Health Study, analysed for a different outcome(Reference Zhang, Shu and Gao31), neither WHtR nor WC was a significant predictor of fatal and non-fatal MI, after adjustment for BMI.
Cross-sectional studies in adults
Cross-sectional outcome measures considered in the present review are any of the risk factors related to CVD and diabetes: blood pressure, lipid outcomes and insulin indices. For adults these have been considered separately, but for children, they have been tabulated and discussed together.
A total of forty-four cross-sectional adult populations were identified, published in forty-three separate publications(Reference Hsieh and Yoshinaga9, Reference Hsieh and Yoshinaga10, Reference Ajay, Prabhakaran and Jeemon43–Reference Yasmin and Mascie-Taylor83). Of these forty-four papers, nineteen publications had calculated OR or similar(Reference Ajay, Prabhakaran and Jeemon43–Reference Wu, Chen and Zheng59, Reference Ghosh and Bandyopadhyay64, Reference Kaur, Radhakrishnan and Sankarasubbiyan69) (Table 3), twenty-five papers presented correlation analyses(Reference Hsieh and Yoshinaga9, Reference Esmaillzadeh, Mirmiran and Azizi48, Reference Sayeed, Mahtab and Latif55, Reference Tseng57–Reference Deshmukh, Gupta and Dongre63, Reference Ho, Lam and Janus66–Reference Hsieh and Muto68, Reference Kotchen, Grim and Kotchen71, Reference Lopatynski, Mardarowicz and Szczesniak73–Reference Yasmin and Mascie-Taylor83), four presented linear regression(Reference Hsieh and Yoshinaga9, Reference Hsieh and Yoshinaga10, Reference Sakurai, Miura and Takamura54, Reference Khan, Haq and Pervez70), one random effects(Reference Lee, Song and Sung72) and one paper compared means(Reference Gracey, Burke and Martin65) (Table 4).
Details of cross-sectional studies in adults: OR analysis

WHtR, waist-to-height ratio; WC, waist circumference; M, male; F, female; TC, total cholesterol; SBP, systolic blood pressure; DBP, diastolic blood pressure; FPG, fasting plasma glucose; SMART, Second Manifestations of ARTerial disease; PAD, peripheral artery disease; DYSLIP, dyslipidaemia; MetS, metabolic syndrome; ARIC, Atherosclerosis Risk in Communities Study; T2D, type 2 diabetes; IFG, impaired fasting glycaemia; IGT, impaired glucose tolerance; DETECT, Diabetes Cardiovascular Risk-Evaluation: Targets and Essential Data for Commitment of Treatment; HbA1c, glycated Hb.
Details of cross-sectional studies in adults: correlation analysis

SBP, systolic blood pressure; TC, total cholesterol; HOMA-IR, homeostasis model assessment of insulin resistance; M, male; F, female; KOPS, Kiel Obesity Prevention Study; FPG, fasting plasma glucose; DBP, diastolic blood pressure; FPI, fasting plasma insulin; 2hrG, 2 h blood glucose; MetS, metabolic syndrome; NHANES, National Health and Nutrition Examination Survey; HRT, hormone replacement therapy; HbA1c, glycated Hb; T2D, type 2 diabetes; MAP, mean arterial pressure; IFG, impaired fasting glycaemia.
The majority of studies explored the relationship between the anthropometric indices and a wide range of disease risk factors, namely blood pressure, lipids and insulin indices, as continuous variables. A few studies explored the relationship between disease endpoints and the anthropometric indices and/or explored the relationship between disease endpoints and groups separated by boundary values for anthropometric indices (diabetes(Reference Ajay, Prabhakaran and Jeemon43, Reference Esmaillzadeh, Mirmiran and Azizi49, Reference He, Zhai and Ma51, Reference Sayeed, Mahtab and Latif55, Reference Schneider, Glaesmer and Klotsche56, Reference Wang, Rowley and Wang58, Reference Kaur, Radhakrishnan and Sankarasubbiyan69), coronary artery disease(Reference Brouwer, Visseren and Stolk46, Reference Tseng57), hypertension(Reference Azizi, Esmaillzadeh and Mirmiran44, Reference Bertsias, Mammas and Linardakis45, Reference Cox, Whichelow and Ashwell47, Reference Esmaillzadeh, Mirmiran and Azizi48, Reference Harris, Stevens and Thomas50, Reference Sakurai, Miura and Takamura54, Reference Sayeed, Mahtab and Latif55, Reference Wang, Rowley and Wang58, Reference Wu, Chen and Zheng59, Reference Ghosh and Bandyopadhyay64, Reference Kaur, Radhakrishnan and Sankarasubbiyan69) and dyslipidaemia(Reference Azizi, Esmaillzadeh and Mirmiran44, Reference Bertsias, Mammas and Linardakis45, Reference Esmaillzadeh, Mirmiran and Azizi48, Reference Esmaillzadeh, Mirmiran and Azizi49, Reference Jeong, Seo and Kim53, Reference Schneider, Glaesmer and Klotsche56, Reference Wang, Rowley and Wang58, Reference Wu, Chen and Zheng59)).
Table 5 shows the results of the cross-sectional studies with OR or similar analysis (categorical outcomes), and Table 6 shows the results of the studies with correlation or linear regression analysis (continuous outcomes).
Summary of the results of all cross-sectional studies in adults, analysing data with OR, by outcome*

WHtR, waist-to-height ratio; WC, waist circumference; SBP, systolic blood pressure; DBP, diastolic blood pressure; DYSLIP, dyslipidaemia; TC, total cholesterol.
* Harris et al. (2000)(Reference Harris, Stevens and Thomas50) OR before adjustment for BMI. Hsieh et al. (2000)(Reference Hsieh, Yoshinaga and Muto52) not included since no relationship of WHtR, WC and BMI separately. Brouwer et al. (2007)(Reference Brouwer, Visseren and Stolk46) model 1 quoted. Tseng (2008)(Reference Tseng57) model 1 quoted. Metabolic risk score outcome not included in this table(Reference Esmaillzadeh, Mirmiran and Azizi48, Reference Schneider, Glaesmer and Klotsche56).
† Summary score indicates the number of studies in which all the published analysis showed that the obesity measure was significantly associated with the outcome, out of the total number of studies for this outcome. Data analysed by odds of having the specified outcome by either cut-off or group of the specified obesity measure.
Summary of the results of all cross-sectional studies in adults, analysing data with correlation or regression, by outcome

WHtR, waist-to-height ratio; WC, waist circumference; FPI, fasting plasma insulin; FPG, fasting plasma glucose; HOMA-IR, homeostasis model assessment of insulin resistance; 2hrG, 2 h blood glucose; HbA1c, glycated Hb; SBP, systolic blood pressure; DBP, diastolic blood pressure; TC, total cholesterol.
* Summary score indicates the number of studies in which all the published analysis showed that the obesity measure was significantly associated with the outcome, out of the total number of studies for this outcome. Data analysed by correlation or regression of the specified obesity measure with the specified outcome. Metabolic risk score outcome not included in this table(Reference Hsieh and Yoshinaga10, Reference Hsieh, Yoshinaga and Muto67).
Diabetes outcomes
OR analysis (Table 5) showed that WHtR was significantly associated with diabetes outcomes in six of seven studies, WC in six of six studies and BMI in six of seven studies. Two studies showed significantly increased odds of having diabetes for each 1 sd increase in WHtR, WC and BMI in German and Australian men and women, respectively(Reference Schneider, Glaesmer and Klotsche56, Reference Wang, Rowley and Wang58). The values of the OR were similar for WHtR, WC and BMI in these studies. One study showed significant increased odds of having diabetes across quartiles of WHtR, WC and BMI in Indian men and women(Reference Ajay, Prabhakaran and Jeemon43), but the odds were slightly stronger for WHtR than other anthropometric indices (quartile 4 v. quartile 1 was 6·69 (95 % CI 5·25, 8·53) for WHtR, 5·88 (95 % CI 4·66, 7·42) for WC and 4·01 (95 % CI 3·23, 4·99) for BMI). Only one study showed variance in results between the three anthropometric indices: Iranian women with high WC had significantly greater odds of having diabetes, but those with high WHtR and BMI did not(Reference Esmaillzadeh, Mirmiran and Azizi49).
Correlation studies of fasting insulin (Table 6) showed strong and significant correlations in seven of seven studies for WHtR, WC and BMI. Correlations were not so often significant for fasting glucose (significant in twelve of eighteen studies for WHtR and BMI and ten of sixteen studies for WC).
CVD outcomes
Two cross-sectional studies (Table 5) determined odds of CVD and showed that odds of disease were significantly higher for increases in WHtR, WC and BMI(Reference Brouwer, Visseren and Stolk46, Reference Tseng57), though BMI was not significant in men(Reference Tseng57).
Hypertension outcomes
Of the studies determining odds of hypertension (Table 5), nine of ten showed WHtR to be significant in all analyses, eight of nine studies showed WC to be significant and ten of ten showed BMI to be significant. The results of the studies were consistent and showed increased odds of hypertension in different age(Reference Cox, Whichelow and Ashwell47), sex(Reference Sakurai, Miura and Takamura54, Reference Wu, Chen and Zheng59) and ethnic groups(Reference Harris, Stevens and Thomas50, Reference Wang, Rowley and Wang58) for WHtR, WC and BMI. The many correlation studies (Table 6) gave results that were generally significant for all anthropometric indices, with similar coefficients for systolic blood pressure (SBP) and diastolic blood pressure (DBP)(Reference Cox, Whichelow and Ashwell47, Reference Sayeed, Mahtab and Latif55, Reference Ho, Lam and Janus66).
Lipid outcomes
Studies determining effects on various lipid outcomes were consistent in their results across the three anthropometric indices. Odds of dyslipidaemia (Table 5) were significantly increased for WHtR in three of four studies, for WC in four of four studies, and for BMI in three of four studies. Significant increased odds of dyslipidaemia were seen per 1 sd increase in WHtR, WC and BMI in men and women(Reference Schneider, Glaesmer and Klotsche56) and in different ethnic groups(Reference Wang, Rowley and Wang58). Similarly, increased odds were shown across quartiles of WHtR, WC and BMI for women and WHtR and WC for men(Reference Jeong, Seo and Kim53). However, Esmailzadeh et al. showed no significant increased odds of dyslipidaemia for a high WHtR, although the analysis was significant for WC and BMI(Reference Esmaillzadeh, Mirmiran and Azizi49).
Cross-sectional studies also determined odds of total cholesterol (TC) (two studies), TAG (three studies), LDL (two studies), HDL (three studies), and TC:HDL (two studies). Bertsias et al. showed similar results for WC and WHtR, with the odds being significant for LDL and TC:HDL in men and women and TC in men(Reference Bertsias, Mammas and Linardakis45). However, Azizi et al. showed no significant increased odds of any lipid outcome for WC, but increased odds of high TC, TAG and LDL with both WHtR and BMI(Reference Azizi, Esmaillzadeh and Mirmiran44).
Many correlation studies (Table 6) determined relationships with TC (sixteen studies), TAG (twenty-one studies), LDL (ten studies), HDL (nineteen studies), TC:HDL (three studies), LDL:HDL (three studies) and TAG:HDL (one study). Results tended to show stronger correlations for all anthropometric indices with TAG and HDL; a larger proportion of studies showed non-significant relationships with TC and LDL.
Waist-to-height ratio and waist circumference as independent risk factors for disease after adjustment or stratification for BMI
In order to determine whether WC and WHtR serve as independent risk factors, some cross-sectional studies have determined OR or relationships after adjustments for BMI. Harris et al. showed that odds of hypertension increased after adjustment for BMI through quintiles of WHtR and WC in White and African-American women, and in some groups of men(Reference Harris, Stevens and Thomas50). OR were similar for WHtR and WC. Two other studies determined odds of various risk factors in groups with low or high BMI and/or low or high WHtR and showed that the group with high BMI and high WHtR were at the highest risk(Reference He, Zhai and Ma51, Reference Hsieh, Yoshinaga and Muto52).
Prospective and cross-sectional studies in children
A total of thirteen cross-sectional studies were conducted in children(Reference Botton, Heude and Kettaneh84–Reference Mesa, Ortega and Ruiz96), with one study also including a prospective analysis(Reference Mirzaei, Taylor and Morrell87) (Table 7). Seven studies reported correlations, two linear regression and four reported OR above a particular boundary value. In general, studies showed good agreement in the magnitude and outcome of their analysis between WHtR, WC and BMI and outcomes of metabolic risk (Table 8).
Details of cross-sectional studies in children

SBP, systolic blood pressure; DBP, diastolic blood pressure; FPI, fasting plasma insulin; FPG, fasting plasma glucose; TC, total cholesterol; M, male; F, female; HOMA-IR, homeostasis model assessment of insulin resistance; MAP, mean arterial pressure; WHtR, waist-to-height ratio; WC, waist circumference; NHANES III, Third National Health and Nutrition Examination Survey.
Summary of the results of all cross-sectional studies in children (OR and correlation), by outcome

WHtR, waist-to-height ratio; WC, waist circumference; FPI, fasting plasma insulin; FPG, fasting plasma glucose; HOMA-IR, homeostasis model assessment of insulin resistance; SBP, systolic blood pressure; DBP, diastolic blood pressure; TC, total cholesterol.
* Summary score indicates the number of studies in which all the published analysis showed that the obesity measure was significantly associated with the outcome, out of the total number of studies for this outcome. Results not tabulated are those where the outcome was not a commonly reported one: lipid factor risk score(Reference Mesa, Ortega and Ruiz96), risk factor cluster(Reference Garnett, Baur and Cowell92), metabolic syndrome(Reference Maffeis, Banzato and Talamini93), total risk factors(Reference Freedman, Dietz and Srinivasan91), atherogenic index and CVD risk score(Reference Hara, Saitou and Iwata85).
For SBP, WHtR, WC and BMI were significantly associated in six of eight, five of six and five of seven studies, respectively. For DBP, WHtR, WC and BMI were significantly associated in three of six, three of four and three of five studies, respectively. Where relationships for SBP and DBP were determined in the same studies, relationships tended to be significant and stronger for SBP than DBP(Reference Hara, Saitou and Iwata85, Reference Mirzaei, Taylor and Morrell87, Reference Sung, Yu and Choi89).
For fasting plasma insulin, WHtR and BMI were significantly associated, in four of four studies, for all children, with WC significant in two of two studies. In one study, homeostasis model assessment of insulin resistance (HOMA-IR) was significantly correlated with WHtR, WC and BMI. The relationship between fasting plasma glucose and WHtR, WC and BMI was less convincing in the few studies where it was reported.
For TAG, WHtR was significantly associated in seven of seven studies, WC in three of four studies, and BMI in five of six studies. For HDL, WHtR was negatively associated in three of five studies, WC in three of three studies, and BMI in three of four studies. Of the lipid outcomes, similar to the results in adults, relationships with the anthropometric indices tended to be stronger for TAG and HDL. Hara et al. (Reference Hara, Saitou and Iwata85) and Kahn et al. (Reference Kahn, Imperatore and Cheng95) showed the only significant relationships for TC and WHtR, with three other studies showing non-significant relationships. For LDL, WHtR was significantly associated in six of seven studies, WC in two of four studies and BMI in two of six studies.
In addition to the results in Table 7, four studies determined the relationship between WHtR, WC and BMI and a ‘metabolic factor score’. This was significant for WHtR in four of four studies, WC in three of three studies and for BMI in two of three studies.
Summary of results for anthropometric indices as significant predictors of disease risk
The data presented in the present systematic review, from both cross-sectional and prospective datasets, show that WHtR, WC and BMI are useful predictors of CVD and diabetes risk. The balance of evidence suggests that WHtR and WC are stronger predictors than BMI. In studies where adjustment has been made, WHtR and WC were also predictors of outcomes independent of BMI.
Collating results for all prospective studies (Table 9) showed that WHtR and WC were a significant risk factor in 72 % of all outcomes, and BMI in 58 % of all outcomes. The collations of data from the cross-sectional studies in adults indicate that the WHtR is a significant predictor in 77 % of all outcomes, WC is a significant predictor in 72 % of all outcomes and BMI in 77 % of all outcomes. Similar collations of data from the cross-sectional studies in children indicate the WHtR is a significant predictor in 73 % of all outcomes, WC is a significant predictor in 66 % of all outcomes and BMI in 64 % of all outcomes. Combining all cross-sectional studies in adults and children (Table 9) indicates that the WHtR is a significant predictor in 76 % of all outcomes, WC is a significant predictor in 71 % of all outcomes and BMI in 74 % of all outcomes.
Broad summary of the results of all prospective studies in adults and cross-sectional studies in adults and children by outcome (by number of significant/total number of studies, and percentage)
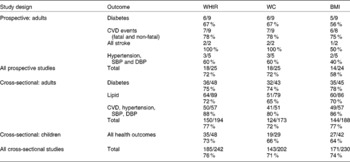
WHtR, waist-to-height ratio; WC, waist circumference; SBP, systolic blood pressure; DBP, diastolic blood pressure.
Limitations of prospective and cross-sectional analyses of anthropometric indices
From the evidence presented so far, WHtR and WC appear to be as good, if not better than BMI in predicting metabolic risk. However, while some prospective studies show higher OR or RR with one or other measure, it is difficult to determine whether there is an advantage for clinical practice from this type of analysis of data since most statistical analysis is derived from either continuous relationships or boundary values based on the data itself (per 1 sd, by tertiles, quartiles, quintiles), rather than practical boundary values for diagnostic or screening purposes, for example, BMI ≥ 30 kg/m2, WC ≥ 88 or 102 cm and WHtR ≥ 0·5. Further analysis is therefore required to determine whether either WC or WHtR has an advantage over the other for practical purposes.
Practical use of anthropometric indices for screening purposes
Information from receiver operating characteristic analysis
ROC data provide important information, assessing and comparing the diagnostic accuracy of different tests, for a particular outcome. In conducting the above systematic review, a number of studies undertaking ROC analyses and reporting area under ROC (AUROC) curve data were found. This information was used to further compare the usefulness of WHtR and WC as practical diagnostic tools.
At the stage of searching full papers, thirty-one papers with AUROC analysis were identified, twenty of which(Reference Soto Gonzalez, Bellido and Buno1, Reference MacKay, Haffner and Wagenknecht23, Reference Mansour and Al-Jazairi24, Reference Sargeant, Bennett and Forrester26, Reference Tulloch-Reid, Williams and Looker28, Reference Aekplakorn, Pakpeankitwatana and Lee32, Reference Page, Rexrode and Hu34, Reference Welborn and Dhaliwal36, Reference Esmaillzadeh, Mirmiran and Azizi48, Reference He, Zhai and Ma51, Reference Sakurai, Miura and Takamura54, Reference Schneider, Glaesmer and Klotsche56, Reference Bosy-Westphal, Geisler and Onur60, Reference Can, Bersot and Gonen61, Reference Deshmukh, Gupta and Dongre63, Reference Gracey, Burke and Martin65, Reference Ho, Lam and Janus66, Reference Lee, Song and Sung72, Reference Lopatynski, Mardarowicz and Szczesniak73, Reference Paniagua, Lohsoonthorn and Lertmaharit77) also met criteria for the review and eleven(Reference Aekplakorn, Kosulwat and Suriyawongpaisal97–Reference Shimajiri, Imagawa and Kokawa107) of which were excluded from the systematic review at that stage (as they did not report the required analysis type and usually instead focused on AUROC analysis). Of these thirty-one papers with AUROC analysis, four did not report AUROC values(Reference Esmaillzadeh, Mirmiran and Azizi48, Reference Deshmukh, Gupta and Dongre63, Reference Berber, Gomez-Santos and Fanghanel98, Reference Shimajiri, Imagawa and Kokawa107), but only reported the optimum cut-off values and one did not report values for WC(Reference Freedman, Kahn and Mei100), leaving twenty-six studies reporting full ROC information for different ethnic groups and age ranges. Details of the eighteen studies that met the criteria for the full review are included in the appropriate Tables 1, 3 or 7. Details of the other eight studies are included in Table 10.
Details of studies contributing data to the receiver operator characteristic (ROC) analysis (not previously tabulated)
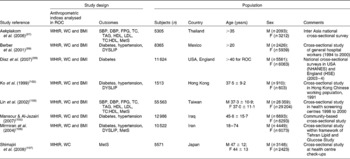
WHtR, waist-to-height ratio; WC, waist circumference; SBP, systolic blood pressure; DBP, diastolic blood pressure; FPG, fasting plasma glucose; TC, total cholesterol; M, male; F, female; MetS, metabolic syndrome; DYSLIP, dyslipidaemia; NHANES, National Health and Nutrition Examination Survey; HSE, Health Survey for England.
Comparison of receiver operating characteristic values: support for waist-to-height ratio as a screening tool
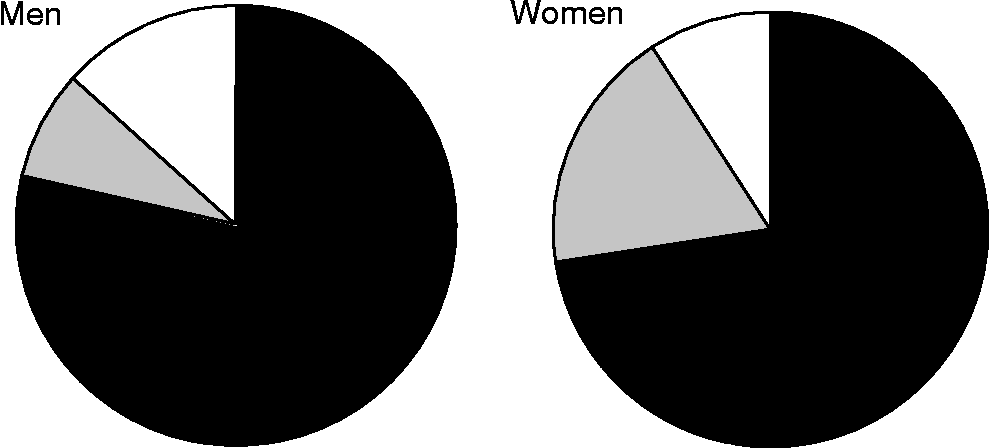
A direct comparison of the AUROC values for WHtR and WC in the twenty-six papers included a total of 147 separate analyses, seventy-one in men, seventy-two in women, and four not divided by sex for a variety of outcomes related to diabetes and CVD risk. These four studies were included in the data for both men and women, giving a total of seventy-five and seventy-six analyses in men and women, respectively. In order to describe the AUROC analyses, we grouped the studies according to whether AUROC values were higher for WHtR, higher for WC or equal for the two outcomes. Figure 2 shows that WHtR, compared with WC, had a higher AUROC value in the vast majority of studies, higher in fifty-eight of seventy-four analyses in men (78 %) and for fifty-four of seventy-five analyses in women (72 %). In several cases, AUROC was the same for WHtR and WC and so WHtR was higher than or equal to WC in sixty-four of seventy-four analyses in men (86 %) and for sixty-eight of seventy-five analyses in women (91 %).
Ranking of area under receiver operator characteristic (AUROC) values in twenty-six study populations, for 147 separate outcome analyses (seventy-one men, seventy-two women, four included in both). (■), Waist-to-height ratio (WHtR) AUROC>waist circumference (WC) AUROC; ( ), WHtR AUROC = WC AUROC; (□), WC AUROC>WHtR AUROC.
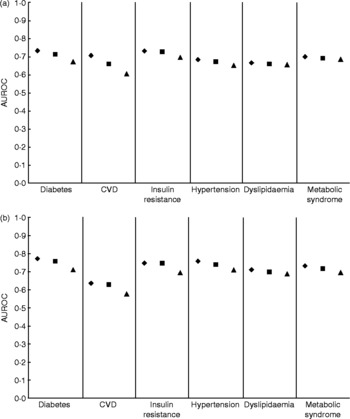
Mean AUROC calculations were weighted for study size. Across the 147 individual analyses in the thirty-one papers, in men and women, the mean AUROC values were 0·704, 0·693 and 0·670 for WHtR, WC and BMI, respectively. Analyses were then grouped by outcome: diabetes, CVD, insulin resistance, hypertension, dyslipidaemia, and the metabolic syndrome. Figure 3 shows the mean AUROC values within each of these categories for men (Fig. 3(a)) and women (Fig. 3(b)). For all outcome categories, in men and women, WHtR showed the highest AUROC value followed by WC, then BMI, indicating that WHtR provides a good screening tool overall for metabolic risk and also for diabetes, CVD and their respective risk factors.
Mean (weighted for sample size) area under receiver operator characteristic (AUROC) values for waist-to-height ratio (♦), waist circumference (■) and BMI (▲), divided by outcome in men (a) and women (b).
Use of receiver operator characteristic data to suggest boundary values for anthropometric indices
ROC curves can also be used to derive and suggest ‘boundary’ or ‘cut-off’ values for anthropometric indices when they are used for practical screening purposes. We prefer the term boundary values, because they are used within a continuous relationship, and hence use it here.
In a ROC curve, the sensitivity (relating to the ability of the anthropometric indices to predict health outcomes in this case) is plotted against the reciprocal of specificity. The AUROC is then calculated and the higher mean value for AUROC indicates better discrimination by the anthropometric index. If the mean AUROC value is less than 0·5, this indicates very poor discriminatory power and so AUROC values are useful to compare different ROC curves and diagnostic tools.
The AUROC value that represents the best compromise between sensitivity and specificity, for any tool often the so-called turning point in the graph, is converted back to suggest a ‘real’ boundary value for the appropriate diagnostic tool.
Figure 4 shows the boundary values, as derived and suggested by authors themselves, for WHtR (Fig. 4(a)) and WC (Fig. 4(b)) for screening different metabolic outcomes. These thirty-five analyses arise from sixteen papers from several investigators studying populations in many different countries covering a wide age range and several ethnic groups(Reference Mansour and Al-Jazairi24, Reference Sargeant, Bennett and Forrester26, Reference Aekplakorn, Pakpeankitwatana and Lee32, Reference Welborn and Dhaliwal36, Reference Schneider, Glaesmer and Klotsche56, Reference Deshmukh, Gupta and Dongre63, Reference Ho, Lam and Janus66, Reference Lopatynski, Mardarowicz and Szczesniak73, Reference Aekplakorn, Kosulwat and Suriyawongpaisal97–Reference Diaz, Mainous and Baker99, Reference Ko, Chan and Cockram102, Reference Lin, Lee and Chen103, Reference Mansour and Al-Jazairi105–Reference Shimajiri, Imagawa and Kokawa107). Within these study populations, there were subjects with Caucasian, Asian, Afro-Caribbean and Central American ethnic backgrounds.
Proposed boundary value for waist-to-height ratio (WHtR) (a) and waist circumference (WC) (b) from area under receiver operator characteristic (AUROC) analysis for men and women, by outcome. Mean boundary value in men (□) and women (○) in individual studies and as a mean by outcome in men (■) and women (●). Overall mean boundary values are weighted for individual study sample sizes. WC was measured at four different anatomical sites across studies; the minimum WC(Reference Sargeant, Bennett and Forrester26, Reference Berber, Gomez-Santos and Fanghanel98, Reference Mirmiran, Esmaillzadeh and Azizi106), WC at or 1 cm from the umbilicus(Reference Mansour and Al-Jazairi24, Reference Aekplakorn, Pakpeankitwatana and Lee32, Reference Lopatynski, Mardarowicz and Szczesniak73, Reference Aekplakorn, Kosulwat and Suriyawongpaisal97, Reference Mansour and Al-Jazairi105, Reference Shimajiri, Imagawa and Kokawa107), WC at the midpoint between the xiphisternum and the umbilicus(Reference Ho, Lam and Janus66) or using the WHO definition of halfway between the lower rib and the iliac crest(Reference Schneider, Glaesmer and Klotsche56, Reference Deshmukh, Gupta and Dongre63, Reference Diaz, Mainous and Baker99, Reference Ko, Chan and Cockram102, Reference Lin, Lee and Chen103). The studies were performed in the following population groups: Asian(Reference Aekplakorn, Pakpeankitwatana and Lee32, Reference Deshmukh, Gupta and Dongre63, Reference Ho, Lam and Janus66, Reference Aekplakorn, Kosulwat and Suriyawongpaisal97, Reference Ko, Chan and Cockram102, Reference Lin, Lee and Chen103, Reference Shimajiri, Imagawa and Kokawa107); Middle Eastern(Reference Mansour and Al-Jazairi105, Reference Mirmiran, Esmaillzadeh and Azizi106); North American(Reference Diaz, Mainous and Baker99); Central American(Reference Berber, Gomez-Santos and Fanghanel98); Caribbean(Reference Sargeant, Bennett and Forrester26); European(Reference Schneider, Glaesmer and Klotsche56, Reference Lopatynski, Mardarowicz and Szczesniak73, Reference Diaz, Mainous and Baker99). DYSLIP, dyslipidaemia; HT, hypertension; MetS, metabolic syndrome.
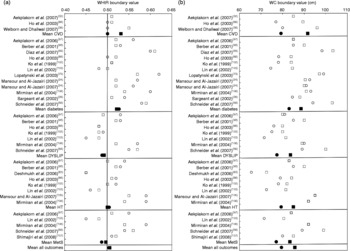
The mean of proposed boundary values for WHtR, weighted for study size, in men and women, respectively, was 0·52 and 0·53 for diabetes, 0·53 and 0·50 for CVD, 0·50 and 0·50 for hypertension outcomes, 0·49 and 0·49 for lipid outcomes and 0·50 and 0·49 for metabolic syndrome outcomes. The mean of all suggested boundary values for WHtR over thirty-four individual analyses covering all outcomes was 0·50 in men and 0·50 in women.
The mean of proposed boundary values for WC, weighed for study size, in men and women respectively, was 88 and 83 cm for diabetes, 92 and 79 cm for CVD, 85 and 79 cm for hypertension outcomes, 84 and 77 cm for lipid outcomes and 83 and 77 cm for metabolic syndrome outcomes. The mean of all suggested boundary values for WC over the same thirty-four different analyses covering all outcomes (data not shown) was for 86 cm in men and 79 cm in women.
Discussion
The present review is the first systematic review of the evidence supporting the use of WHtR, a proxy for abdominal fatness, as a predictor for cardiometabolic risk (i.e. predicting risk factors for CVD and diabetes). It draws on evidence from prospective and cross-sectional studies in both adults and children. Moreover, it puts the relationship between WHtR and disease into context with other proxies for obesity and abdominal obesity, namely BMI and WC. As an additional analysis, results of ROC analyses have also been summarised to indicate sensitivity and specificity of the potential predictors and to investigate possible boundary values for WHtR.
The systematic review included data from some very large, nationally representative cohorts, in a variety of ethnic groups. Importantly, results are consistent between adults and children.
The ‘summary scores’ in Tables 2, 5, 6 and 8 represent our attempt, in the absence of a full meta-analysis, to summarise the outcomes of the different types of studies. We acknowledge the limitations of these ‘summary scores’ and that statistical significance depends on many factors such as size of the study population and the incorporation of demographic or physiological adjustment variables. Each of the three anthropometric indices is more likely to appear ‘significant’ in the largest study populations even though the effect size (strength) of the associations could be quite different. In cross-sectional studies, there was a tendency for very large populations to produce significant findings.
We also acknowledge that the conclusions from a systematic review can only be as good as the studies included within it. We have relied on studies published in the English language and acknowledge that publication bias may have influenced the present results. Some studies showing different results may not have been submitted for publication by their authors and some submitted studies showing different results may have been denied publication. However, the strength of any systematic review is that it is a comprehensive, transparent and an inclusive process which overcomes many other sources of bias which are sometimes found in narrative reviews.
Prospective studies in adults indicate that WHtR and WC are similarly useful as predictors of diabetes and CVD, being significant predictors with similar OR or HR. In some studies WHtR and WC have higher OR or HR than BMI or remain significant predictors after adjustment for BMI, indicating that they are possibly better predictors than BMI. Cross-sectional studies in adults and children supported the observations in prospective studies, with WHtR, WC and BMI all showing a similar proportion of significant relationships with risk factors for diabetes and CVD.
Determination of specificity and sensitivity from ROC analysis clearly showed that WHtR has high AUROC values for all the outcome measures related to diabetes and CVD. From this, we suggest that WHtR would be a good screening tool, probably better than WC (see Fig. 2).
In their paper ‘Six reasons why the waist-to-height ratio is a rapid and effective global indicator for health risks of obesity and how its use could simplify the international public health message on obesity’(Reference Ashwell and Hsieh14) Ashwell & Hsieh presented a narrative review of evidence to support their six reasons which they listed as follows:
(1) WHtR is more sensitive than BMI as an early warning of health risks.
(2) A boundary value of WHtR of 0·5 indicates increased risk for men and women.
(3) A boundary value of WHtR of 0·5 may indicate increased risk for individuals in different ethnic groups.
(4) WHtR is cheaper and easier to measure and calculate than BMI.
(5) WHtR may allow the same boundary values for children and adults.
(6) WHtR boundary values can be converted into a consumer-friendly chart.
Point number (1) focused on the likelihood that WHtR, as an anthropometric index which is a proxy for central obesity, could be more useful than BMI in the prediction of health risks (the word sensitive was not used in relation to any particular boundary value in this case). The present systematic review has provided supportive evidence for this point, with WHtR (and WC) being a risk factor more often than BMI. Further, the AUROC analysis has provided good evidence that WHtR is probably a better diagnostic predictor than BMI or WC. To provide further statistical support for this statement a meta-analysis is required. However, this is beyond the scope of the present systematic review. The AUROC data have also provided good evidence that the suggestion made in point number (2) that a WHtR of 0·5 is a good boundary value for men and women across many ethnic groups. Comparison of the summary lines covering all health outcomes in Fig. 4(a) and (b) and the suggested mean boundary values for WHtR and WC show clearly that the same boundary value of WHtR can be used for men and women (0·5), whilst distinct WC boundary values must be used.
Thus, these analyses support the proposal that WHtR may be advantageous because it avoids the need for age-, sex- and ethnic-specific boundary values(Reference Ashwell and Hsieh14) and helps to avoid the confusion whereby many different boundary values for WC have been published for different ethic groups(Reference Shimajiri, Imagawa and Kokawa107). If the suggested boundary value of WHtR 0·5 were to be adopted, this would simplify the application of this diagnostic tool to provide the health message ‘keep your waist circumference to less than half your height’. Further studies are required in men, women and children of different ethnic groups to add support to point number (5).
In relation to point (4), WC can be measured more cheaply and less intrusively than BMI, since measuring weight requires accurate scales and often requires some degree of subject undressing. However, it is recognised that WC can be measured at a variety of different sites (indicated in the legend for Fig. 4(a) and (b)) and that this will affect the boundary value. Importantly, comparison of WC measured at a variety of sites indicates that all are highly reproducible and are similarly correlated with total body fat in a sex-dependent manner(Reference Wang, Thornton and Bari108). While measuring the narrowest WC would be expected to give smaller values of WC than other techniques, it is interesting in Fig. 4(a) and (b) that the studies using this method did not give the smallest boundary value for WHtR or for WC.
In relation to point number (6), the principle of a Shape Chart, to replace a Weight Chart, was proposed as early as 1995(Reference Ashwell109). Prototypes of charts for adults based on boundary values for WHtR were suggested shortly afterwards(Reference Ashwell110, Reference Ashwell111), followed by the publication in 2005(Reference Ashwell and Hsieh14). The AUROC data have confirmed that 0·5 is an appropriate boundary value for increased risk in men and women from many ethnic groups. Further corroboration of 0·6, originally proposed pragmatically as a boundary value for higher risk(Reference Ashwell111), and the appropriate boundary value for risk in children, awaits further studies.
Final conclusions
Observations of seventy-eight prospective and cross-sectional studies suggest that while WHtR, WC, and BMI are all predictors of CVD, diabetes and related risk factors, WHtR and WC are more probably reliable predictors than BMI. A meta-analysis is now required to provide further statistical support for these suggestions. The AUROC analysis and the calculation of a weighted mean WHtR of 0·5 suggests that WHtR is a suitable screening tool applicable to a wide variety of populations. Its simplicity and its conversion to the easily remembered public health message ‘keep your waist circumference to less than half your height’ argues for its practical adoption.
It is pleasing that various authoritative bodies recognise the importance of central obesity by recommending the use of WC as a useful screening tool in many primary care situations. However, there is the problem that at least five different cut-off levels of WC, for different sexes, ethnic groups and even different countries, have been proposed (summarised in Alberti et al. 2009(Reference Alberti, Eckel and Grundy112)) to account for the effect of height on metabolic risk within different populations. The use of WHtR, with a simple global boundary value of 0·5, could overcome this confusing situation, with obvious benefit to the public health promotion message.
The early phase of the systematic literature search indicated that the number of papers that reported relationships between WHtR and health outcomes is miniscule in the context of those which report other simple obesity measures and health outcomes: they are only 2 % of WC papers, and 0·2 % of BMI papers. It is, perhaps, surprising that, up to the cut-off point for our systematic review (end of 2008), as many as seventy-eight ‘included’ papers had calculated WHtR as well as WC when they were investigating the effect of central obesity on a variety of health outcomes. We have noticed a substantial increase in WHtR papers in 2009 and the first part of 2010(Reference Ashwell and Gibson113–Reference Xiong, Garnett and Cowell118), many of which provide data to support the use of the boundary value of 0·5, or use 0·5 as the boundary value to divide their population and assess risk. We hope that the evidence summarised here for WHtR as a predictor of diabetes, CVD and related risk factors, and the usefulness of the global boundary value of 0·5, will encourage the use of this index in existing and future studies. This would provide more data and allow further consideration and confirmation of clinically relevant boundary values for WHtR in children as well as adults.
Acknowledgements
This research received no specific grant from any funding agency in the public, commercial or not-for-profit sectors.
L. M. B. was involved in study design, collected the data and prepared the manuscript, M. A. and S. D. H. were involved in study design, preparation and review of the manuscript.
There are no conflicts of interest to declare.



