

Food security is defined by the FAO (2012) as( 1 ):
‘when all people at all times have physical, social and economic access to food, which is safe and consumed in sufficient quantity and quality to meet their dietary needs and food preferences, and is supported by an environment of adequate sanitation, health services and care, allowing for a healthy and active life.’
This definition encompasses four dimensions, which are fundamental to the achievement of food security. The first dimension is the physical availability of enough nutritionally adequate, quality food. Availability does not necessarily predict access. The second is adequate financial resources and physical means of accessing such food( Reference Gross, Schoeneberger and Pfeifer 2 ). The third, food utilisation, has two aspects. The first encompasses the physiological utilisation of food and is reliant on safe food and water; the second is dependent on a household’s ability to safely prepare, cook and store foods( Reference Barrett 3 , Reference Innes-Hughes, Bowers and King 4 ). The final dimension is the stability of the previous three dimensions over time through seasonal and temporal changes( Reference Gross, Schoeneberger and Pfeifer 2 ). The absence or disruption of any of these dimensions results in the occurrence of food insecurity. Food insecurity is a significant problem, even in developed countries, with prevalence in the USA and Canada reported to be about 12 %( Reference Coleman-Jensen, Rabbitt and Gregory 5 , Reference Tarasuk, Mitchell and Dachner 6 ).
Food insecurity has negative implications across the lifespan, resulting in poor dietary intake and negative health consequences. Among adults, food insecurity is associated with obesity, mental illness, chronic disease and social isolation( Reference Girard and Sercia 7 – Reference Seligman, Laraia and Kushel 12 ). Food insecurity in children may be associated with poor general health and development, and behavioural and academic issues( Reference Cook, Frank and Levenson 13 – Reference Shankar, Chung and Frank 15 ). Food insecurity is a serious public health issue and accurate measurement of its prevalence, as well as its varying levels of severity, is imperative to understand the magnitude of the issue and its determinants, so that initiatives and strategies to alleviate food insecurity are appropriately targeted and effective.
Several tools exist for the measurement of food security, including both single-item and multi-item tools. Single-item tools, such as that used in the assessment of food insecurity in Australia( 16 ), are unable to differentiate between varying levels of severity and have been shown to potentially underestimate the true burden of food insecurity, compared with their multi-item counterparts( Reference Ramsey, Giskes and Turrell 17 – Reference Nolan, Rikard-Bell and Mohsin 19 ).
In contrast, multi-item tools offer a more comprehensive means of assessing food security, providing the opportunity to assess varying levels of severity by eliciting data on a variety of different experiences and behaviours pertaining to food security. The most widely utilised multi-item tool is the eighteen-item US Department of Agriculture Food Security Survey Module (USDA FSSM)( Reference Chi, Masterson and Carle 20 – Reference Langellier, Chaparro and Sharp 22 ). The USDA FSSM has previously undergone multiple, rigorous validations and is known to be a valid and reliable tool for use among a broad variety of populations and population subgroups in varying contexts( Reference Marques, Reichenheim and de Moraes 23 ). However, one critique of the USDA FSSM is that it assesses only one dimension of food security (economic access), failing to account for the other three. Similar to the problems with single-item tools, this failure to account for all dimensions of food insecurity may result in underestimation of the true burden of food insecurity. A recent systematic literature review of other multi-item tools used to assess food insecurity revealed that there is no one tool available that measures the four dimensions of food security( Reference Ashby, Kleve and McKechnie 24 ).
While commonalities exist in the experiences of food insecurity, important differences may exist across cultures and countries. As such, generalisations regarding the lived experience of food insecurity, and consequently the ability to measure this phenomenon, should be taken with caution. In order to collect quality data pertaining to food insecurity, tools should be adapted and/or developed and validated in consideration of local values, experiences, language use and comprehension( Reference Coates, Frongillo and Rogers 25 , Reference Melgar-Quinonez, Nord and Perez-Escamilla 26 ).
In light of this, recent efforts in Australia have focused on establishing whether there is a perceived need for a new tool to assess food insecurity among an Australian population, capable of assessing food insecurity within the context of all four dimensions; this has led to the development of the Household Food and Nutrition Security Survey (HFNSS)( Reference Archer, Gallegos and McKechnie 27 ). In light of the absence of such a tool in previous literature, the aims of the present study were to: (i) assess the construct validity and internal reliability of the HSNSS; and (ii) explore the prevalence of food insecurity measured by this newly developed Australian tool compared with that measured by the widely used USDA FSSM.
Methods
The present study was conducted according to the guidelines laid down in the Declaration of Helsinki and all procedures involving human subjects were approved by the Monash University Human Research Ethics Committee (project number CF14/1382–2014000647). Written informed consent was obtained from all participants.
Study design
A cross-sectional design was employed to compare the newly developed HFNSS with the USDA FSSM.
Sampling and recruitment
A convenience sample of participants was recruited in metropolitan Melbourne, Australia. Eligibility criteria for the study included age 18 years or older and residing in metropolitan Melbourne. Sampling occurred via a two-stage process.
Stage one involved the identification of all suburbs in Melbourne that rated as very high, high or medium vulnerability in the 2008 Vulnerability Assessment for Mortgage, Petrol and Inflation Risks and Expenditure (VAMPIRE) index( Reference Dodson and Sipe 28 ). The VAMPIRE index is based on Census data and provides a measure of household vulnerability based on three socio-economic stressors: car dependence, mortgages and income( Reference Dodson and Sipe 28 ). Households are categorised as ‘minimal vulnerability’, ‘low vulnerability’, ‘moderate vulnerability’, ‘high vulnerability’ and ‘very high vulnerability’, with those who report high levels of car ownership, who journey to work by car, who have mortgage tenure and/or who have low incomes being considered ‘more vulnerable’. The characterising stressors used in allocating vulnerability status may predispose a household to food insecurity( Reference Rossimel, Han and Larsen 29 ). For example, in Australia, where mortgages and the cost of living are high relative to wages, owning and running private transport( Reference Harrington, Friel and Thunhurst 30 ) and/or maintaining a mortgage( Reference Engels, Nissim and Landvogt 31 ) are likely to negatively impact household finances available for food acquisition. It has been suggested that such costs of living may be prioritised above the household food budget, with the latter being considered flexible and thus sacrificed in order to pay other bills/meet other costs of living( Reference Lambie-Mumford and Dowler 32 ). A higher vulnerability rating may increase the risk of food insecurity; thus suburbs classified as having moderate, high or very high vulnerability were selected for inclusion in the study.
Stage two involved the recruitment of a convenience sample of people in the eligible suburbs. Information about the study was disseminated through online advertisements (promoted though social media of organisations including Playgroup Victoria, study university website and community agencies) and information flyers displayed in key community locations (waiting rooms and notice boards of community health centres, libraries, and local government and church organisations). The main food shopper in the household was specifically requested to fill in the survey.
Data collection
Individuals electing to participate in the study were directed to complete a self-administered survey, either online via provision of a link included in the study information materials or via a hard copy.
Variables
Demographic characteristics
The questionnaire included several standard, previously validated items for demographic characteristics( 33 ). Participants were asked to report their gender, age, living arrangements, country of birth, highest level of education, employment status and household income. Responses to these questions were recoded and categorised in accordance with Table 1. The average income within each response range was used to identify the mean income after tax for each income bracket. The mean income after tax was then compared with Australian Federal Poverty Lines (FPL)( 34 ), as determined by the Australian Council of Social Services, to determine the proportion of the FPL each household income met.
Demographic characteristics of the convenience sample of adults (n 134) from metropolitan areas of Melbourne, Australia, September 2014–September 2015
FPL, Federal Poverty Line.
* 100 % of FPL equates to half the national median income for respective household.
† 200 % of FPL equates to the national median income for respective household.
Food security status
Food security status was assessed using the USDA FSSM as well the newly developed HFNSS. All participants completed these scales in this respective order (no randomisation of scale order took place).
The USDA FSSM is a validated tool that comprises eighteen items (ten adult-related, eight child-related items) pertaining to the food situation for both adults and children in a household in the previous 12 months. This scale includes questions about running out of food and being unable to purchase more due to financial constraints, being unable to afford balanced meals, reducing the size of meals or skipping meals because of being unable to afford food, and going hungry due to not being able to afford food( Reference Bickel, Nord and Price 35 ). The USDA FSSM has previously been adapted and validated for use as a self-administered questionnaire within Australia( Reference Ramsey 36 ).
The process of developing the HFNSS is further described elsewhere( Reference Archer, Gallegos and McKechnie 27 ). Briefly, the HFNSS was developed using a series of focus groups and a three-stage Delphi survey. The pre-validation version of the HFNSS was a twenty-six-item tool that aimed to measure food security across three of the four dimensions of food security: physical availability, financial and physical access, and utilisation. This version of the HFNSS incorporates a 12-month retrospective reference period and comprises questions adapted from pre-existing measures of food security. The first questions require respondents to identify as many reasons as relevant for not being able to access enough food, or quality nutritious food, from a list of potential contributors to food insecurity; these reasons include those from the initial screening question in the USDA FSSM, as well as additional items identified during the focus groups and survey mentioned above. The remaining questions relate to changes to the quantity or quality of foods eaten, stress about being unable to provide food for social occasions or running out of food, and reliance on emergency food relief or others for food. Unique to the tool is the reference by each item back to the first question, thus the questions are framed in the context of the contributors to food insecurity that are unique to the household as reported by the respondent. As such, the survey is automatically tailored to assess food security status based on the unique experiences of each individual household. This allows the tool to collect data regarding any instances of stress/worry related to food intake, or subsequent changes to intake, that may arise due to disruption to any of the domains of food security, not just the access domain currently assessed by existing scales.
Households without children were required to complete only adult-related items in the USDA FSSM and the HFNSS. Responses to both the USDA FSSM( Reference Bickel, Nord and Price 35 ) and the HFNSS were summed (score of 1 for an affirmative response and 0 for a negative response) to give a continuous score, with higher scores indicating more severe levels of food insecurity. For the purpose of comparing the tools, cut-off points were designated to classify households accordingly as being ‘food secure’ or ‘food insecure’. International discussions have yielded inconsistent opinions regarding the cut-off score for a household to be classified as food insecure. The USDA FSSM considers food insecurity to occur once any changes to food intake happen (i.e. after initial concern about food lasting, at the point when quality and/or quantities of food may be altered), with a score of 3 or more indicating food insecurity( Reference Bickel, Nord and Price 35 ). Alternatively, others argue that even a single affirmative response (i.e. a score of 1) may be enough to consider a household food insecure( Reference Tarasuk, Mitchell and Dachner 6 , Reference Gundersen, Kreider and Pepper 37 ). For this reason, we compared classification by the HFNSS using two different cut-off points. First, households with even a single affirmative response were considered food insecure; thus households with scores of 1 or more were classed as ‘food insecure’ while those with scores of 0 were classified as ‘food secure’. Second, based on the frequency and severity of responses to items in the HFNSS, it was identified that the most common affirmative responses to the HFNSS were changing the variety of foods eaten and/or having smaller meals; these are common coping mechanisms adopted by households for managing food budgets alongside other costs of living. Failure of such coping mechanisms is likely to result in stress associated with acquiring sufficient amounts of and/or quality food, as well as more drastic changes in food intake including going hungry and without whole meals or food for extended period of time. With this in mind, it was identified that stress relating to running out of food (i.e. a failure in food-related coping mechanisms) and subsequent drastic changes in food intakes were indicated by scores of 3 or higher; this was compared with the accepted scoring of the USDA FSSM (where scores of 3 or higher are also indicative of food insecurity)( Reference Bickel, Nord and Price 35 ).
Statistical analyses
Data were analysed using the statistical software package IBM SPSS Statistics for Windows, Version 22.0.
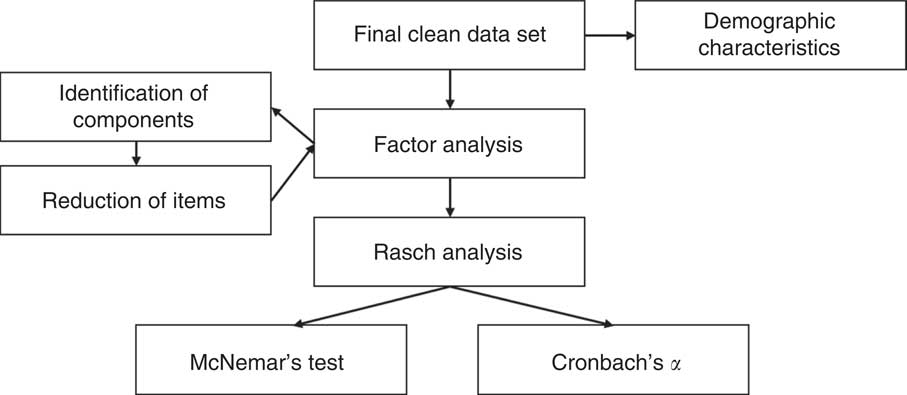
Factor analysis (maximum likelihood analysis with oblique rotation (direct oblimin)) was undertaken to identify the underlying components assessed by the HFNSS and the respective items loading on to each component, as well as to identify and remove items that were not contributing to measurement. In consideration of the small sample size of the current study (n 134), a cut-off point of 0·45 was used to indicate strong loading for retention of items( Reference Tabachnick and Fidell 38 , Reference Hair, Anderson and Tatham 39 ). The underlying components were then identified based on the combination of items loading on to them.
Rasch analyses were then undertaken, using jMetrik freeware, to investigate the psychometric properties of the scale. INFIT values were used to investigate the discriminative capacities of the items by comparing expected with actual responses. INFIT values of 1 indicate an item fitting the model perfectly. INFIT values below 1 indicate fewer affirmative responses than predicted, and that an item may be redundant. Conversely, INFIT values above 1 indicate more affirmative responses than expected, and that data from an item may be ‘overvalued’. Based on widely accepted ranges, cut-off values were set at a recommended range of 0·8 to 1·2, with a wider acceptable range of 0·7–1·3( Reference Wright, Linacre and Gustafson 40 ).
McNemar’s test (cross-tabulation) was used to identify significant differences in the prevalence of food insecurity as identified by the HFNSS and USDA FSSM, and reliability analysis (Cronbach’s α) was used to investigate internal reliability of the HSNSS. Figure 1 summarises the process of statistical testing.
Statistical analysis process
Results
Demographics
The majority of the cross-sectional cohort was female (87·3 %), born in Australia (73·1 %) and aged 26–55 years (70·9 %). Nearly two-thirds of the participants (66·4 %) were homeowners and 54·5 % reported living with their spouse/partner and children. Almost half had household earnings of more than $AU 80 000 (49·6 %) and 44·8 % had some type of paid work. Nearly 80 % of households had household incomes less than the national median income for the same household type, and one in five households were identified as falling below the FPL. Most households had access to personal motor transport (85·8 %; Table 1).
Construct validation
Before commencing analyses, the suitability of the data for factor analysis was assessed. Bartlett’s test of sphericity was significant and the Kaiser–Meyer–Olkin measure of sampling adequacy indicated that the strength of the relationships among variables was adequate, indicating suitability of the data for factor analysis.
Four items (Table 2) were identified to have loadings below the designated cut-off point of 0·45 and were subsequently removed. Further analysis of the retained items revealed three underlying components which explained 62·1 % of the variance. The retained items loading on to each respective component are summarised in Table 2. Based on these loadings, the components were identified as: the adult experience of food insecurity (component one); initial/periodic changes to children’s food intakes (moderate food insecurity among children; component two); and progressive/persistent decreases in children’s food intakes (severe food insecurity among children; component three).
Item loadings and fit statistics for the Household Food and Nutrition Security Survey applied among the convenience sample of adults (n 134) from metropolitan areas of Melbourne, Australia, September 2014–September 2015
* INFIT values fell within the widely accepted range of fit (0·7–1·3).
† Did not load on to identified factors.
Of the twenty-two items retained after factor analysis, all fell within the widely accepted range for fit in the Rasch analysis (0·7–1·3)( Reference Wright, Linacre and Gustafson 40 ) (Table 2), indicating that all were conducive to measurement and further supporting the findings of the factor analyses. Table 2 also summarises the proportion of affirmative responses to each item, with items ordered in ascending level of severity.
Internal consistency
The HFNSS indicated excellent reliability (Cronbach’s α=0·895).
Comparison between HFNSS and USDA FSSM
The prevalence of food insecurity identified by the USDA FSSM was approximately half that identified by the HFNSS (Table 3). Using a cut-off value of 1, the prevalence of food insecurity estimated by the USDA FSSM was 29 %, which was significantly lower than the 57 % estimated by the HFNSS (χ 2=10·41, P<0·001). Using a cut-off value of 3, the prevalence of food insecurity estimated by the USDA FSSM remained significantly lower than that estimated by the HFNSS, with prevalence of 15 and 34 %, respectively (χ 2=15·75, P<0·001).
Food security classifications among the convenience sample of adults (n 134) from metropolitan areas of Melbourne, Australia, September 2014–September 2015
USDA FSSM, US Department of Agriculture Food Security Survey Module; HFNSS, Household Food and Nutrition Security Survey.
*Significantly different from HFNSS at P ≤0·001.
While access was the most commonly reported (32 %) pillar affecting food security, a notable proportion of participants (15 %) provided responses that suggested utilisation was a key barrier to food security (Table 4).
Pillars of food security compromised among the convenience sample of adults (n 134) from metropolitan areas of Melbourne, Australia, September 2014–September 2015
Discussion
The present study piloted a new tool, the HFNSS, to measure household food security in an urban population in Melbourne, Australia, to investigate its psychometric properties, validity and reliability. After assessment using two different cut-off points, the HFNSS consistently identified a significantly higher proportion of food-insecure households, compared with the current USDA FSSM. Investigation into the psychometric properties of the tool and its internal consistency suggests that the HFNSS may be a valid and reliable tool for the measurement food security in Australia; however, further research and testing are required to determine validity and reliability across a variety of different populations.
Factor analysis identified three underlying constructs measured by the HFNSS: the adult experience of food insecurity (component one), initial/periodic changes to children’s food intakes (moderate food insecurity among children; component two) and progressive/persistent decreases in children’s food intakes (severe food insecurity among children; component three). These constructs may provide an opportunity for the individual assessment of food insecurity among adults and/or children within a household, as well as the ability to assess varying levels of severity, as children are often ‘protected’ from the implications of food insecurity by a parent and are affected only when more severe food insecurity occurs( Reference McIntyre, Glanville and Officer 41 – Reference Nt and L 43 ). During the initial development of the HFNSS, focus group participants highlighted the importance of a tool being able to assess levels of severity of food insecurity( Reference Archer, Gallegos and McKechnie 27 ). Indeed, the ability to assess the severity of food insecurity is essential to accurately measure its prevalence, as varying levels of severity are associated with uniquely different indicators( Reference Bickel, Nord and Price 35 ).
Findings from the factor analysis led to the exclusion of four questions, three of which were related to children’s experience of food insecurity. This was unsurprising, as this is reflective of the actual lived experience of food insecurity, where parents protect children from the effects of food insecurity( Reference Nord 44 , Reference Hadley and Crooks 45 ). The remaining twenty-two items were all identified as being conducive to measurement in subsequent Rasch analyses, supporting the construct validity of this newly proposed scale. However, this number of items may still limit the practicability of this tool. The inclusion in surveys of scales with large numbers of items may not be practical for various reasons, including higher risk of participant burden, lower response rates and cost. Reduction of items should be a key focus of future research to increase the usability of the HFNSS( Reference Galesic and Bosnjak 46 ). Validation of a shorter tool that would assess food security quickly, and still represent the true prevalence of food security, such as the USDA six-item short form, would be of practical benefit( Reference Bickel, Nord and Price 35 ).
The HFNSS was developed to address a limitation of existing measures of food security: specifically to measure all underlying domains of food security, namely availability, utilisation and types of access, beyond just financial access. It has been hypothesised that a failure to assess domains other than just financial access may result in an underestimation of the true prevalence of food insecurity. This hypothesis was supported by our findings, which indicated a significant difference in the prevalence of food insecurity identified by the HFNSS compared with the USDA FSSM. The HFNSS indicated that a large proportion of respondents experienced disruption in the ‘utilisation’ pillar underpinning food security; as the USDA FSSM focuses solely on food access, it was unable to identify the food insecurity arising from reasons other than insufficient financial resources. This finding may have important implications for future practice; the selection of a tool that fails to acknowledge all domains of food insecurity, even the more comprehensive multi-item tools, may result in significant underestimation of the true prevalence of food insecurity. Future studies should seek to employ a measure that assesses all domains of food insecurity, or interpret findings of other tools in the context of this marked limitation. The HFNSS may provide an opportunity to assess food insecurity that occurs due to disruption in any of the underlying domains, not just financial access, and as such may provide insight into the true burden of food insecurity among Australian population groups.
The findings of the present study must be considered within the context of a number of potential limitations. Our sample may not be representative of the wider Victorian population, exhibiting a higher proportion of female respondents (87·3 %) compared with the demographic profile of the Victorian population captured in the 2011 Census (50·8 % female)( 47 ). This may have been due to our methods of recruitment, which specifically requested that the main food shopper in the household complete the survey; it has been noted previously that women tend to be the main food provider for the household( 47 ). However, this higher percentage of female respondents may contribute to more a more reliable estimate of the true prevalence of food insecurity and estimates of difference in measurement capabilities between food security measurement tools, as women have been shown in the past to provide more reliable estimates of the food experiences of a household( Reference Parnell and Gray 48 ). Our sample also had a higher rate of participants who identified as homeowners with a mortgage (66·4 %), compared with the state rate of 35·9 %( 47 ). Future efforts to further validate the HFNSS should seek to ensure adequate representation from households from a range of population subgroups including those living with disadvantage.
The current study and its subsequent generalisability was limited by a small sample size (n 134). To accommodate for this, conservative cut-off points were selected in accordance with literature. However, findings should be interpreted with caution, and results may not be able to be extrapolated to the broader population or to vulnerable subgroups of the population who may be at higher risk of food insecurity (e.g. refugees, Aboriginal and Torres Strait Islanders and disadvantaged households). In addition to the small sample size, the population sampled was limited to metropolitan Melbourne and not representative of the Victorian or wider Australian population living in peri-urban, rural, regional or remote areas. We recommend that the HFNSS undergoes further testing and validation studies among larger sample sizes and other population subgroups to further assess the validity of the measure across the varying population subgroups in Australia and to investigate the comparability of data collected across such groups. In addition, the survey should be piloted and adapted to suit all possible administration modes, including face-to-face, telephone-administered and self-administered, to ensure that data collected using different methodologies are directly comparable. Differences in administration modes have previously been investigated for the USDA FSSM, and it was found that there was no substantial difference( Reference Nord and Hopwood 49 ).
Finally, while our tool provides an indication of the severity of food insecurity through the generation of a continuous score, further work is required to establish cut-off points to extend beyond dichotomous classification in order to identify categories of severity, similar to those provided by the USDA FSSM. Such efforts should incorporate further input from experts and practitioners working in the area of food security, which was beyond the scope of the current project.
Conclusion
The present study is the first to pilot and test the HFNSS within a population in metropolitan Melbourne. Findings suggest that the HFNSS may be a valid and reliable survey for the measurement of food insecurity among an Australian population, with a significantly higher proportion of food insecurity identified by the HFNSS compared with the current widely used USDA FSSM. The eighteen items identified as conducive to measurement in the current study measured three underlying constructs (the adult experience of food insecurity, initial/periodic changes to children’s food intakes (moderate food insecurity among children) and progressive/persistent decreases in children’s food intakes (severe food insecurity among children)). With further testing and validation, the HFNSS will provide a comprehensive measure of food security in Australia through the assessment of all underlying domains. This will provide improved opportunities to identify the domain of food security that has been compromised, allowing a more comprehensive assessment of food insecurity than what is known currently and developed targeted interventions to address this significant issue.
Acknowledgements
Financial support: This research received no specific grant from any funding agency in the public, commercial or not-for-profit sectors. Conflict of interest: No competing interests of the authors. Authorship: C.P., S.K. and R.Mc. conceptualised the study and analysis. S.K., R.Mc. and S.A. conducted and interpreted analysis of the data. S.K. and R.Mc. developed the manuscript. C.P. and D.G. developed and reviewed the manuscript. Ethics of human subject participation: This study was conducted according to the guidelines laid down in the Declaration of Helsinki and all procedures involving human subjects were approved by the Monash University Human Research Ethics Committee (CF14/1382 – 2014000647). Written informed consent was obtained from all subjects.


