


1. Introduction
Interannual variability in the net surface mass balance of glaciers in Canada’s Queen Elizabeth Islands (QEI) is due largely to variability in the summer surface mass balance (Reference KoernerKoerner, 2005), which is directly correlated with variability in summer surface air temperatures. From 1963 until the end of the 20th century, there was little variability in either the summer mean surface air temperature or the mass balance of glaciers and ice caps in the QEI, and only a weak trend towards warmer summers and increasingly negative mass balances that started about 1987 and accelerated after 1998 (Reference BraithwaiteBraithwaite, 2005; Reference KoernerKoerner, 2005; Reference Gardner and SharpGardner and Sharp, 2007). Between 2005 and 2009, however, the summer mean surface air temperature over glaciers and ice caps in the QEI was 0.8-2.28C higher than the 2000-04 average, and 3048% of the total mass loss from four monitored glaciers since 1963 occurred in this period (Reference Sharp, Burgess, Cogley, Ecclestone, Labine and WolkenSharp and others, 2011). The annual rate of mass loss from all glaciers in the region increased sharply from ∼31 Gta–1 in the period 2004-06 to ∼92 Gta–1 from 2007 to 2009 (Reference GardnerGardner and others, 2011).
Atmospheric circulation variability influences both regional summer mean air temperatures and surface mass balance in the QEI. Anticyclonic conditions over the region in summer tend to be associated with high rates of melt, while cyclonic systems can be associated with either low or high melt rates (Reference AltAlt, 1978). High melt years tend to occur when a ridge intrudes from the south into the QEI, while low melt years are associated with a stationary deep cold trough that extends across the QEI and into Baffin Bay (Reference AltAlt, 1987). Negative mass-balance anomalies prevail in years when the July circumpolar vortex is centered in the eastern hemisphere, while positive anomalies occur in years when the vortex is strong and located in the western hemisphere (Reference Gardner and SharpGardner and Sharp, 2007). Reference Wang, Sharp, Rivard, Marshall and BurgessWang and others (2005) suggested that interannual variations in summer melt duration in 2000-04 were closely related to variations in the July 500 hPa height over the QEI, with longer melt seasons occurring in years with above-average geopotential height. The occurrence of low-pressure systems over the region can alter the surface energy balance of glaciers by changing the net longwave and/or net shortwave radiation at the surface relative to what is observed under anticyclonic conditions. Cloudy conditions reduce the incoming shortwave radiation, but increase the incoming longwave radiation because a larger fraction of the outgoing longwave radiation is absorbed by the clouds and re-radiated back to the ground. However, the role of changes in the relative frequency of different synoptic weather types in the recent trends in summer mean air temperature and the surface mass balance of the region’s glaciers has yet to be established and is the focus of this paper.
At ∼14000 km2 Devon Ice Cap is the third largest and most southerly ice cap in the QEI (Reference Dowdeswell, Benham, Gorman, Burgess and SharpDowdeswell and others, 2004). Between 2004 and 2010, ground-based measurements of meteorological conditions were made at multiple locations spanning a 1300 m elevation range along a 47 km long transect that passes through all major snow facies zones on the south side of the ice cap (Fig. 1). Here these measurements are analyzed to determine trends in the surface air temperature and in the timing and duration of the summer melt season and to investigate the changes in glacier surface mass and energy balances. These are then related to changes in the Arctic atmospheric circulation
Weather stations, net radiometers and HOBO temperature sensor distribution on Devon Ice Cap. Weather stations, net radiometers and three of the HOBOs are located at sites 1 , 2 and 3. The southernmost HOBO sensor is designated by the letters HB followed by its distance (km) away from site 1 . Contour intervals are 50 m.

2. Methods
2.1. Field data collection
Devon Ice Cap is located on Devon Island, Nunavut, Canada. Between 2004 and 2010, measurements were made by three Campbell Scientific automatic weather stations (AWS) located at 1800ma.s.l. (site 1; ice-cap summit), 1300ma.s.l. (site 2) and 1000ma.s.l. (site 3). Surface air temperature was measured with 107B temperature probes mounted in 41303-5A radiation shields. The probes’ sensors were Beta Therm 100K6A with a range of -508C to +508C and an accuracy ranging from ±0.58C below -408C to ±0.1 8C above 08C. Horizontal wind speed and direction were measured with RM Young 05103AP-10 wind monitor sensors with a range of 0-60 ms–1. Accuracy is ±0.3 m s–1 for wind speed and ±38 for direction. Relative humidity (RH) was measured using Vaisala HMP35CF relative humidity probes, which can operate in temperatures ranging from -208C to +608C and have an accuracy of ± 2% (0-90% RH) to 3% (90-100% RH). Surface elevation changes were measured by Campbell Scientific SR50 sonic rangers with measurement ranges of 0.5-10.0 m; accuracy is ±0.01 m or 0.4%. All instruments were installed 1.5-2.0m above the snow surface. Height of the sensor is referred to as 2 m above the snow surface for all instruments since this is the average height of all sensors over the summer months. Measurements made every 2 s were averaged and stored every 2 hours for all instruments. Since the weather stations are serviced only once each year, typically between mid-April and the end of May, a sampling interval of 2 hours was chosen to allow the weather stations to remain operational all winter. In summer, the batteries were charged by a Campbell Scientific MSX20 solar panel providing 2 0W at peak output. Data were logged with Campbell Scientific CR10 or CR10x data loggers.
Surface air temperature was also measured using four Onset HOBO H8 Pro (H08-030-08) temperature sensors. Three of these were located at the AWS sites and one was located at the ice-cap margin at an elevation of 475 m (HB 47-4). The accuracy of these sensors is ±0.258C. The sensors were installed in M-RSA Onset radiation shields and recorded near-surface (∼1-2m) air temperature at 10min (2004), 15 min (2005-06) and 30min intervals (2007-10). The poles in the ablation area were expected to melt out, so they were drilled deep into the ice. The HOBO sensors were thus initially installed near the surface so they would move up towards 2 m above the snow surface over time as ablation took place; for consistency all HOBO sensors were installed at the same height along the surveyed transect. The Devon Ice Cap field site was visited twice each year (in the spring and fall) until 2007, allowing the opportunity to record data more frequently in summer and to change the AWS and sensor batteries in the fall. In 2007, it was decided to decrease the recording time interval to ensure continuous data logging throughout the winter.
Shortwave and longwave radiation budgets and surface albedo were measured with Kipp & Zonen CNR1 net radiometers at sites 1, 2 and 3 from 2007 to 2010. Incoming and reflected solar radiation were measured with two CM3 pyranometers, and surface albedo was determined as the ratio of reflected to incoming solar radiation. Incoming and outgoing far infrared radiation were measured in a similar manner using two CG3 pyrgeometers. CM3 and CG3 sensor accuracy is ±10%. The CM3 sensors measure radiation in the spectral range 305-2800nm, while the CG3 sensors measure radiation in the spectral range 5-50 mm. The sensors were installed at a height of 1.5-2.0m above the snow surface, with sensors of each type oriented towards both the sky and the ground. Radiation and albedo measurements were made every 2 s, and averages were stored every 2 hours on CR10x data loggers. For summer 2009, only air temperature at site 2 is available due to AWS, net radiometer and HOBO malfunction at sites 1 and 3 and net radiometer failure at site 2.
2.2. Two-metre air temperature processing
Two-metre air temperatures measured at sites 1, 2 and 3 were averaged to daily and monthly values. Daily averages were computed by averaging measured 2 hourly air temperature over 24 hour periods (local time). Monthly average values are the averages of those daily averages over June, July and August. HOBO air temperature data were used when complete AWS records were not available (for all sites in 2004 and 2006, site 2 in 2005 and site 1 in 2007 and 2008). Air temperatures measured by the HOBO sensors were corrected to account for the instrument height differences compared with the height of the AWS temperature sensors. The linear regression relationship between air temperatures measured by the HOBO sensors and AWS temperature sensors was computed at each site for years when both datasets were available and used to correct the air temperature at the sites for variations in instrument height. At sites 1, 2 and 3, HOBO air temperatures were multiplied by 0.77, 0.97 and 0.91 (all p< 0.05), respectively, and constants of 0.488C, 0.348C and 0.608C, respectively, were added to the air temperature to ensure consistency with the AWS measured temperatures.
2.3. Energy-balance modelling
The June-July-August (JJA) surface energy balance (SEB) was calculated as the sum of the net radiative (shortwave and longwave) and turbulent (sensible and latent heat) fluxes. Both the subsurface heat flux and the sensible heat flux supplied by rain were neglected in this analysis. Fluxes were considered positive when directed towards the surface. Ice melt rates (cmw.e. d–1 or a-1) were derived by dividing the melt energy by the latent heat of fusion of water and the density of liquid water (Reference HockHock, 2005).
The daily net radiation was computed by summing the measured 2hourly recorded net longwave (incoming minus outgoing) and shortwave (incoming minus reflected) radiation fluxes. Penetration of shortwave radiation below the surface was ignored.
The sensible and latent heat fluxes were calculated from AWS measurements of surface air temperature, relative humidity and wind speed at a single height using the bulk method (Reference MunroMunro, 1989; Reference HockHock, 2005). Instrument height above the surface was determined using the SR50-measured height above the surface as all instruments on the weather station were installed at the same height. The surface roughness length was taken to be 0.0001m for snow and 0.001m for ice (Reference AltAlt, 1975). The surface was taken to be ice when the SR50 recorded a height above the surface greater than the winter snow accumulation measured at the end of May, after servicing the AWS and resetting instrument heights. An empirical stability correction factor of 5, appropriate for stable conditions prevailing over glaciers and ice caps, was used in the calculation of the sensible and latent heat fluxes (e.g. Reference Holtslag and de BruinHoltslag and de Bruin, 1988; Reference Klok, Nolan and Van den BroekeKlok and others, 2005). Glacier surface temperature was calculated from the measured outgoing longwave radiation using the Stefan–Boltzmann law on the assumption that snow and ice surfaces are black bodies with longwave emissivity of 1. The surface vapour pressure was set to the saturation vapour pressure at the calculated surface temperature if the surface temperature was <08C. When the surface temperature exceeded 08C, a saturation vapour pressure of 611Pa was used as per the definition for surface conditions of a melting surface. Calculation of sensible and latent heat fluxes with the bulk method requires use of the Monin–Obukhov length scale L which requires prior knowledge of the sensible heat flux and the friction velocity. L was thus determined iteratively. For the first iteration, the sensible heat flux and friction velocity were calculated from measured data and derived for the location of the weather station using the neutral case. Calculated values of L were used in subsequent iterations. No significant changes in L occurred beyond 20 iterations.
2.4. Evaluation of atmospheric conditions
Data from the North American Regional Reanalysis (NARR) were used to characterize surface and upper-level pressure and geopotential height variability over the Canadian Arctic. NARR data are available for 29 distinct layers from 1979 and have high spatial (32 km) and temporal (3 hourly) resolution (Reference MesingerMesinger and others, 2006).
Comparisons between the June, July and August mean upper-level (500 hPa) geopotential heights from NARR for 2005–10 (strong warming) and 2000–04 (moderate warming) were used to illustrate changes in the atmospheric conditions over the QEI during the 21st century. In addition, the daily NARR surface (1000 hPa), near-surface (850 hPa) and upper-level (500 hPa) geopotential heights for June, July and August 2007, 2008 and 2010 were analyzed to identify and track specific weather patterns (cyclonic– anticyclonic systems) associated with periods of high melt energy at site 2. The analysis of these weather patterns was then extended to 2000–10 to investigate changes in their frequency since the beginning of the 21st century and their relationship to changes in mean monthly upper-level atmospheric conditions.
3. Results and Discussion
3.1. Two-metre air temperature
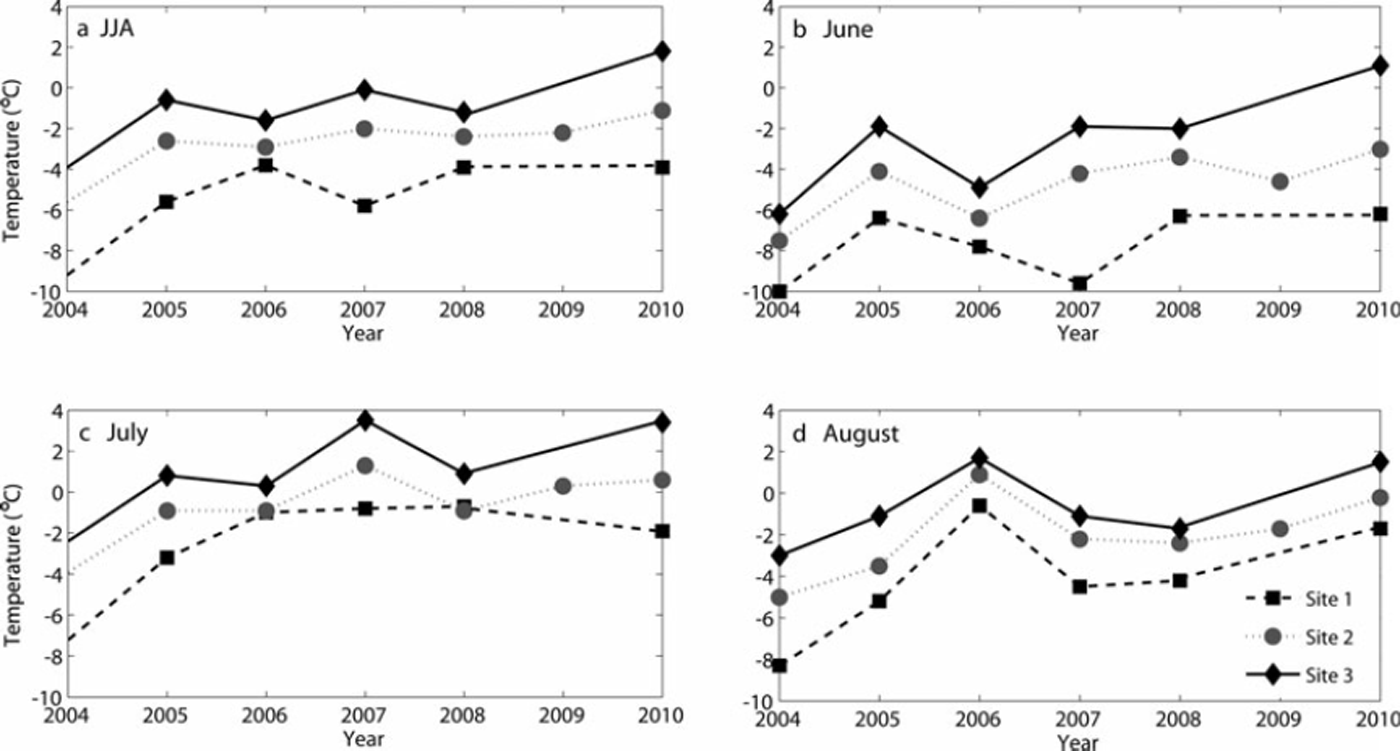
Annual values of the summer mean 2m air temperature (June–August average) and the monthly means for June, July and August are shown in Figure 2. At all sites and for each month 2m air temperature increased between 2004 and 2010; trends are all significant (p < 0.05) except for JJA at site 1 and August at site 3. July had the warmest surface air temperatures in each year, and mean temperatures at site 3 were above the melting point (08C) in that month in every year except 2004. August was usually warmer than June. The difference in monthly mean 2 m air temperature between the highest (site 1) and lowest (site 3) elevation stations ranged from 18C in July 2006 and 2008 to 78C in June 2007 and 2010. The smallest differences occurred in June–July 2006 (18C) and July 2008 (1.48C). The summer of 2006 was relatively cold in the Canadian Arctic, with the exception of August, which was warmer than the 2004–10 average, with a mean 2 m air temperature similar to that recorded in 2010, the warmest year in the 7year record (Fig. 2).
Average 2 m air temperature at site 1 (squares), site 2 (circles) and site 3 (diamonds) for (a) June–July–August (JJA), (b) June, (c) July and (d) August.
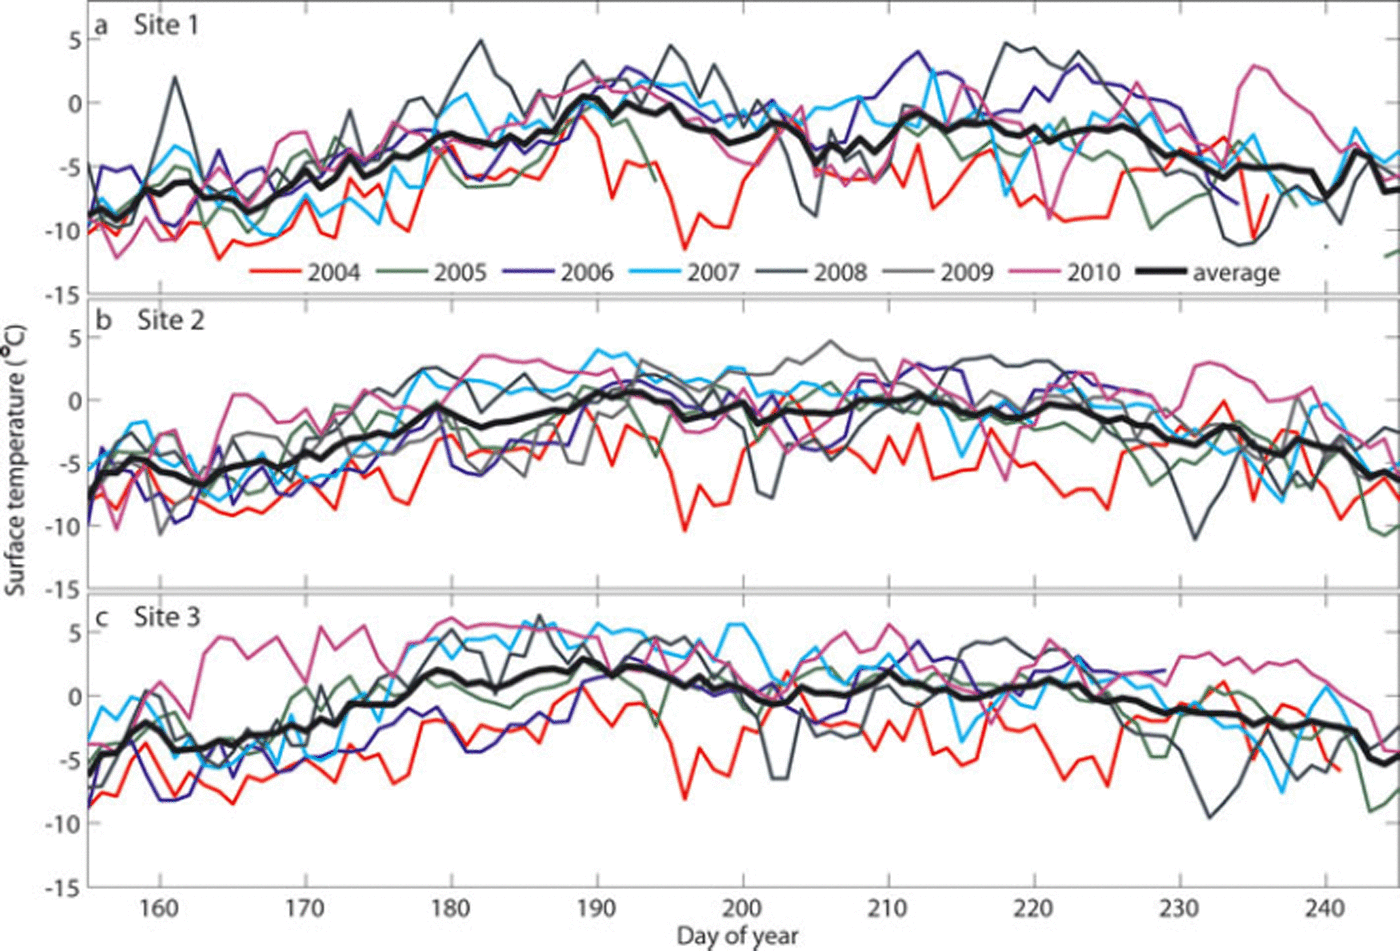
The summer daily mean 2 m air temperature increased between 2004 and 2010 (Fig. 3). Surface air temperatures were continuously below the 7year average at all sites in 2004, while 2010 was the warmest of the seven years. Daily mean 2 m air temperatures were near the 2004–10 average in 2005 and 2006, but above average in 2007 and 2008. This warming trend was previously reported by Reference Sharp, Burgess, Cogley, Ecclestone, Labine and WolkenSharp and others (2011) and has been simulated with the regional climate model Polar-WRF (Reference GreadyGready, 2012).
Time series of the daily average surface temperature at (a) site 1 , (b) site 2 and (c) site 3. The thick black line represents the 2004–10 daily average.
3.2. Melt season duration
The duration of the melt season, melt onset and freeze-up dates and the positive degree-day (PDD) total were calculated for each site and year. The melt onset and freeze-up dates are defined by the first and last day with mean 2 m air temperature above 08C. A 5 day running mean of the mean 2 m air temperature was used to filter out single-day extremes. The melt season duration is defined as the number of days between these two dates for each year and site. The melt duration, or number of melt days, was calculated by counting the number of days within each melt season with a mean 2 m air temperature above 08C. Although a daily maximum 2 m air temperature above 08C can occur on days with a mean 2m air temperature below 08C, we assume that meltwater produced on such days will refreeze or percolate, leading to negligible daily net melt and mass loss. This approach may neglect surface runoff of meltwater, especially at site 3 where winter accumulation is thinner and glacier ice is exposed faster. The PDD total was calculated by summing the daily mean 2 m air temperature for all days in a season when the average air temperature was positive. These values for the three sites are presented in Table 1 for each year from 2004 to 2010; period means and the annual rate of change of each parameter are also presented.
2004–10 melt onset and freeze-up day, melt duration and PDD total at AWS sites 1–3. The rightmost column represents the 2004– 10 annual rate. For the melt onset and freeze-up rate, negative values represent an advance and positive values represent a delay. In the rate column, values underlined and in bold are significant to p < 0.01, values in bold are significant to p < 0.05 and values not bold and underlined are significant to p < 0.1
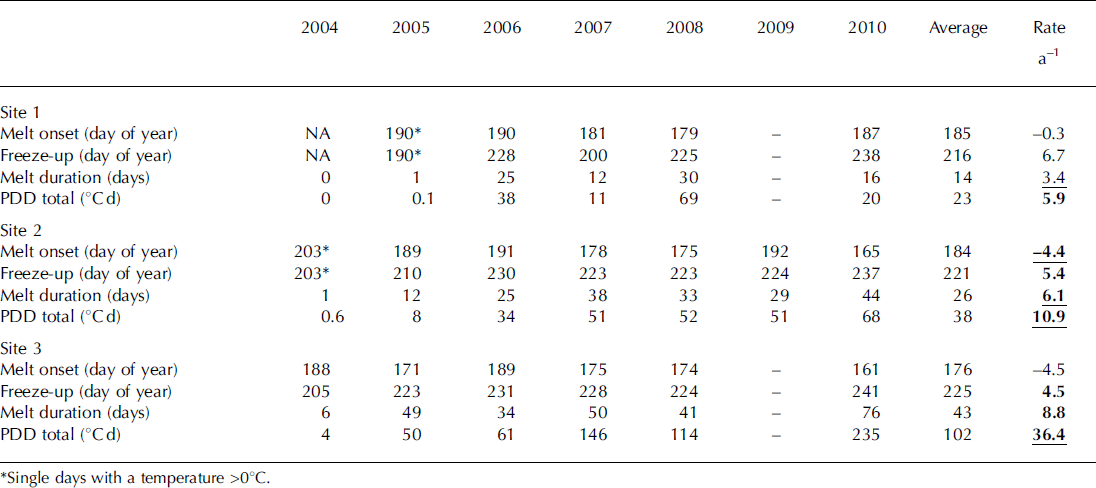
Melt duration ranged from <1 day at sites 1 and 2 (200405) to 76 days at site 3 (2010). No day with a mean surface air temperature above 08C was recorded at site 1 in 2004. Positive mean daily 2 m air temperatures were recorded in each melt season after 2005 at site 2 and in each season after 2006 at site 1. The single days with a temperature above 08C at site 1 (0.1 8C) in 2005 and site 2 (0.68C) in 2004 were assumed not to have produced significant net melt. Between 2004 and 2010, the timing of melt onset advanced by 0.3, 4.4 (p<0.01) and 4.5 days a- 1 at sites 1, 2 and 3, respectively, for an average of 3 days a- 1 (not significant). Similarly, the timing of freeze-up was delayed by 6.7, 5.4 (p<0.05) and 4.5 (p<0.05) days a- 1 at sites 1, 2 and 3, respectively, for a three-site average of 5.5 days a- 1 (p<0.05). The 2010 melt duration at site 1 was longer than the 2004 melt duration at site 3. After 6 years of warming, 2 m air temperatures initially observed only at 1000ma.s.l. were being observed at 1800 ma.s.l. where there was no surface melt at the start of the period. The annual PDD total also increased significantly (p<0.05) over time at all sites and increased with increasing melt season duration.
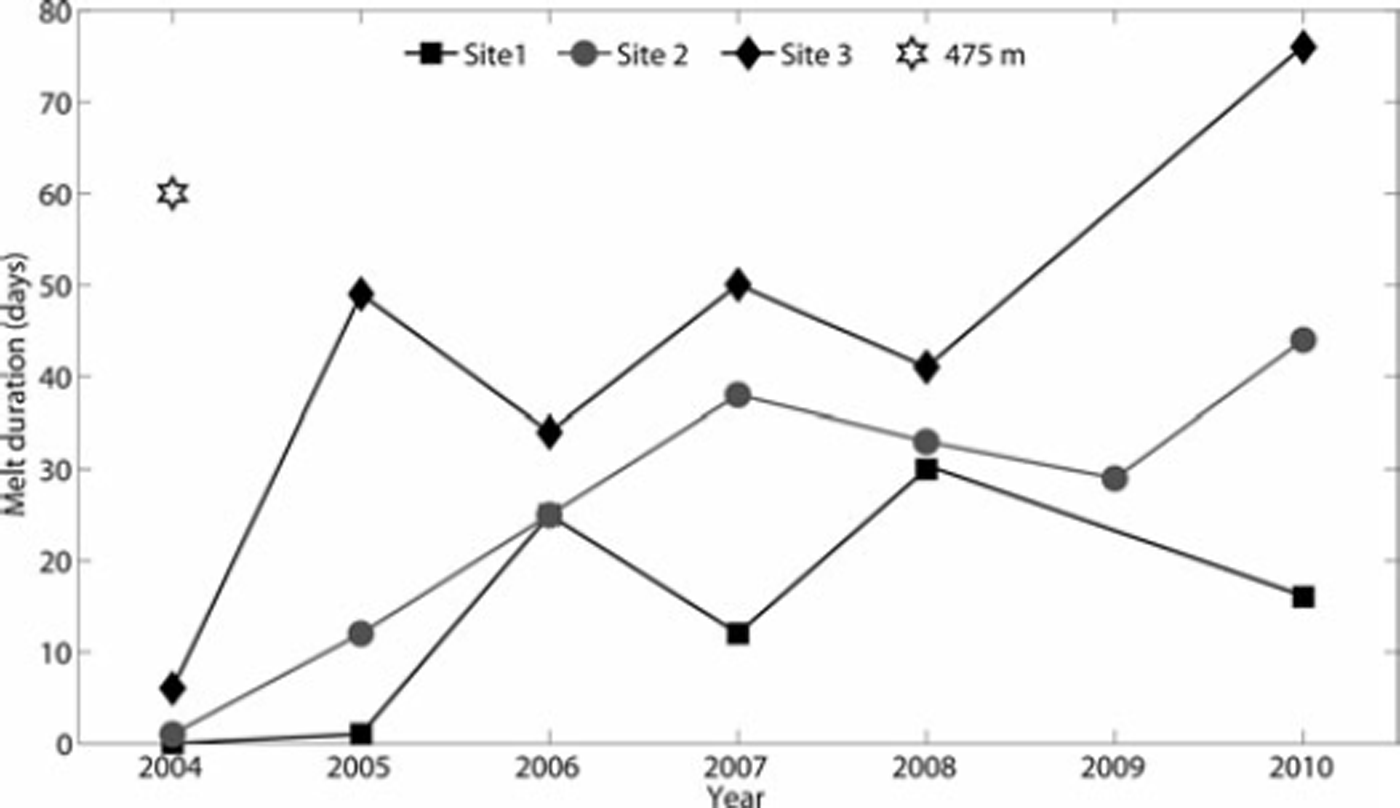
Between 2004 and 2010, an increase in melt duration was observed at sites 1-3 (Fig. 4). Melt durations at sites 2 and 3 after 2005-06 are comparable with that at HB 47-7 in 2004. Site 1, located close to the ice-cap summit, experienced the smallest increase in melt duration, suggesting that the warming has not yet raised mean daily air temperatures consistently above the melting point in summer at that location. The linear trends in melt duration from 2004 to 2010 were 3.4 (p<0.1; weak significance), 6.1 (p<0.01) and 8.8 (p<0.05) days a- 1 at sites 1, 2 and 3, respectively. In comparison, Reference Sharp, Burgess, Cogley, Ecclestone, Labine and WolkenSharp and others (2011) reported that the QuikSCAT-derived mean annual melt duration over the entire Devon Ice Cap increased by an average of 4.7 days between 2000-04 and 2005-09.
Melt duration (days) between 2004 and 2010 for site 1 (squares), site 2 (circles) and site 3 (diamonds). The 2004 HOBO-derived melt duration at site HB 47-7 at 475 m a.s.l. (white star) is also shown.
3.3. SEB analysis
Here the SEB is calculated from the AWS and net radiometer data for site 2 for 2007, 2008 and 2010. These are three of the four warmest years since 2004, both in the Canadian Arctic and on Devon Ice Cap (see Fig. 3). Investigating the melt energy components during these years will allow us to identify specific SEB regimes associated with high melt years. SEB was calculated for site 2 only, since it is the sole site for which the net radiometer provided near-complete measurements.
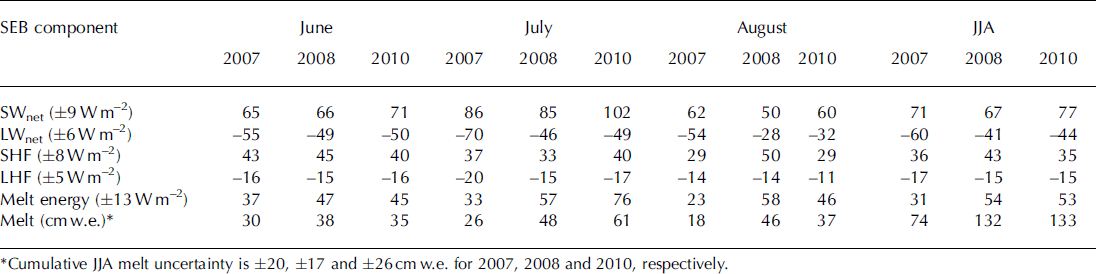
Table 2 shows the June, July, August and JJA daily averaged values of net shortwave radiation, net longwave radiation, sensible and latent heat fluxes, daily averaged melt energy and total monthly melt for the years 2007, 2008 and 2010 at site 2. Figure 5 shows the daily net shortwave radiation, net longwave radiation, sensible and latent heat fluxes and the daily averaged surface albedo at site 2 for the same years. The daily mean melt energy ranged from 23 to 58Wm– 2 , representing a daily average melt rate of 0.6–1.5 cm w.e. d–1. Net shortwave radiation was the main source of melt energy (50–102 W m–2 as a daily average), in agreement with previous studies in the High Arctic (e.g. Reference BraithwaiteBraithwaite, 1981; Reference Klok, Nolan and Van den BroekeKlok and others, 2005). The net longwave radiation was a sink of melt energy (–28 to –70 W m–2 as a daily average). The mean daily sensible heat flux, which ranged between 29 and 50Wm– 2 , was the second largest source of melt energy. The large mean sensible heat flux is consistent with the large observed difference between the 2 m air temperature and the temperature of the air just above the surface, and the high summer mean daily surface wind speed (14kmh–1). The latent heat flux is an energy sink in the SEB, with an average daily value between –11 and –20Wm–2. Devon Ice Cap is a relatively dry environment with a summer average relative humidity of 75%, which promotes evaporation and sublimation and reduces the contribution of the latent heat flux to surface melt. The average surface albedo decreases until approximately day of year 195 (mid-July) as the degree of metamorphism of surface snow increases and the underlying ice surface is eventually exposed. Thereafter, it exhibits oscillatory behavior, reflecting changes in surface condition between snow, bare ice, and ponded and refrozen meltwater.
2007, 2008 and 2010 monthly averages of daily averaged net shortwave radiation (SWnet), net longwave radiation (LWnet), sensible heat flux (SHF), latent heat flux (LHF) and daily averaged melt energy for June, July, August and June–July–August (JJA) at site 2. Melt (cm w.e.) is the total monthly and JJA values for 2007, 2008 and 2010. Value in parentheses is the averaged calculated uncertainty
Daily averages of net surface shortwave radiation (SWnet), sensible heat flux (SHF), net surface longwave radiation (LWnet) and latent heat flux (LHF) at site 2 in (a) 2007, (b) 2008 and (c) 2010. Daily average of surface albedo (black line) is also plotted. The period is for day of year 150 (30 May) to 250 (7 September). The black lines identify periods associated with the second high melt SEB regime.

The computed JJA melt at site 2 increased progressively from 74 to 132 to 133 cmw.e. in 2007, 2008 and 2010, respectively. Changes in the net longwave, net shortwave and sensible heat flux components of the SEB are the main contributors to the observed increase in melt for each summer month (Table 2). The smallest variation in SEB occurred in June, when little variation in any of the components was observed. In July, an increase in net shortwave radiation from 86–85 W m–2 in 2007–08 to 102Wm– 2 in 2010 and a decrease in net longwave radiation in 2008 and 2010 (–46 and –49Wm–2) compared with 2007 (–70 Wm–2) are responsible for the gradual increase in melt energy for that month. In August, the largest changes in SEB came from an increase in the net longwave radiation in 2008 and 2010 (–28 and –32Wm–2) compared with 2007 (–54Wm–2) and a 60% increase in sensible heat flux in 2008 compared with 2007 and 2010. The latent heat flux contribution remained quasi-constant for each year and month.
The observed increase in melt energy from 2007 to 2010 is most marked in July and August and is mainly due to an increase in net shortwave radiation (associated with lower surface albedo) in July and an increase in net longwave radiation in August. As the net longwave radiation is a sink of energy for melt, its increase implies a reduced sink and an increase in the SEB. The increase in net longwave radiation is consistent with the observed increase in 2 m air temperature measured by the three weather stations on Devon Ice Cap, as a warmer atmosphere will increase the downwelling infrared radiation while the upwelling longwave flux is limited by the melting temperature of the snow/ice surface. In 2008, the high calculated melt energy was also due to a high value of the average sensible heat flux in August despite lower measured 2 m air temperature compared with 2007 and 2010. On Devon Ice Cap, the sensible heat flux is positively correlated with both the air temperature and the wind speed, and a higher daily averaged wind speed in August 2008 was responsible for the high calculated sensible heat flux (not shown).
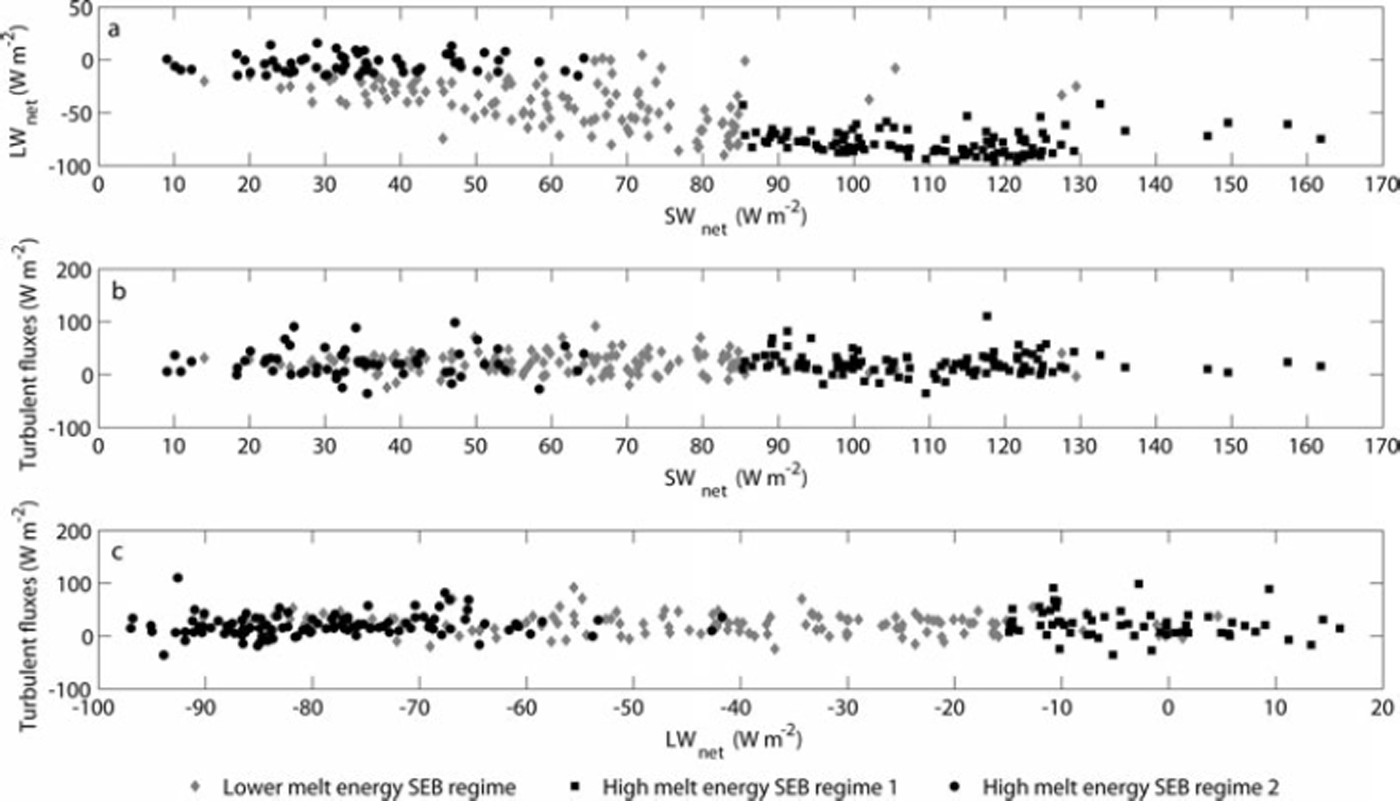
Two different SEB regimes associated with high daily melt energy were identified and are observed in each year. The daily average values of each of the SEB components for all days in June, July and August 2007, 2008 and 2010 define the two high melt regimes (Fig. 6). The first regime is characterized by consistently high net shortwave radiation (118Wm–2 average) and low net longwave radiation (-77 Wm–2 average), with the high net shortwave radiation being the dominant component (Fig. 6a); this leads to increased incoming energy. This regime is more common at the beginning of each melt season and is typical of June and July (see Fig. 5). The second regime is characterized by lower net shortwave radiation (average of 40Wm–2 ) and higher net longwave radiation (average of -3.4Wm–2) (Fig. 6a). This regime is observed at the end of each melt season, typically following day of year 210 (29 July), and each individual period dominated by this regime lasted 3-5 days. A third regime, associated with low melt energy, is characterized by lower values of all components of the SEB. In none of the three melt regimes do the turbulent fluxes have a dominant influence (Fig. 6b and c). These fluxes also never account for >50% of the net daily melt energy in either June, July or August.
Daily average contribution of (a) net surface shortwave radiation (SWnet) against net surface longwave radiation (LWnet), (b) SWnet against turbulent fluxes and (c) LWnet against turbulent fluxes in June, July and August 2007, 2008 and 2010. The black squares (on the right) and black circles (on the left) represent two different combinations of the SEB components associated with high melt energy. The black squares represent high SWnet and low LWnet, conditions associated with an anticyclonic circulation over the Canadian Arctic. The black circles are associated with high LWnet and low SWnet and are typical of the occurrence of southwesterly low-pressure systems. The grey diamonds represent the low melt regime, associated with lower values of each of the SEB components.
3.4. Accuracy and validation of SEB model
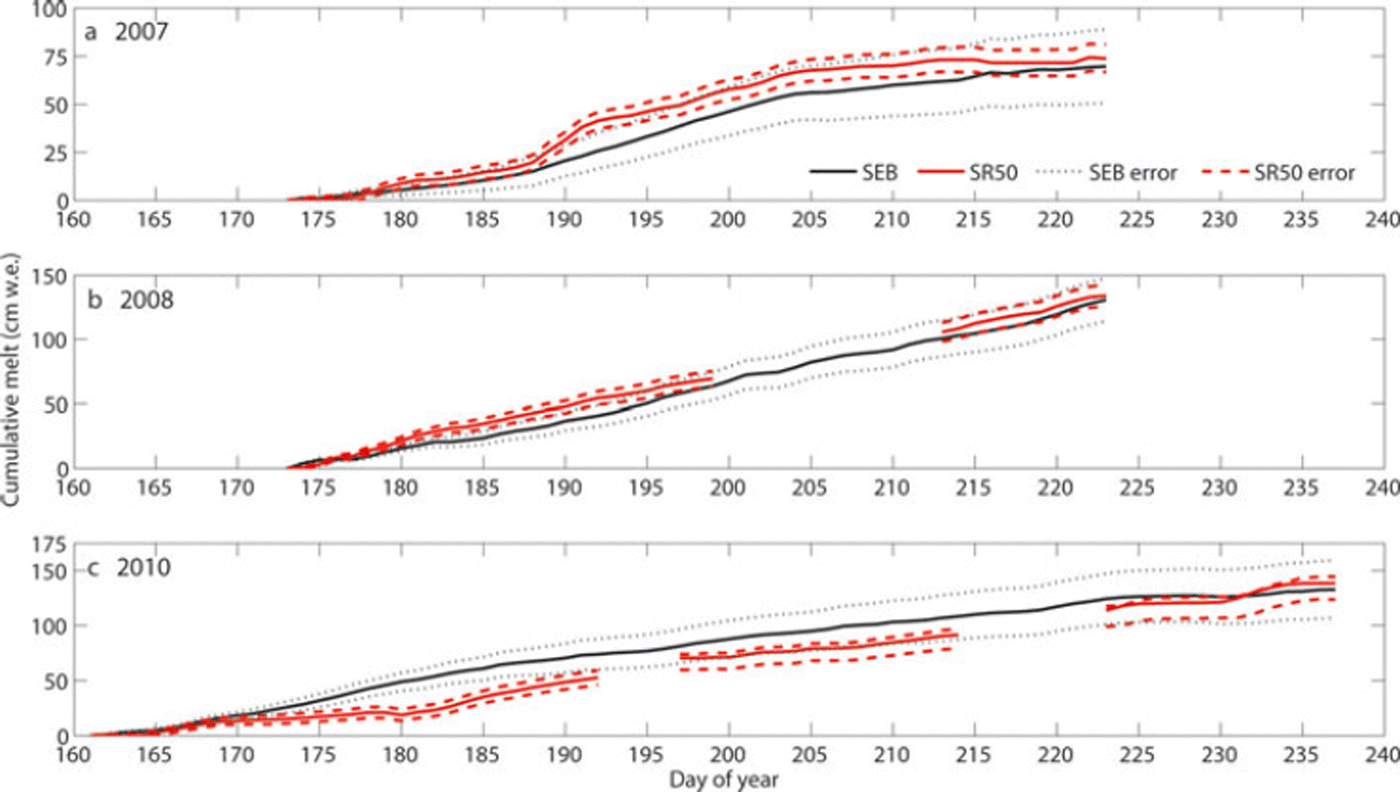
Each component of the calculated SEB is associated with measurement errors provided by the instrument manufacturers (see Section 2.1). The net radiometer instrument’s accuracy of 10% led to a daily average error of ±9Wm–2 (range 1-17Wm–2) and ± 6 Wm – 2 (range 2-10Wm–2 ) for the net shortwave and net longwave radiation, respectively. The calculations of the latent and sensible heat fluxes imply that there is a systematic error related to the input of each of the measured environmental variables (wind, 2 m air temperature, relative humidity). Using the propagation of error approach and the accuracy of each of the AWS instruments, we found that the daily average error associated with the calculation of the sensible heat flux was ± 8 Wm– 2 (range ± 1 - 2 4 Wm– 2 ) and the daily average error associated with the calculation of the latent heat flux was ± 5 Wm–2 (range ±1-21 Wm–2) ; the daily average error associated with the calculation of the melt energy was ±13Wm–2 (range ±2-35 Wm–2) . The mean error associated with the calculation of the daily melt rate was then ±0.003 cm w.e. (range ±0.0004-0.009 cm w.e.). Cumulative JJA melt error was estimated to be ± 2 0 , ± 1 7 and ± 2 6 cm w.e. for 2007, 2008 and 2010, respectively.
The calculated SEB melt is validated against melt measured directly by the SR50 instrument installed on the AWS at site 2 (Fig. 7). An average firn/ice density of 850 kgm–3 derived from shallow ice-core measurements at site 2 was used to convert the SR50 height measurements (in cm) into cm w.e. quantities. The SR50 measured a cumulative melt value of 75, 134 and 134 cm w.e. compared with 74 to 132 to 133 cm w.e. for the calculated SEB melt in 2007, 2008 and 2010, respectively. For all three years, the cumulative melt derived from the SEB calculation is consistent with the value of the SR50-measured melt and its uncertainty. In 2007, both curves are consistent with each other, and the SEB model underestimates the cumulative melt at the end of the season by only ∼ 1 % compared with the SR50 value. The main difference between the two curves is the inability of the SEB model to capture the sharp melt event at about day of year 190 (9 July). In 2008, the two curves are very similar and overlie each other, with the SEB calculations consistently underestimating the SR50 measured melt by 1-2%. We note that the SR50 failed temporarily between days of year 198 and 213 (16 July–1 August) without impairing the results. Although the cumulative melt derived from the SEB calculation is consistent with the SR50-measured melt at the end of the 2010 melt season, the two curves are not consistent with each other during one-third of the melt season. By this time, the SR50 was >5 years old and, as shown by its multiple failures over the course of that melt season, its measurements may have been inaccurate.
Cumulative melt calculated from the SEB (black) and derived from the SR50 instrument (red) at site 2 for (a) 2007, (b) 2008 and (c) 2010. The black dotted line represents the cumulative error of the calculation of the SEB associated with measurement error. The red dashed line represents the cumulative measurement error of the SR50 instrument; cumulative error was ±7cm for 2007 and 2008 and ±9 cm for 2010. Data gaps in 2008 and 2010 are due to brief malfunctions of the SR50.
3.5. Atmospheric conditions and their association with surface melt
Changes in the atmospheric circulation and short-term (2-5 days) weather patterns over the Canadian Arctic in June, July and August are clearly related to the observed increases in 2 m air temperature and melt season duration since 2004 and they are also a driving mechanism of the shifts in the nature of the SEB regime associated with periods of high melt.
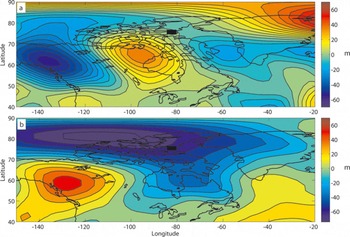
Relative to 2000-04, 2005-10 was characterized by a positive 500 hPa geopotential height anomaly over the southern Canadian Arctic in June and July (Fig. 8a). This anomaly defines a steeper and more persistent 500 hPa ridge associated with a strong anticyclonic circulation over the region. Based on the analysis of daily weather conditions, the occurrence of this upper level ridge in June and July was twice as high in 2005-10 (average of 23 days a-1) as in 2000-04 (average of 11 daysa–1). In agreement with previous studies (Reference AltAlt, 1987; Reference Wang, Sharp, Rivard, Marshall and BurgessWang and others, 2005), these results suggest that the higher melt years observed in 200510 are associated with a more persistent and steeper 500 mbar ridge than was present in the summers of 2000– 04. This anticyclonic circulation brings warm air into the Canadian Arctic from the south. The intensification of the ridge after 2004 signifies greater northward advection of warm air from the North American continent to the west of Hudson Bay, contributing to the observed increase in 2 m air temperature in June and July.
NARR 500 hPa geopotential height (m) difference between 2005–10 and 2000–04 for (a) July and (b) August. Devon Ice Cap is identified by the black rectangle. Contour intervals are every 5 m for (a) and every 10 m for (b).
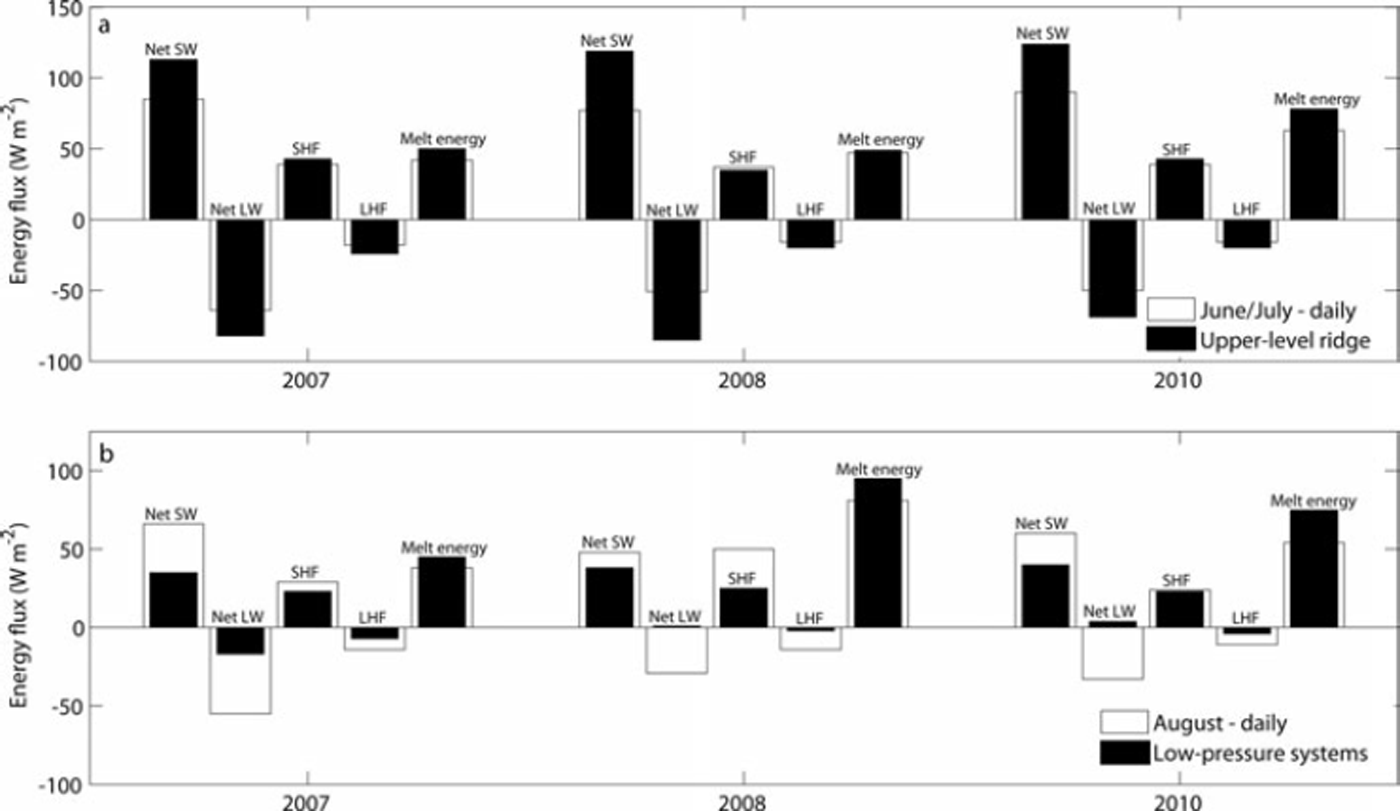
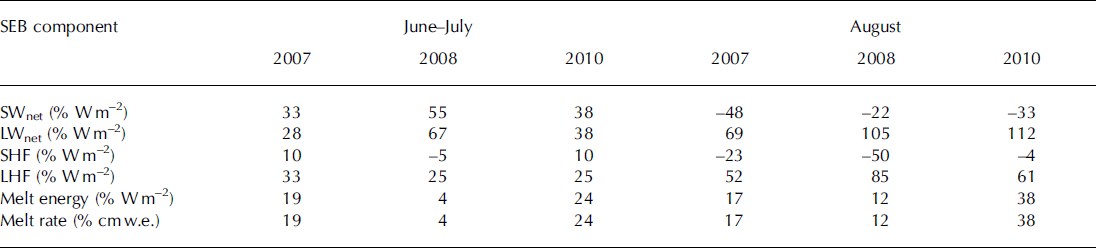
Anticyclonic circulations are also characterized by cloud-free conditions, and their intensification contributed to observed increase in SEB and melt energy. An increase in their intensity and persistence results in increased incoming shortwave radiation and progressively lower surface albedo (see Fig. 5, days of year 170–190), primarly intensifying the shortwave component of the SEB and the overall melt energy (Fig. 9a). This SEB regime is seen in June and July of 2007, 2008 and 2010. It is characteristic of the first high melt SEB regime identified in Figure 6 and is associated with the first periods of high melt in each year. It is responsible for a 4–24% increase in melt energy in June and July (Table 3) relative to June–July daily average.
Daily averaged net surface shortwave radiation (SW), net surface longwave radiation (LW), sensible heat flux (SHF), latent heat flux (LHF) and melt energy in 2007, 2008 and 2010 for (a) June–July daily averages (white) and daily averages coinciding with the occurrence of a strong 500 hPa ridge (black) and (b) August daily averages (white) and daily averages on days coinciding with the occurrence of low-pressure systems over the Canadian Arctic (black).
Relative changes (%) of the daily net shortwave radiation (SWnet), net longwave radiation (LWnet), sensible heat flux (SHF), latent heat flux (LHF) and daily averaged melt energy and melt rate for 2007, 2008 and 2010 between: (1) June–July averaged conditions and days associated with strong 500 hPa ridges (in June–July), characterizing SEB regime 1 ; and (2) August averaged conditions and days associated with the passage of southwesterly low-pressure systems (in August), characterizing SEB regime 2
A negative 500 hPa geopotential height anomaly was present over the QEI in August during 2005–10 (Fig. 8b). Such an anomaly implies an upper-level trough that is typically associated with surface low-pressure systems. When the upper-level trough extends to high enough latitudes, the associated surface systems travel north towards the QEI, and their advancing warm surface fronts advect warm and moist air into the Arctic from the south. Analysis of daily NARR 1000 and 825 hPa geopotential height data shows that low-pressure systems arriving from the southwest and moving towards the north and northeast reached the Canadian Arctic in August each year during 2005–10 (and once in late July in 2008). These systems had a lifetime of 3–5 days. Devon Ice Cap is located sufficiently far south to be influenced by this northeastward transport of warm air. Only one or two such low-pressure systems were observed in August each year during 2000–04, but they occurred more frequently (two to four per year) and later in August between 2005 and 2010. The increase in occurrence of such systems contributed to the observed increase in 2 m air temperature, and their timing becoming progressively later in August can explain the end of the melt season becoming later by 4.5–6.7 days a–1 during 2004–10.
The SEB regime was also influenced by the occurrence of these southwesterly low-pressure systems. Indeed, a 12–38% increase in melt energy relative to the averaged August daily melt energy is associated with the occurence of such systems. This change in melt energy is mainly due to an increase in net longwave radiation and a decrease in net shortwave radiation lasting for the observed lifetime of the surface low-pressure systems (3–5 days) (Fig. 9b; Table 3). Compared with the 2007–10 August daily average, net longwave radiation increased by >100% (and even became positive) during such low-pressure conditions in 2008 and 2010. During the overcast conditions associated with low-pressure systems, clouds will absorb and re-emit longwave radiation, increasing the downwelling component of longwave radiation. At the same time, net shortwave radiation is reduced significantly relative to the 2007–10 August daily average due to blocking of incoming shortwave radiation by clouds. Such conditions are characteristic of the second high melt SEB regime identified in Figure 6 and are characterized primarly by the reduction in longwave radiation losses from the surface. At the same time, significant increases in the latent heat flux and decreases in the sensible heat flux were observed during low-pressure systems. This is consistent with an increase in relative humidity promoting condensation during precipitation events and a surface temperature that is closer to the 2 m air temperature due to the mixing of the air column by strong winds during surface low-pressure systems.
4. Summary and Conclusion
Changes in melt season characteristics at three elevations on Devon Ice Cap were examined for 2004–10. The SEB and melt rate were calculated for site 2 for three years in the period 2007–10, and the observed changes in air temperature and SEB were linked with changes in the Arctic atmospheric circulation in the early 21st century.
A sharp increase in the summer mean surface air temperature occurred after 2004. Between 2004 and 2010, the timing of melt onset advanced by a three-site average of 3 days a–1 and the timing of freeze-up was delayed by a three-site average of 5.5 days a–1 (p < 0.05). Over that same period, the melt season duration increased by 3.4 (p < 0.1; weak significance), 6.1 (p < 0.01) and 8.8 (p < 0.05) days a–1 at 1800, 1300 and 1000m a.s.l., respectively, and melt durations typical of ice marginal locations (475ma.s.l.; HB 47-7) in 2004 were observed at locations 900m higher on the ice cap in 2010.
Associated with the observed increase in air temperature was an increase in calculated melt rates at site 2 from 74 cmw.e.a–1 in 2007 to 132 and 133 cmw.e.a–1 in 2008 and 2010, respectively, consistent with direct measurements of melt at the same location. Although each component of the SEB contributed to the increased melt, two distinct SEB regimes associated with high melt rates were identified: one associated with high net shortwave radiation in June and July and one with relatively high net longwave radiation and reduced net shortwave radiation in August. These were associated with distinctive features of the Arctic atmospheric circulation.
A steeper and more persistent 500 hPa ridge associated with a strong anticyclonic circulation over the region in June and July 2005–10 accounted for the higher observed 2 m air temperature and calculated melt in June and July. This was associated with greater net shortwave radiation, which promoted rapid metamorphism and eventual removal of the snow, decreased the mean surface albedo, and increased the melt energy available early in the season by 4–24% between 2007 and 2010.
In August, increased occurrence of southwesterly low-pressure systems in 2005–10 compared with 2000–04 delayed the end of the melt season over Devon Ice Cap by an average of 5.5 days a–1 (p < 0.05) at the three sites. These weather patterns enhanced surface melt by advection of warm air into the Arctic (which increased the melt energy derived from the turbulent fluxes and accounted for the observed increase in 2 m air temperature) and by increasing the net longwave radiation by enhancing its downwelling component via greater emission from more extensive cloud cover (even though it also decreased the net shortwave radiation by blocking incoming shortwave radiation). Under these conditions, melt energy increased by 12–38% between 2007 and 2010 compared with the August daily average. The changes in the summer atmospheric circulation over the Canadian Arctic are implicated in the recent increase in summer mean air temperature and in the sharp increase in melt energy and melt on the ice cap in the 21st century.
Acknowledgements
Financial support for this research was provided by thr Natural Sciences and Engineering Research Council (NSERC) of Canada, the Alberta Ingenuity Fund, the Fonds de Recherche du Quebec – Nature et Technologies (FQRNT) and the Canadian Meteorological and Oceanic Society (CMOS) through scholarships and grants to G. Gascon. Fieldwork was funded by a NSERC Discovery Grant and Northern Research Supplement to M. Sharp, and by Canadian Circumpolar Institute and Northern Scientific Training Program grants to G. Gascon. The Polar Continental Shelf Project (PCSP) provided logistic support for the fieldwork. We thank the 2004–10 field teams and partners on Devon Ice Cap, Nunavut, for installing and maintaining the meteorological instruments. Permission to conduct research on Devon Ice Cap was kindly granted by the Nunavut Research Institute and the communities of Grise Fjord and Resolute Bay. We also thank the Scientific Editor M. Huss and two anonymous reviewers for comments and suggestions that greatly improved the manuscript.



